System and Method for Identifying Patterns in and/or Predicting Extreme Climate Events

a technology for predicting extreme climate events and identifying patterns, applied in the field of methods and systems for predicting extreme weather, can solve the problems of extreme uncertainty, extreme discomfort for individuals, and inability to find a store with air conditioners or fans left in stock, so as to improve lead time and skill.

Inactive Publication Date: 2013-01-24
RGT UNIV OF CALIFORNIA
View PDF18 Cites 26 Cited by
  • Summary
  • Abstract
  • Description
  • Claims
  • Application Information

AI Technical Summary

Benefits of technology

[0011]The present invention provides statistical and empirical frameworks to improve the lead-time and skill of extended range weather forecasts. The method and system according to the present invention, tools are provided for providing seasonal to multi-year weather predictions based on statistical modeling of climate variability.

Problems solved by technology

In the peak of summer, it is not uncommon for individuals to be unable to find a store with air conditioners or fans left in stock.
Extreme weather can cause extreme discomfort for individuals and extreme uncertainty when it comes to finances.
From the superstore wishing it had planned to stock more winter coats to the homeowner concerned about his or her next energy bill, guessing wrong on weather can become a disaster for business and consumer budgets alike.
Massive flooding from intense storms has devastated large areas of Australia and regions in Asia.
Recent severe winter storms have repeatedly paralyzed the Midwest and much of the East Coast of the U.S. Lives are lost, homes and property are destroyed, transportation is crippled, emergency response is slowed or prevented, long term power outages occur, and countless other normal daily activities are impacted, costing millions of dollars in damage and lost business opportunities.
Extreme cold spikes in wintertime temperature increase demand for heating which, in turn, leads to greater usage of commodities such as oil and natural gas, while extreme heat spikes increase electricity consumption, leading to the need for rolling brown-outs to prevent grid overload.
It has been said that weather is the most volatile external factor that influences consumer and market behavior.
However, because weather is a highly complex process that is forced by a large number of variables, it can be difficult to precisely model it by creating a mini-atmosphere in computer models, which is the primary approach for currently-available products.
Nonetheless, forecasts with lead times on the order of two-weeks to a month remain a challenge.
Unfortunately, these rules-of-thumb do not always hold, creating variable and often low confidence in medium-range to seasonal scale forecasts.
There are many findings and rules-of-thumb relating local or remote weather and climate features to severe cold outbreaks, but these relationships do not hold for all events, which presents difficulties for operational meteorologists.
Comprehensive probabilistic tools relating weather / climate conditions to historical cold air outbreaks would help to improve predictions in both accuracy and lead-time, however, such comprehensive probabilistic information is not readily available.

Method used


Image

  • System and Method for Identifying Patterns in and/or Predicting Extreme Climate Events
  • System and Method for Identifying Patterns in and/or Predicting Extreme Climate Events
  • System and Method for Identifying Patterns in and/or Predicting Extreme Climate Events

Examples


example 1

Severe Cold Event

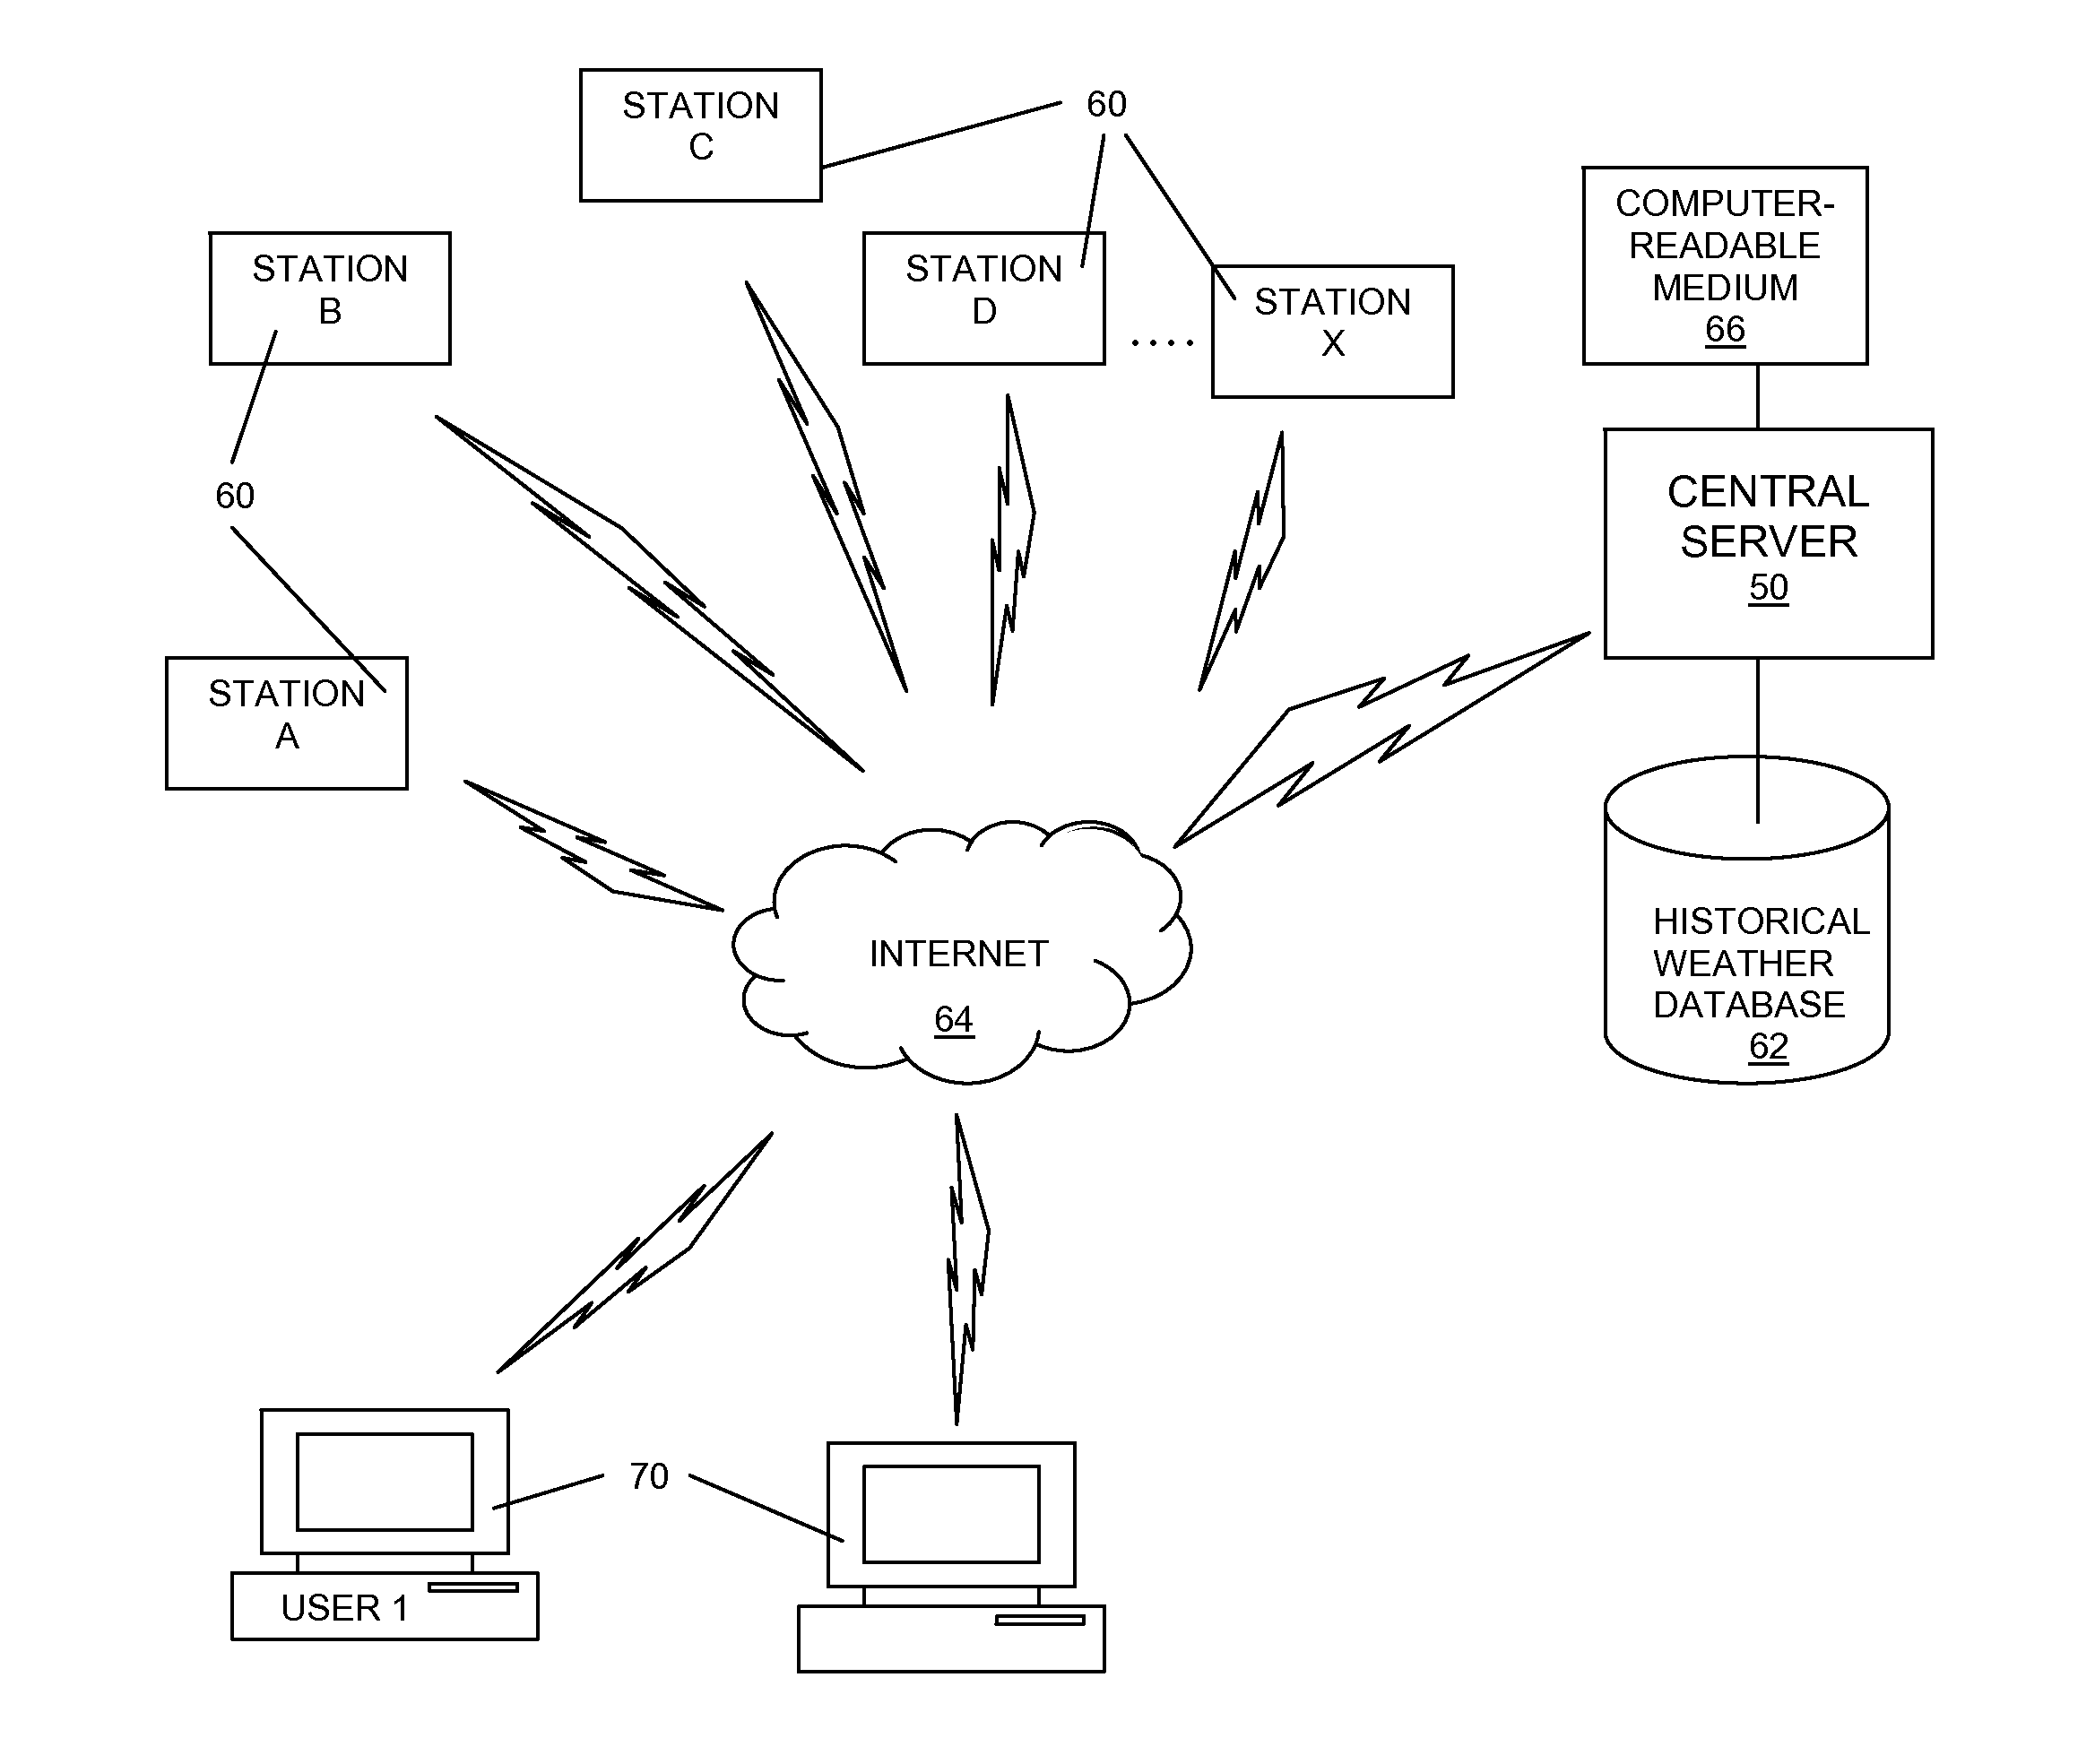
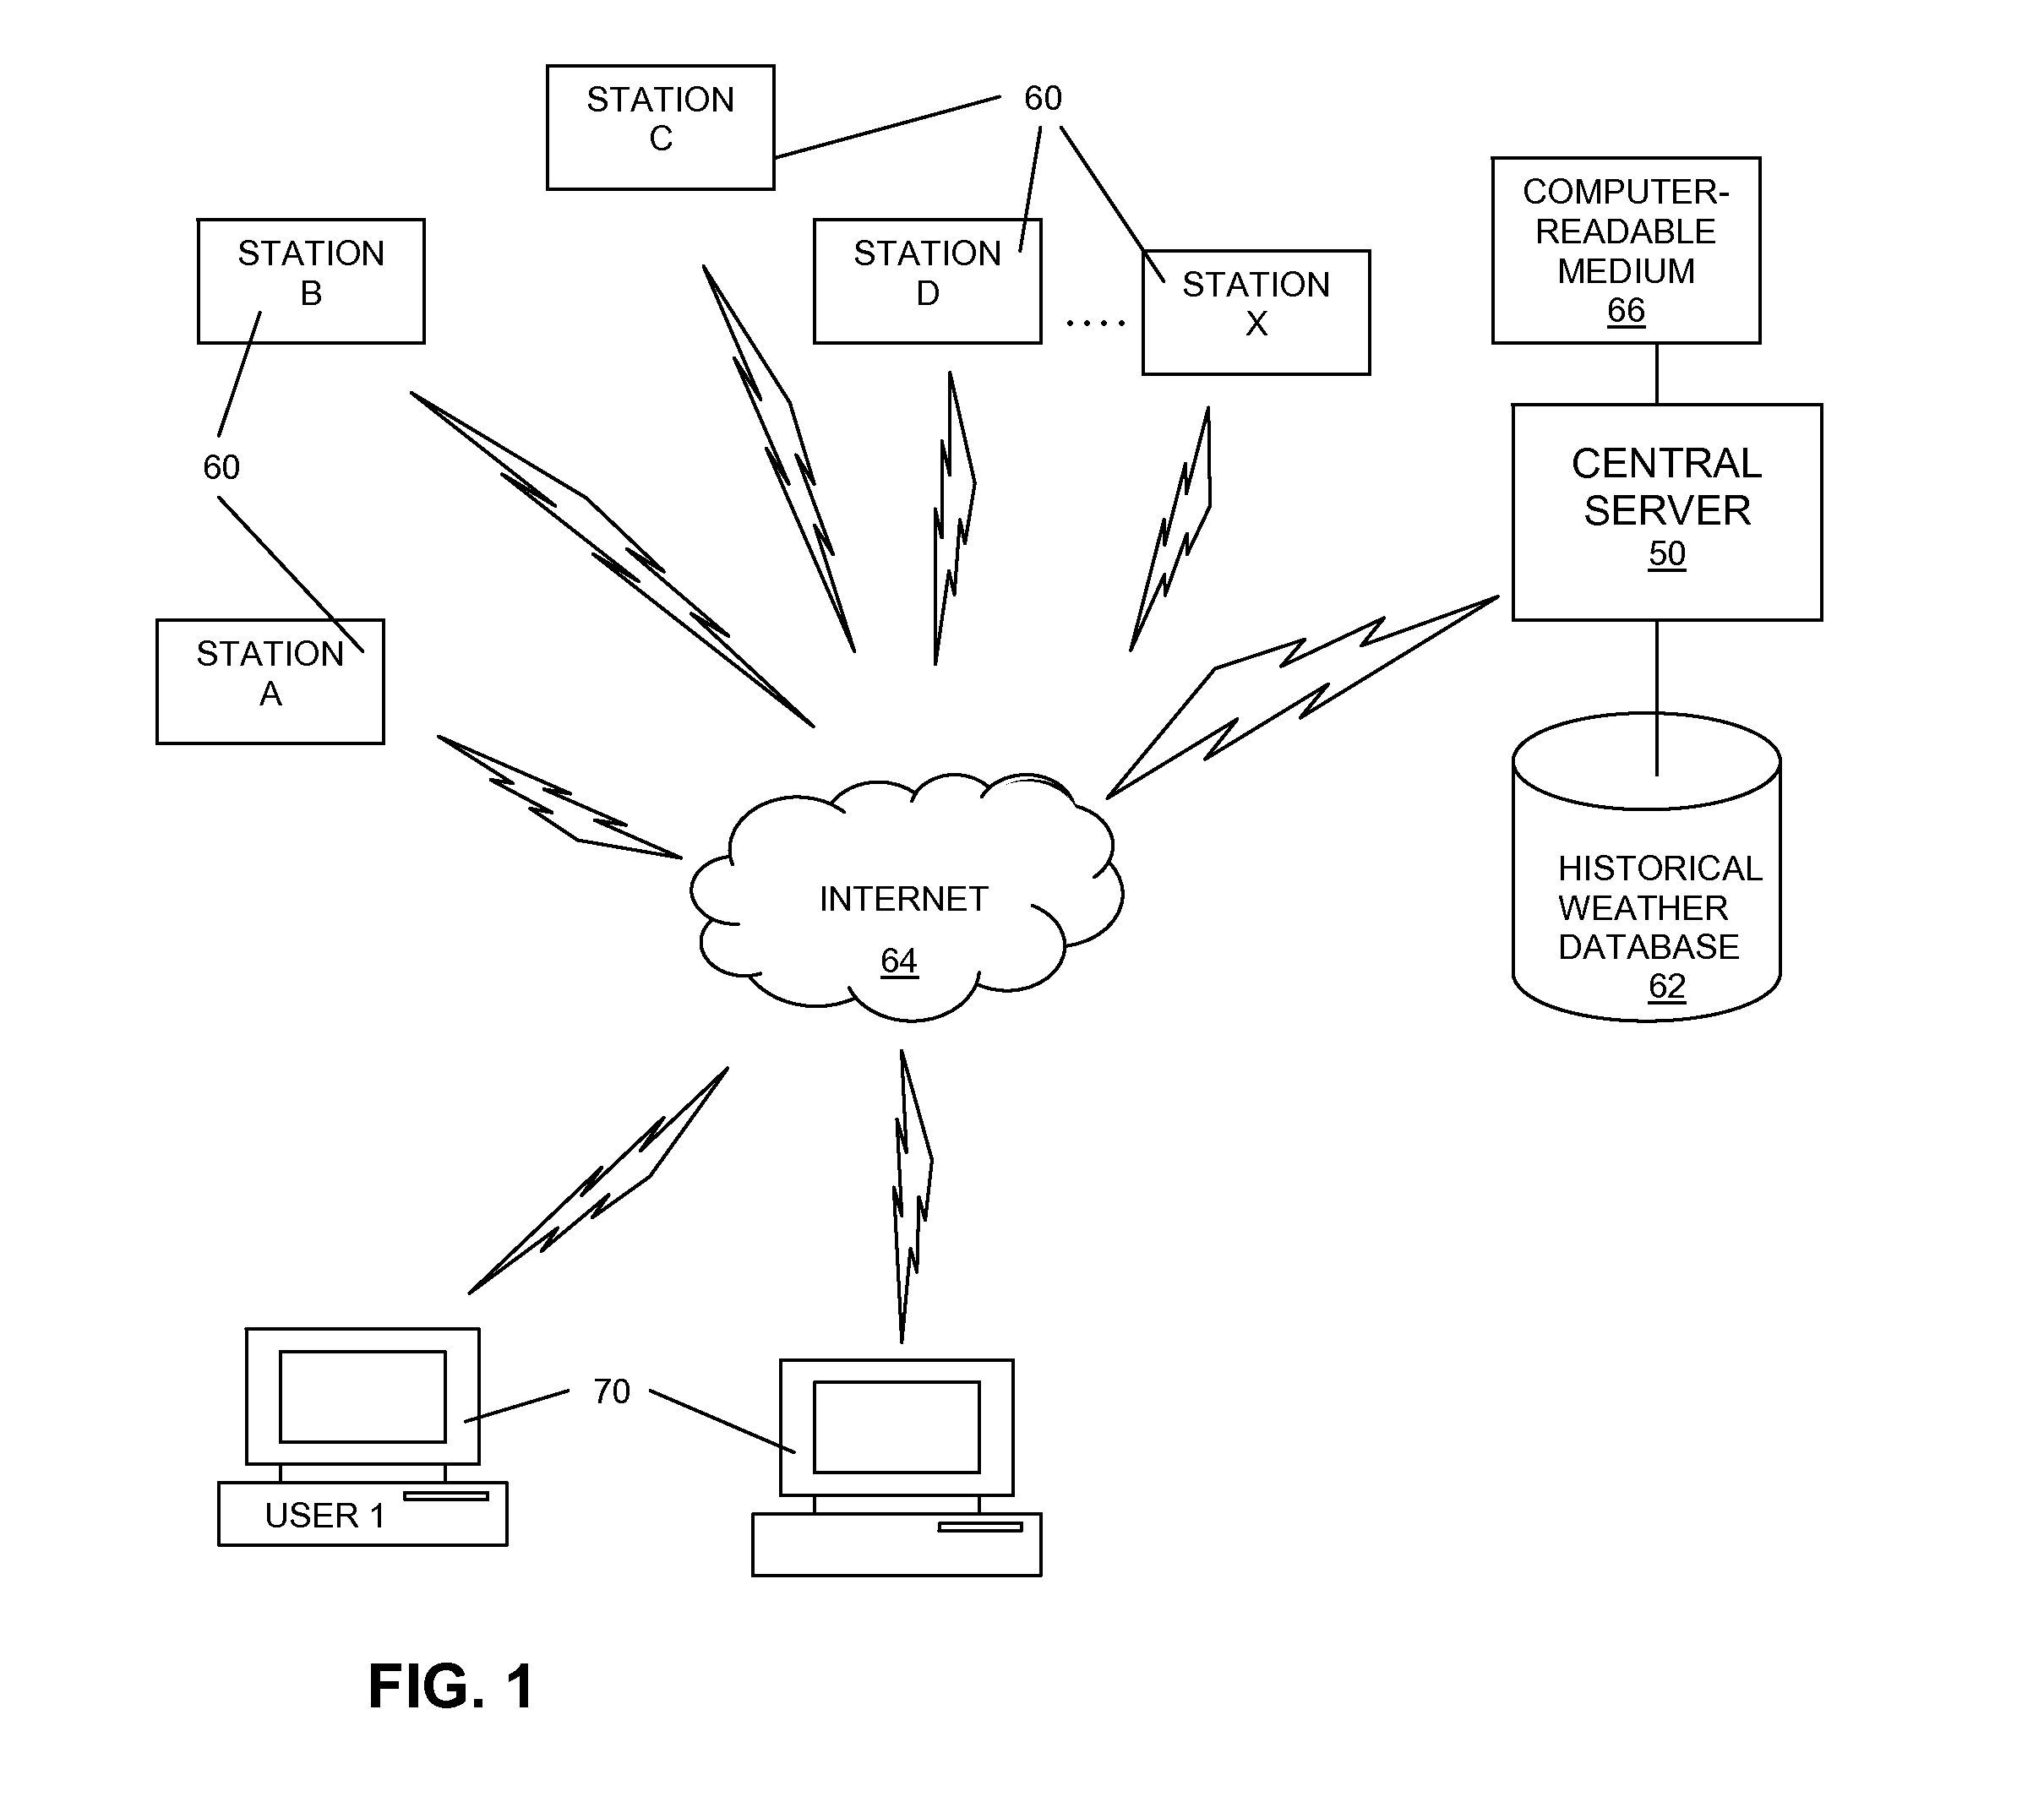
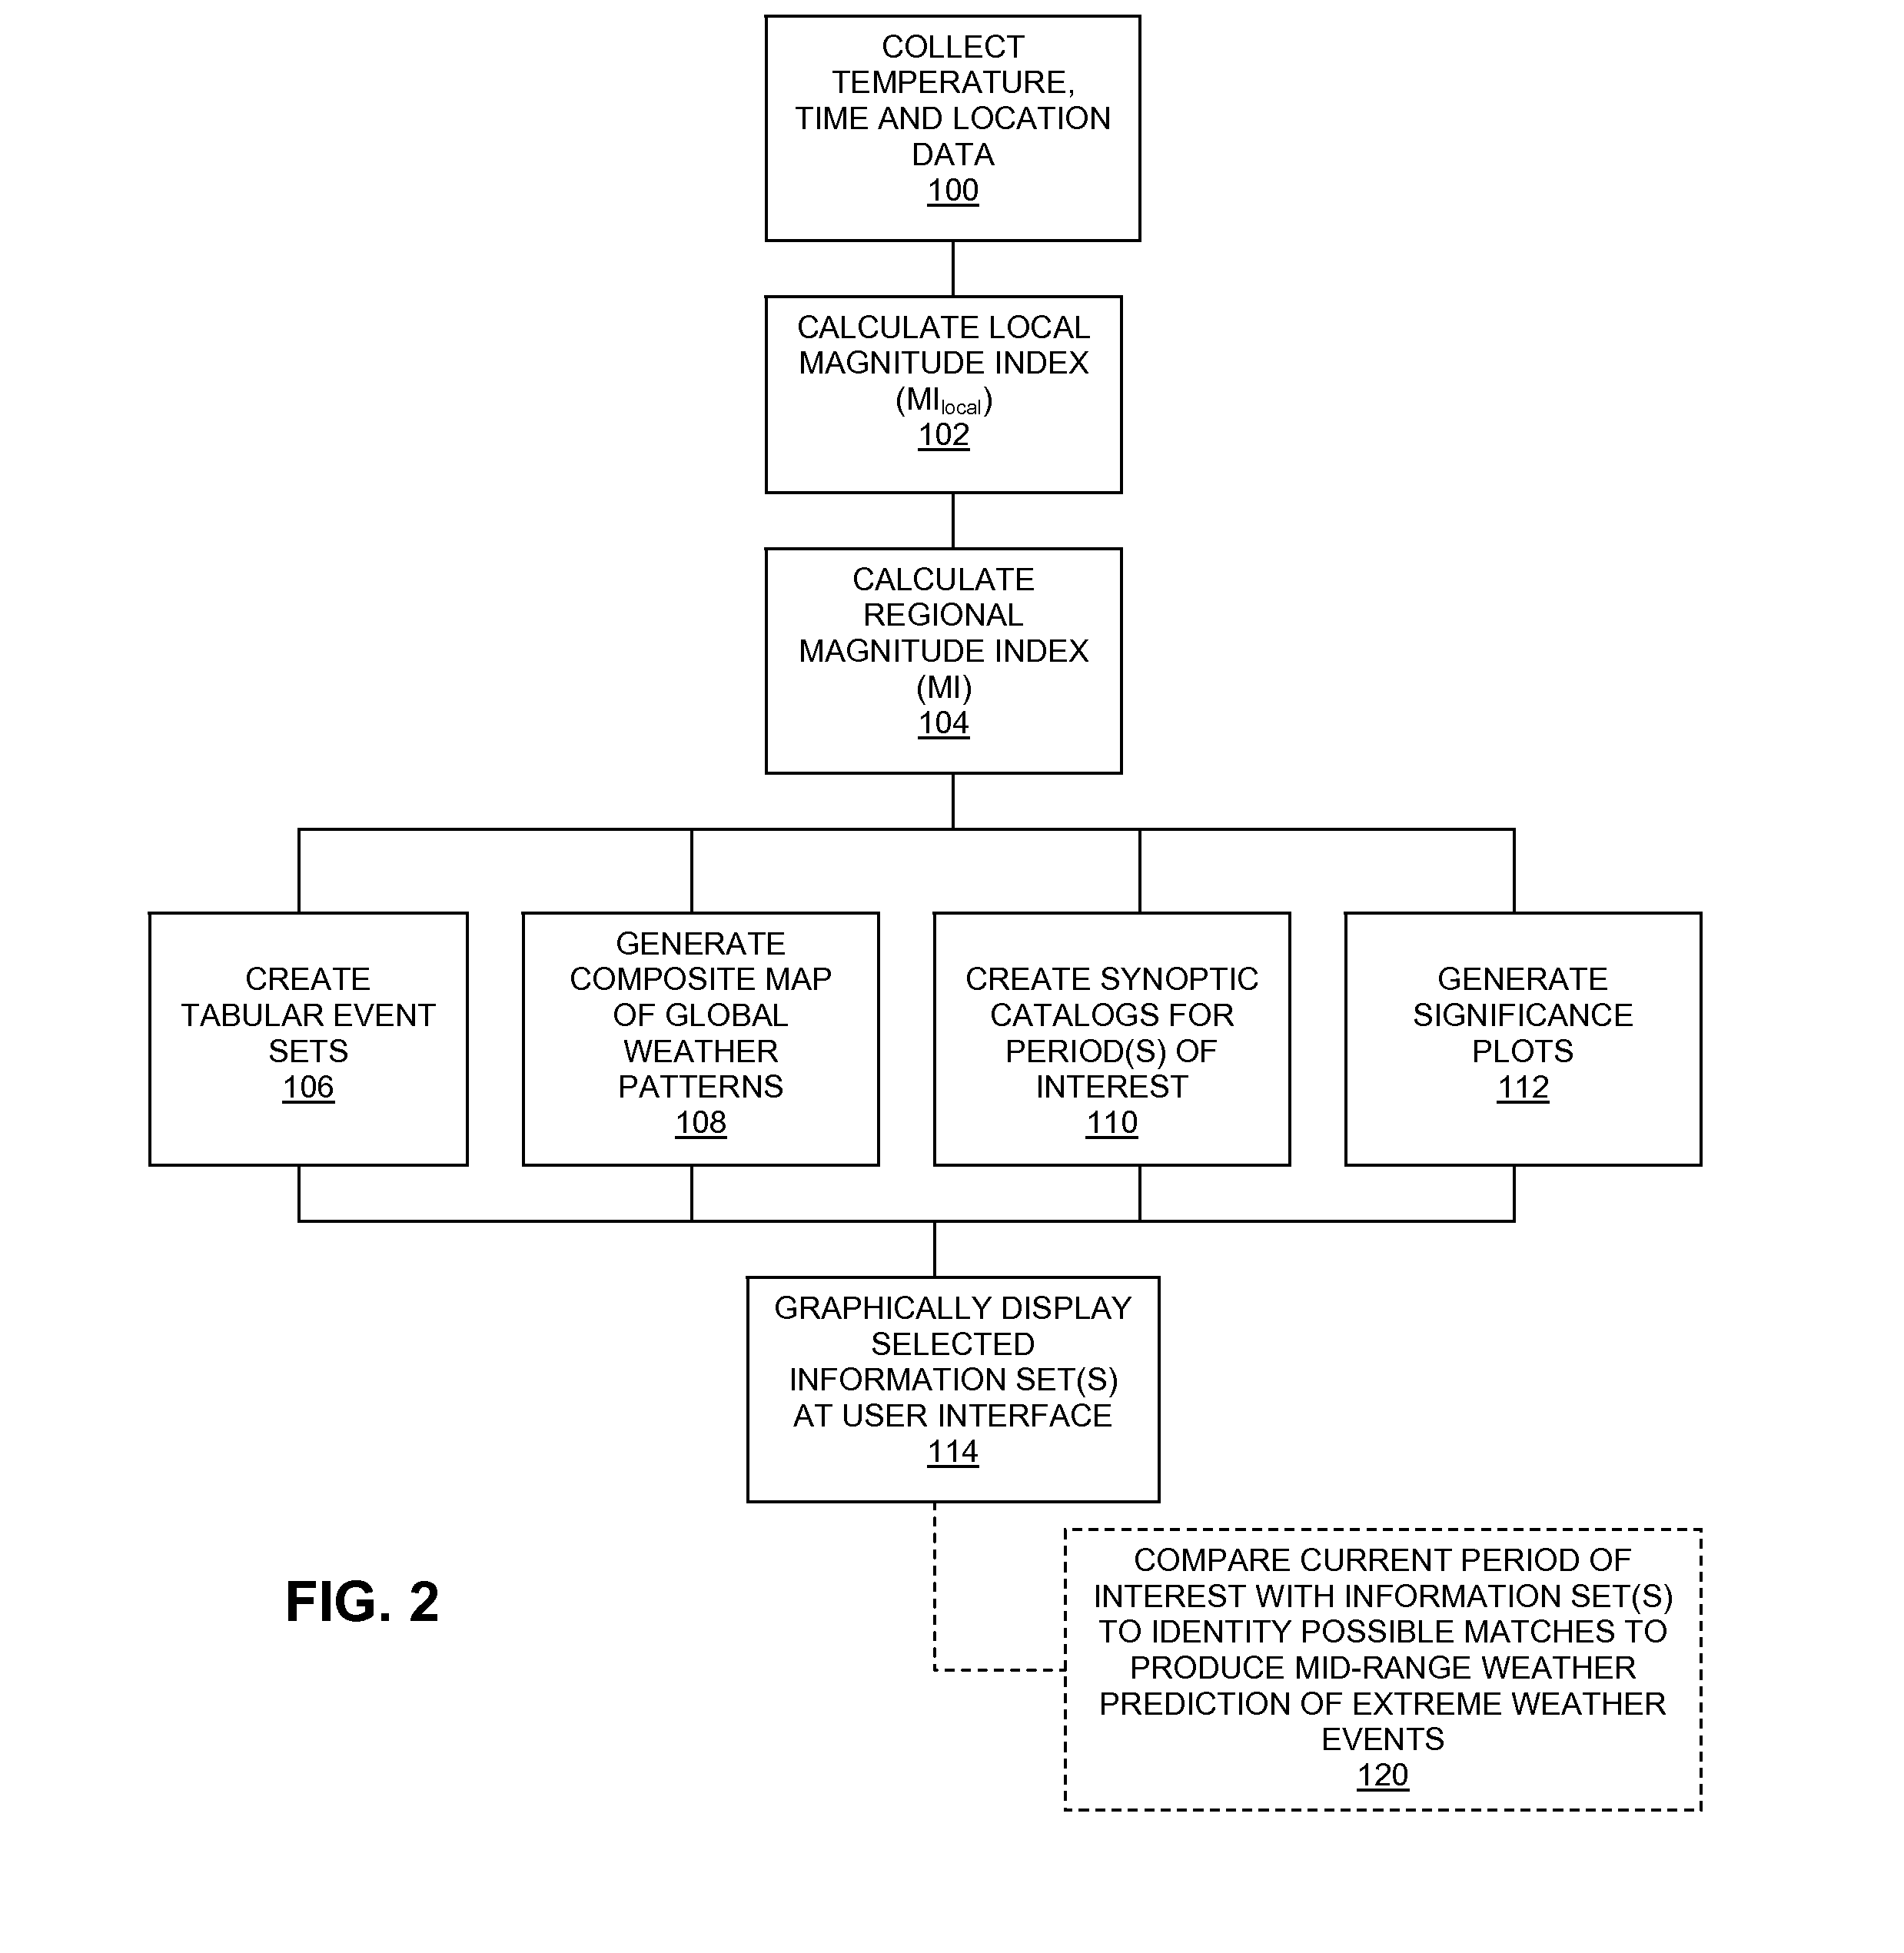
[0090]In an exemplary study, wintertime cold snaps over a large region of the Northeastern and Midwestern United States were considered according to how local cold temperature thresholds (5th percentiles of local wintertime temperature recorded at each of almost 500 stations) are exceeded on daily timescales. A regional magnitude index reflecting the temperature intensity, duration and spatial extent of extreme cold spells is computed for 61 winters from 1948-49 to 2008-09 and for each day of each event. Observed variability of regional cold spells was then examined on timescales ranging from daily to interdecadal and evaluated with respect to the climatic controls on their synoptic causes. Relationships with known climate modes (ENSO, NAO, PDO, PSV, etc.) as well as other relevant objectively derived circulation and land-surface patterns may then be used to develop sophisticated models and simple rule-of-thumb techniques for seasonal and improved medium-range proba...

example 2

Extreme Cold Winter of 2009-10

[0098]The winter of 2009-2010 made headlines for its fierce snowstorms and brutally cold temperatures. According to the UK Meteorological Office, England and Wales suffered their coldest winter since 1978-79, and Scotland saw temperatures not seen since the 1960's. Miami Beach, Fla., recorded its coldest January-February since records began in 1937, and Baltimore, Md., Washington, D.C., Wilmington, Del., and Philadelphia, Pa., all set seasonal snowfall records. An examination of Northern Hemisphere cold and warm temperature extremes using the inventive method reveals that while the cold events and their disruptive impacts received the bulk of the attention, warm extremes actually dominated much of the Northern Hemisphere when viewed in a historical context.

[0099]To identify extreme temperature events, local and regional extreme cold and warm temperature indices were calculated using 995 mb temperature data from NCEP Reanalysis. A local “Severe Cold Inde...


PUM


Abstract

A method and system are provided for medium-range probabilistic prediction of extreme temperature events. Extreme temperatures are measured according to how local temperature thresholds are exceeded on daily timescales to generate a local “Magnitude Index” (MI). A regional MI reflecting the historic temperature intensity, duration and spatial extent of extreme temperature events over all locations within the region is then computed. The regional MI is used to create a synoptic catalog for each of one or more pre-defined weather variables by testing the significance of leading modes in historic atmospheric variability across specified periods of time. Current or recent weather conditions are compared against the synoptic catalog to generate probabilistic predictions of extreme temperature events based the presence of synoptic precursors identified in historic patterns.

Description

RELATED APPLICATIONS[0001]This application claims the priority of U.S. provisional application No. 61 / 296,016, filed Jan. 18, 2010, the disclosure of which is incorporated herein by reference.FIELD OF THE INVENTION[0002]The invention relates to a method and system for use in identifying patterns in, and predicting, weather extremes and more particularly for a method and system for improved extended-range forecasts.BACKGROUND OF THE INVENTION[0003]In the peak of summer, it is not uncommon for individuals to be unable to find a store with air conditioners or fans left in stock. In the dead of winter, when many people can be snowed in for days or weeks, they want to make sure they have enough basic supplies on hand and enough heating fuel to make it through to the thaw.[0004]Extreme weather can cause extreme discomfort for individuals and extreme uncertainty when it comes to finances. From the superstore wishing it had planned to stock more winter coats to the homeowner concerned about...

Claims


Application Information

Patent Timeline
Patent Type & Authority Applications(United States)
IPC IPC(8): G01W1/00G06F19/00
CPCG01W1/10G01K2201/00
Inventor GERSHUNOV, ALEXANDERGUIRGUIS, KRISTEN
Owner RGT UNIV OF CALIFORNIA
Why Eureka
Try Eureka