
Automatically Configuring a Measurement System Using Measurement Results Data Capture Images Annotated with Instrumentation Configuration

a technology of automatic configuration and measurement system, applied in the field of measurement, can solve the problems of inability to automatically provide the engineer with configuration information, inability to include all instrument settings, configuration information, etc., and achieve the effect of facilitating replication or repeating

Inactive Publication Date: 2013-10-03
NATIONAL INSTRUMENTS
View PDF16 Cites 2 Cited by
  • Summary
  • Abstract
  • Description
  • Claims
  • Application Information

AI Technical Summary

Benefits of technology

The patent text describes a method for creating a file that can be used to document and repeat measurements made using different instruments and configurations. This file includes additional data that is stored or encrypted within the image file, allowing for a seamless experience for users and frees up space on the image. The file can also display the raw measurement data on a GUI associated with the instrument, and users can interact with this data to modify or filter it as needed. Overall, this method facilitates the replication or repeated use of previous measurements based on annotations of measurement results.

Problems solved by technology

1. The configuration data of the instrument that acquires the measurement results data is never complete / exhaustive. For example, oscilloscopes typically have tens of possible settings, which would overwhelm a standard screenshot image if they were exhaustively listed, i.e., all of the relevant configuration information would simply not fit on the image display. This makes it impractical to include all instrument settings on the image itself, and has presumably forced instrument vendors to include only what are deemed as “essential” settings. As a result, some configuration information which may be important for interpreting an image (for instance, AC vs. DC coupling on an oscilloscope) may not be automatically available to the engineer attempting to interpret or reproduce the measurement results data at a later time.
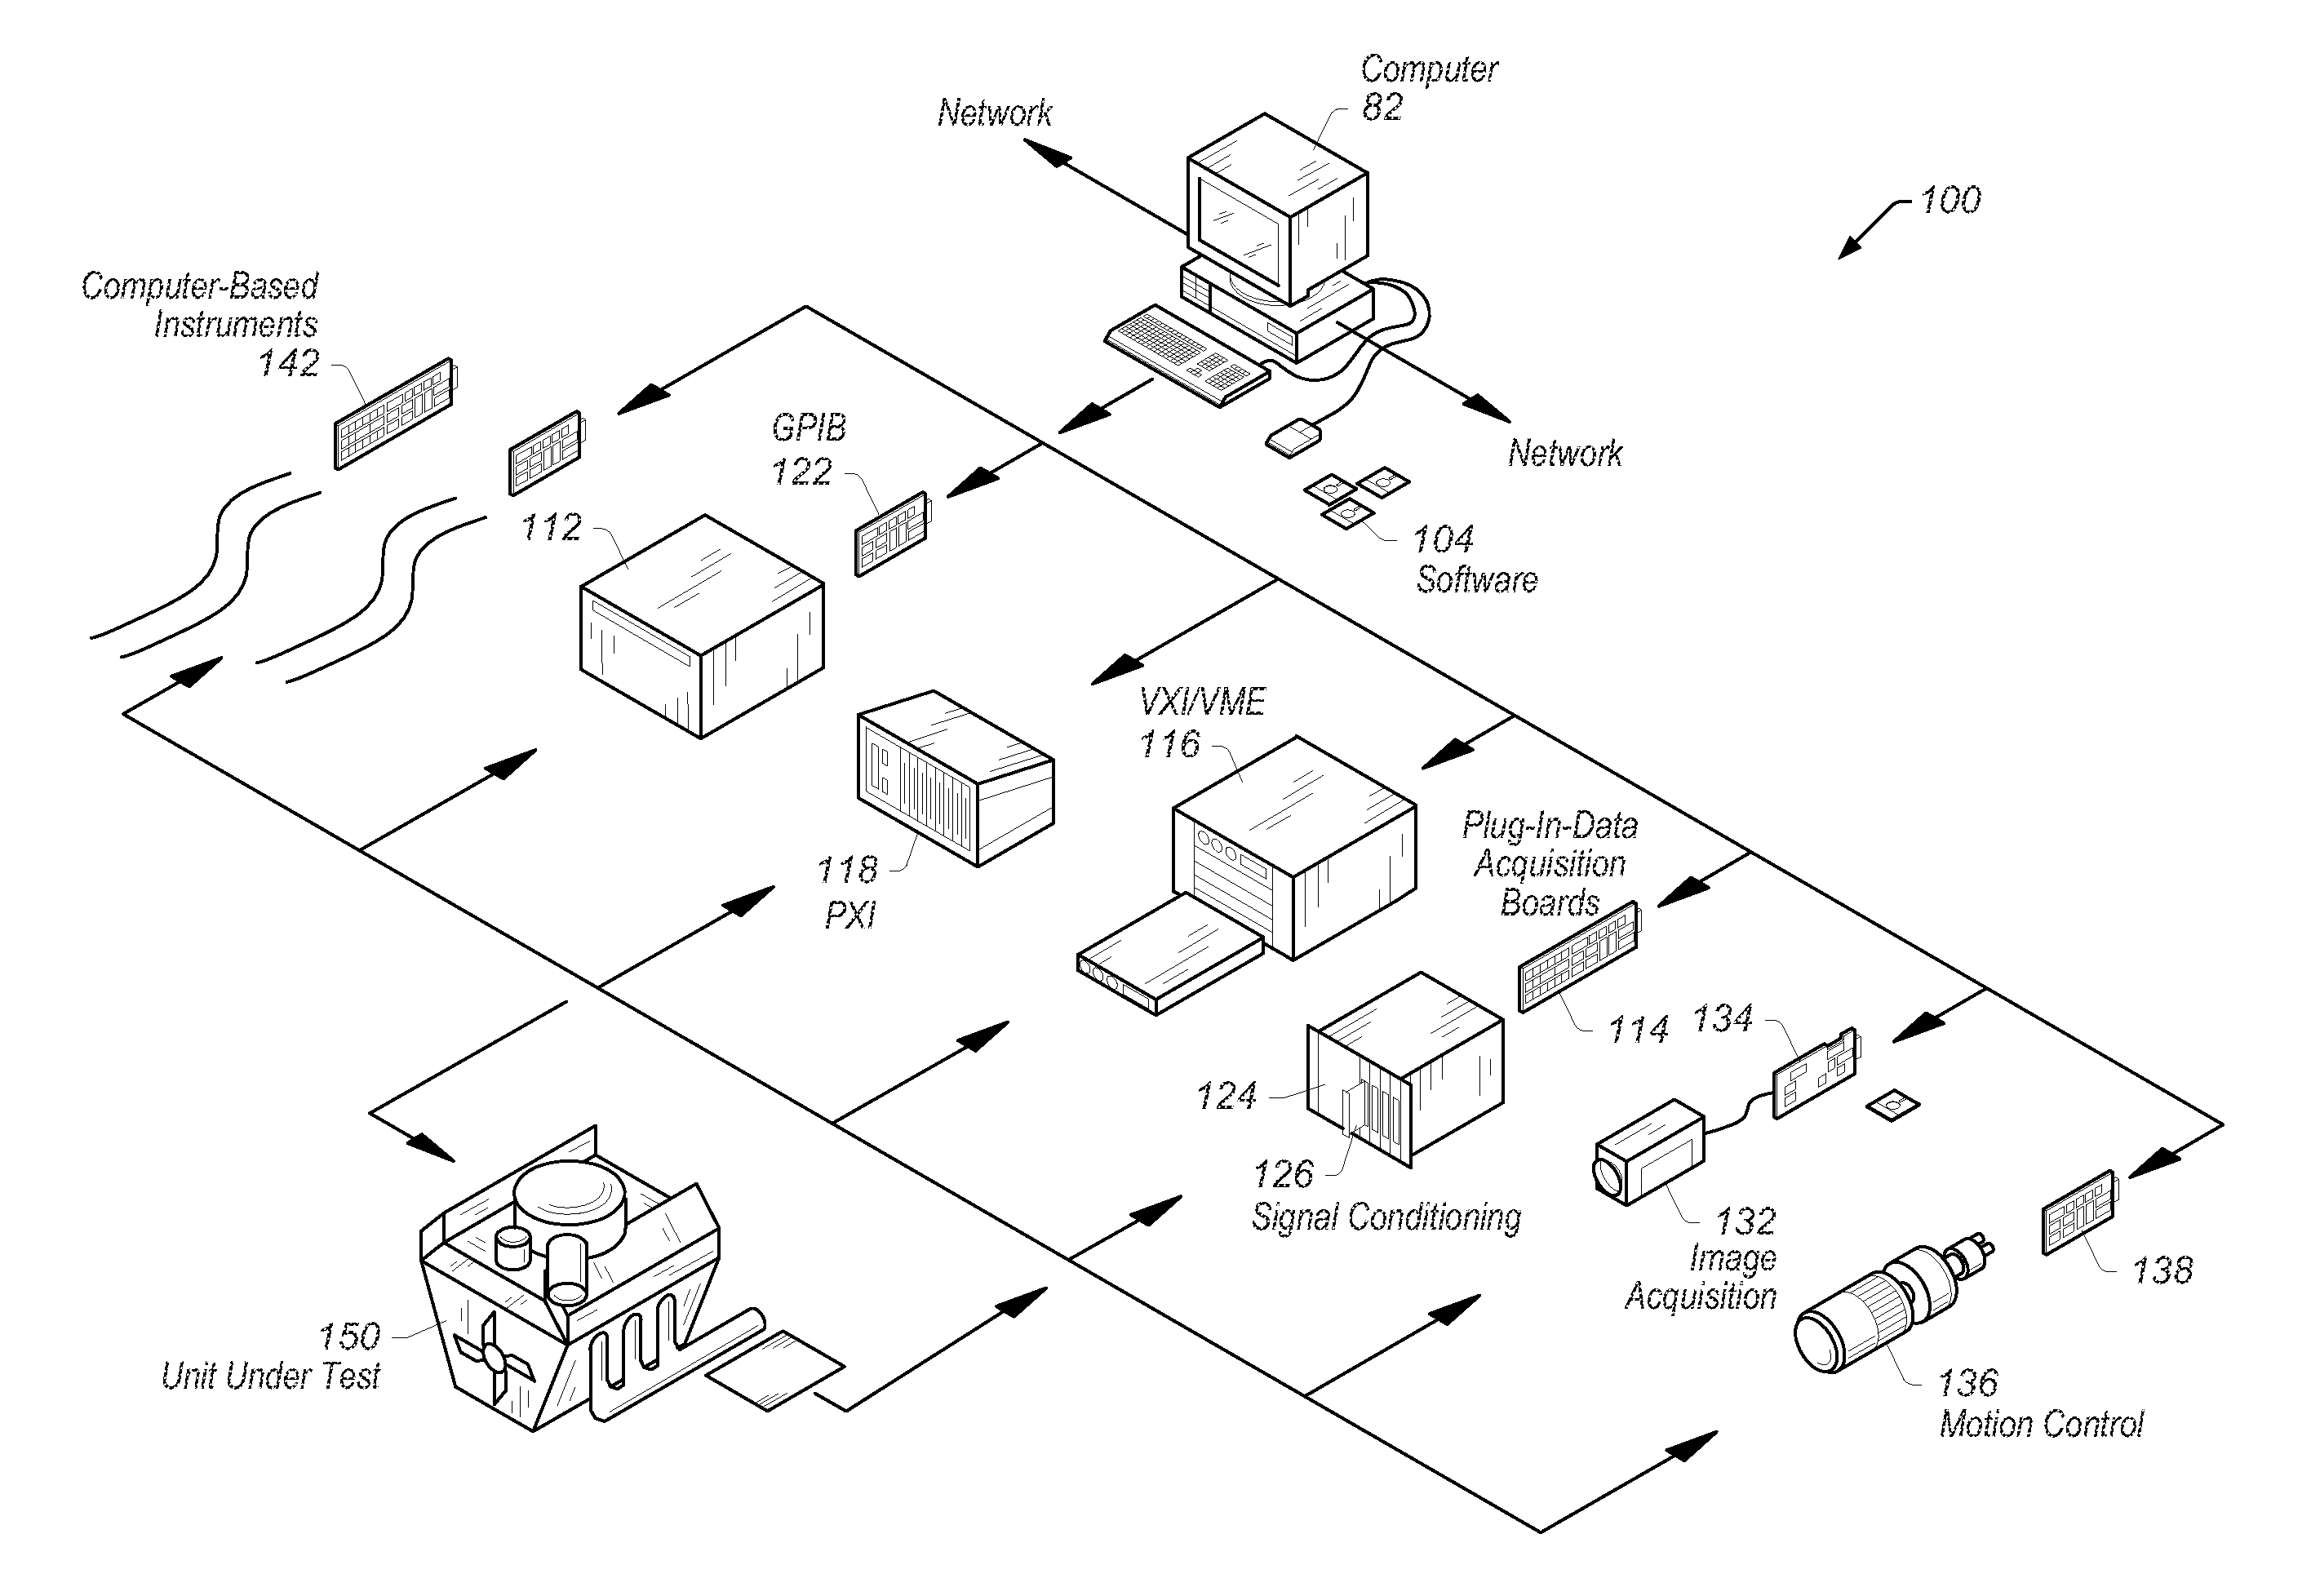
2. Even if the configuration information of the instrument were exhaustive (see 1 above), the instrument capturing the measurement results data (e.g., oscilloscope) is generally just one of several instruments that influence the measurement results data, e.g., waveform, produced by or related to the engineer's device under test (DUT). For instance, a power supply connected to the DUT could be either ‘on’ or ‘off’ resulting in radically different DUT waveforms. This is additional configuration information that is not automatically available to an engineer subsequently attempting to interpret or reproduce the data.
3. As a result of 1 and 2 above, interpreting and reproducing the original measurement results data (often months later, and with a modified DUT with unknown performance) using the exact same instrument settings currently involves manual documentation by the engineers, which is very difficult and tedious for engineers, and is generally prone to errors. In other words, complete certainty or reliability of measurement reproduction / replication requires manual documentation and subsequent re-configuration of both the measurement results data, e.g., waveform, capture instrument (e.g., oscilloscope) and all other instruments in the system used to make the measurements.

Method used


Image

  • Automatically Configuring a Measurement System Using Measurement Results Data Capture Images Annotated with Instrumentation Configuration
  • Automatically Configuring a Measurement System Using Measurement Results Data Capture Images Annotated with Instrumentation Configuration
  • Automatically Configuring a Measurement System Using Measurement Results Data Capture Images Annotated with Instrumentation Configuration

Examples


Embodiment Construction

Incorporation by Reference

[0046]The following references are hereby incorporated by reference in their entirety as though fully and completely set forth herein:

[0047]U.S. Pat. No. 4,914,568 titled “Graphical System for Modeling a Process and Associated Method,” issued on Apr. 3, 1990.

[0048]U.S. Pat. No. 5,481,741 titled “Method and Apparatus for Providing Attribute Nodes in a Graphical Data Flow Environment”.

[0049]U.S. Pat. No. 6,173,438 titled “Embedded Graphical Programming System” filed Aug. 18, 1997.

[0050]U.S. Pat. No. 6,219,628 titled “System and Method for Configuring an Instrument to Perform Measurement Functions Utilizing Conversion of Graphical Programs into Hardware Implementations,” filed Aug. 18, 1997.

[0051]U.S. Pat. No. 7,210,117 titled “System and Method for Programmatically Generating a Graphical Program in Response to Program Information,” filed Dec. 20, 2000.

Terms

[0052]The following is a glossary of terms used in the present application:

[0053]Memory Medium—Any of va...


PUM


Abstract

System and method for generating and using annotated measurement results data capture images. Measurement results from a first measurement system are received in response to a measurement by the first measurement system with one or more instruments. Measurement results data are displayed based on the received measurement results, and a file is stored. The file includes image data sufficient for display of the measurement results data by an image viewer, and measurement configuration data sufficient for configuring a second measurement system to repeat the measurement, where the second measurement system includes the first measurement system or another instance of the first measurement system. Subsequently, the file is received or retrieved, and one or more instruments of the second measurement system are automatically configured using the measurement configuration data to repeat the measurement.

Description

FIELD OF THE INVENTION[0001]The present invention relates to the field of measurement, and more particularly to a system and method for generating and using annotated measurement results capture images.DESCRIPTION OF THE RELATED ART[0002]Documenting measurement results via images of measurement data, i.e., measurement results data, e.g., waveform / measurement data screenshots, is a common practice among engineers. Many instruments, e.g., digital oscilloscopes, help with this documentation process by providing a few items of high-level instrument configuration data (e.g., voltage range, time range) directly on those images, e.g., screenshots, when they are saved to storage, e.g., on a computer, so that the waveforms can be interpreted at a later time. Different instrument vendors offer slightly different amounts of high-level configuration information and present them at slightly different locations on the image, but the implementation of the concept itself is similar across the indus...

Claims


Application Information

Patent Timeline
Patent Type & Authority Applications(United States)
IPC IPC(8): G06F19/00
CPCG01D9/00
Inventor WHITE, TRAVIS W. L.BRYSON, KYLE R.FICKLIN, CHRISTOPHER S.
Owner NATIONAL INSTRUMENTS
Learn More