Methods and devices for measuring the concentration of an additive

a technology of additive concentration and monitoring device, which is applied in the direction of analysis using chemical indicators, other chemical processes, separation processes, etc., can solve the problems of increasing or reducing demand, determining the concentration of a low amount of ferrate in a treatment stream, and many analytical methods that exist today cannot accurately measure the strength of ferrate, etc., to achieve the effect of increasing or reducing the demand for ferra

Inactive Publication Date: 2013-10-31
FERRATE TREATMENT TECH
View PDF0 Cites 6 Cited by
  • Summary
  • Abstract
  • Description
  • Claims
  • Application Information

AI Technical Summary

Benefits of technology

[0008]The quality of a stream of water being treated by ferrate can vary over time. This change can increase or decrease the demand for ferrate, and thus, the quantity of ferrate needed for treatment of

Problems solved by technology

This change can increase or decrease the demand for ferrate, and thus, the quantity of ferrate needed for treatment of the stream.
Historically, determining the concentration of a low amount of ferrate in a treatment stream has been difficult.
Many analytical methods that exist today cannot accurately measure ferrate strength.
In some cases, ferrate strength can appear to be stronger or weaker than it truly is due to measurement method incompatibilities.
However, because ferrate is such a powerful treatment chemical and is costly to manufacture and use, very low doses are desirable for efficient cost-effective water treatment.
In such instances, absorbance levels of ferrate using typical monitoring methods are very low.
Measuring absorbance at the lowe

Method used


Image

  • Methods and devices for measuring the concentration of an additive
  • Methods and devices for measuring the concentration of an additive

Examples


example 1

[0115]The following is one embodiment of a laboratory procedure for indirectly measuring ferrate concentration in a treatment stream. A dosing stream was made and the volumetric flow rate ratio of the treatment stream to the dosing stream was 25:1. Doses of ferrate in the amounts of approximately 250, 125, 62.5, 30, and 12.5 ppm were administered to the dosing stream. When rejoined to the full treatment stream, the concentration of the ferrate would be calculated to be 10, 5, 2.5, 1.2, and 0.5 ppm, respectively. Ferrate was synthesized and then diluted in a high pH buffer (to preserve ferrate strength) of a known volume. The diluted ferrate solution was then poured into a capped monitor flow cell. The monitor was then calibrated to the known concentration (ppm) of the diluted solution and verified with an analytical control. The flow cell was rinsed out with a buffer solution. Then, various doses of dilute ferrate were introduced into the monitor flow cell and then verified again wi...

example 2

[0116]A treatment stream and a dosing stream were designed having a volumetric flow rate of about 25:1. Doses of ferrate were added to the dosing stream in amounts of approximately 12.5, 25, 37.5, and 50 ppm. In the full treatment stream, this would result in calculated doses of 0.5, 1, 1.5,2 ppm. The experiment was conducted in a similar manner as the first example. Each dose of ferrate was diluted in buffer and introduced into the monitor flow cell and then verified with the analytical control. This was done three times for each dilution. The results are shown in Table 2 and FIG. 3.

TABLE 2DosingTreatmentTreatmentDosingstreamstreamstreamstreamexperimentaltheoreticalexperimentaltheoretical(PPM, average of 3calculationcalculation(PPM)measurements)(PPM)(PPM)12.5150.50.62526.711.137.534.71.51.4504621.8


PUM

PropertyMeasurementUnit
Concentrationaaaaaaaaaa
Ratioaaaaaaaaaa

Abstract

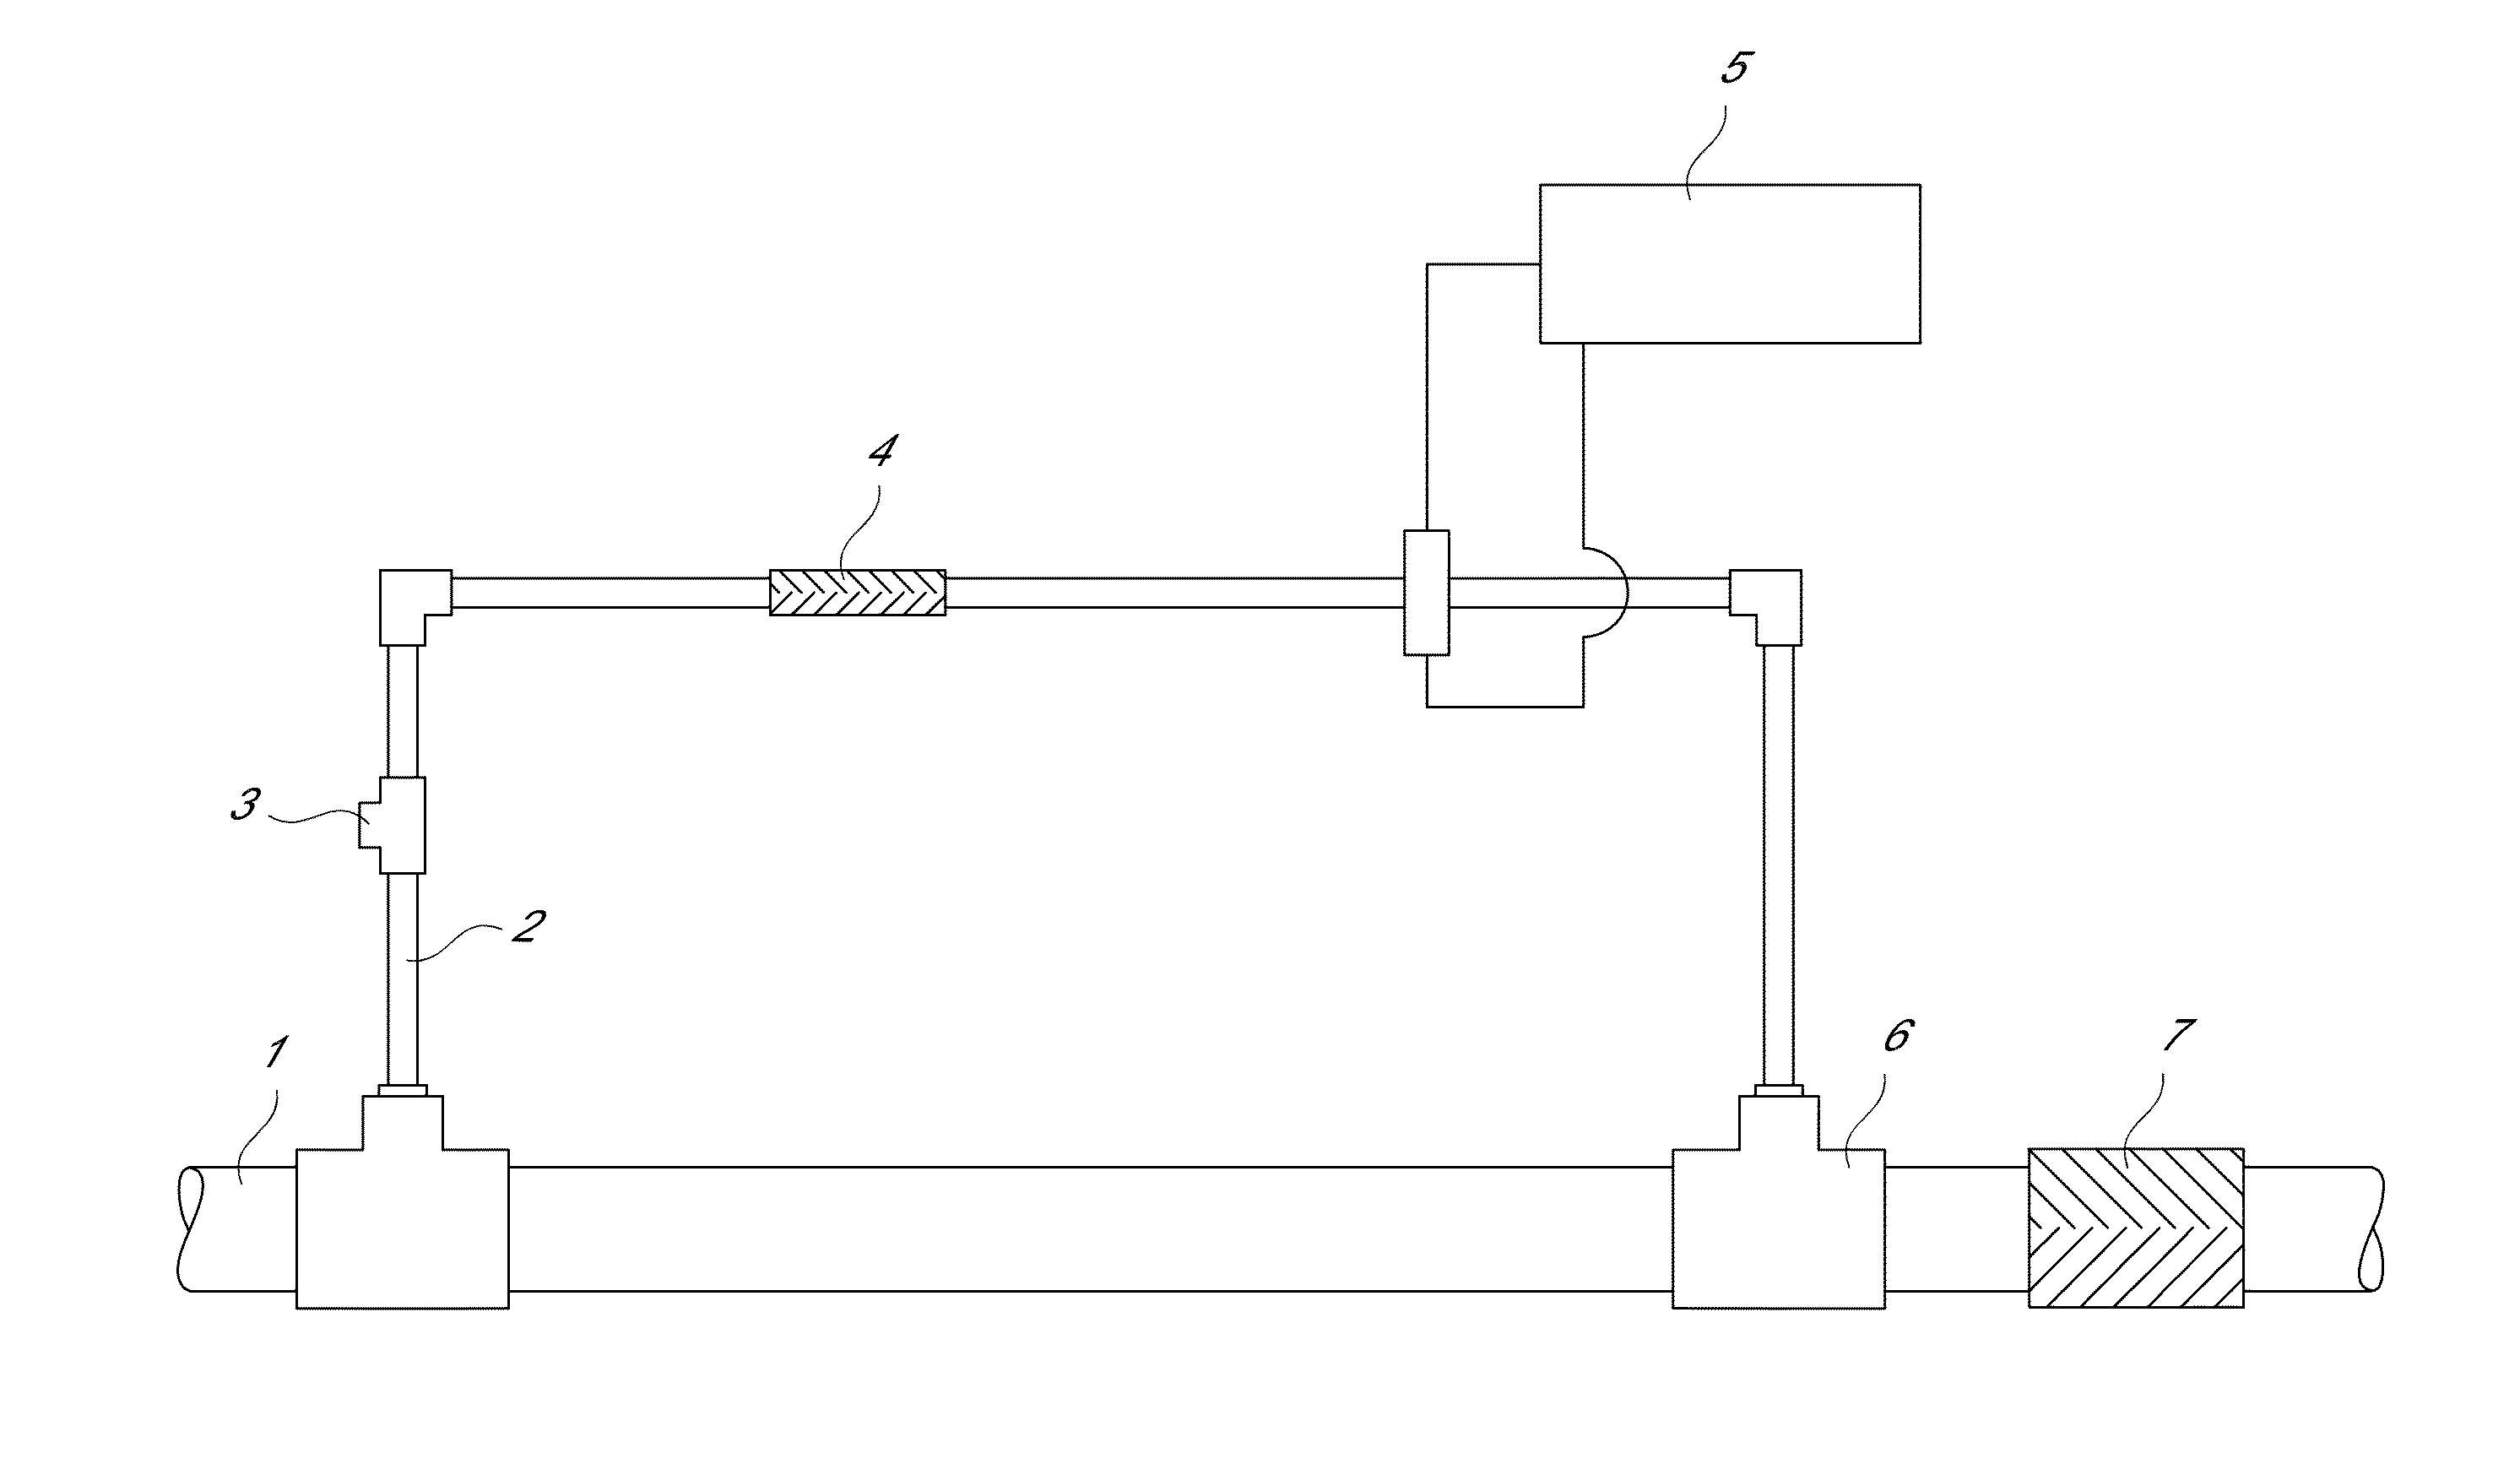
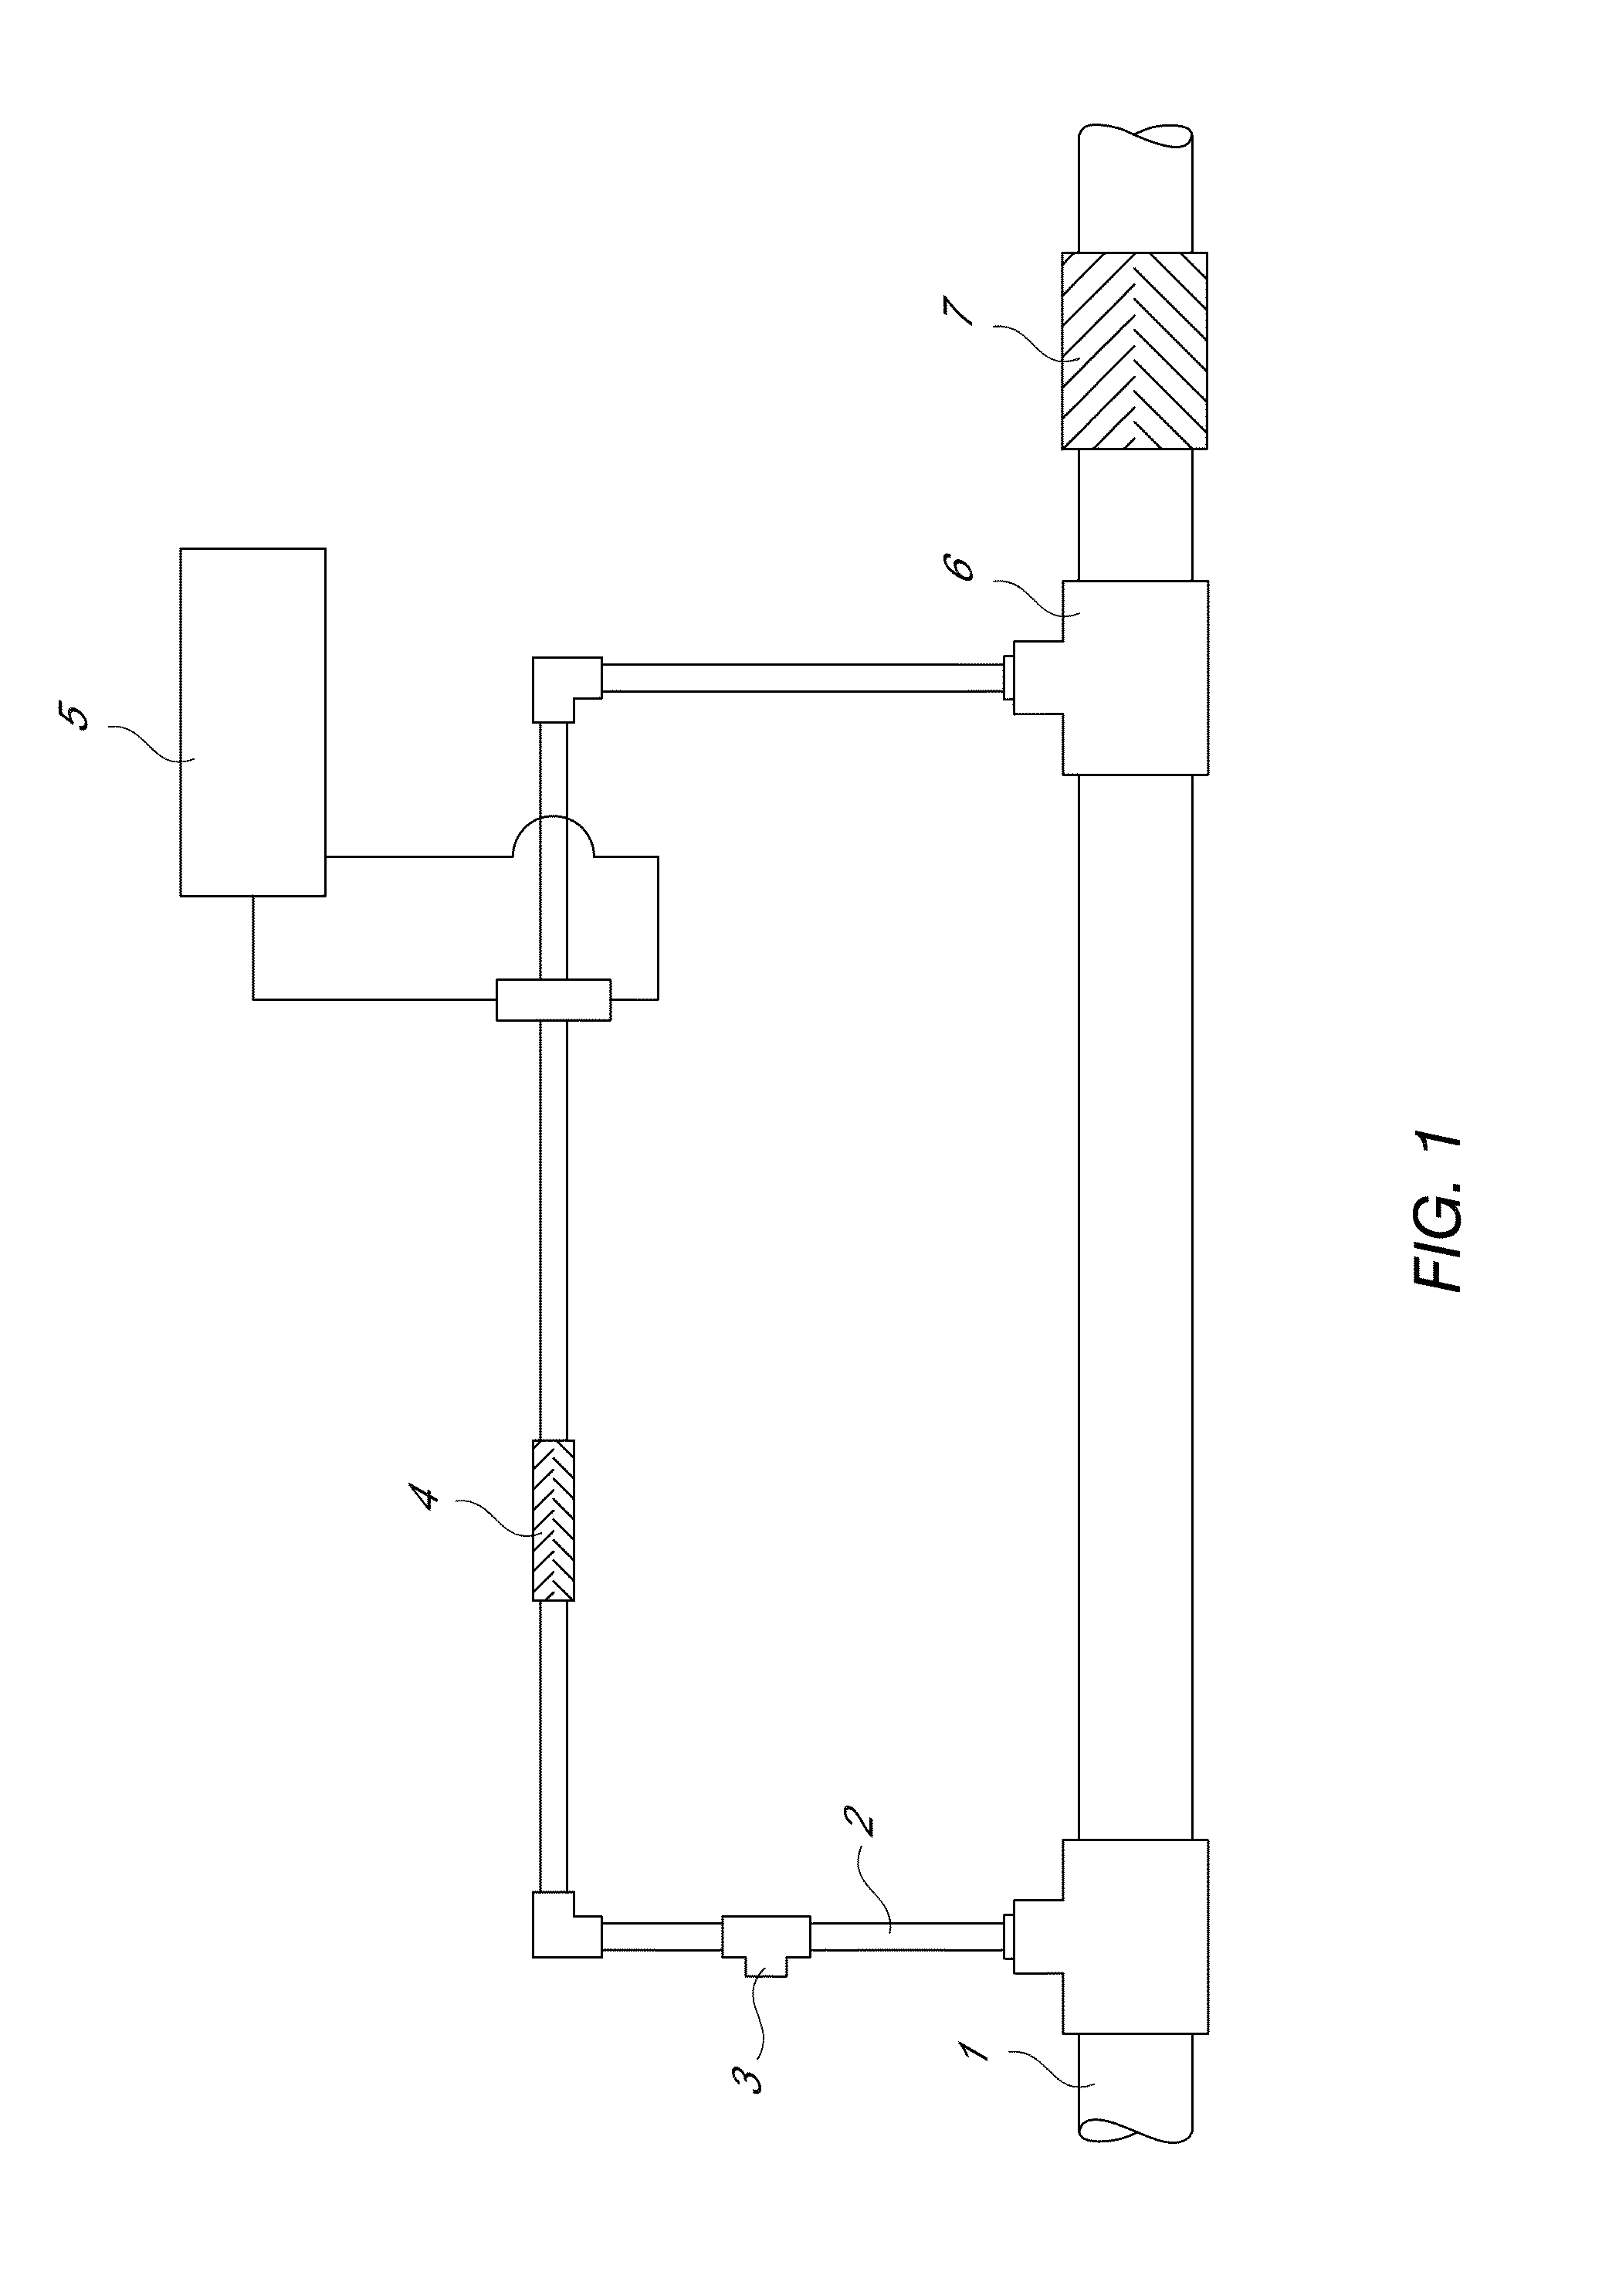
An apparatus and methods for measuring the concentration of an additive are disclosed. The apparatus comprises a treatment stream (1) and a dosing stream (2). An additive is added to the dosing stream using a metering device (3). In some embodiments, the dosing stream is mixed after adding the additive using a first mixing device (4). Downstream from the metering device and the mixing device, the concentration of the additive in the dosing stream is measured using a monitor flow cell (5). In some embodiments, the dosing stream and treatment stream are combined (6) and mixed using a second mixing device (7). The concentration of the additive in the treatment stream can be calculated as a function of the volumetric flow rate ratio of the dosing stream to the treatment stream and the measured concentration of the additive in the dosing stream.

Description

BACKGROUND OF THE INVENTION[0001]1. Field of the Invention[0002]The present invention generally relates to methods and devices for monitoring a low concentration additive in a flowing treatment stream. In an embodiment, the present invention relates to methods and devices for monitoring the concentration of ferrate in a flowing treatment stream.[0003]2. Description of the Related Art[0004]Ferrate is a strong oxidant that can react with a variety of inorganic or organic reducing agents and substrates (R. L. Bartzatt, J. Carr, Trans. Met. Chem., Vol. 11 (11), pp. 414-416 (1986); T. J. Audette, J. Quail, and P. Smith, J. Tetr. Lett., Vol. 2, pp. 279-282 (1971); D. Darling, V. Kumari, and J. BeMiller, J. Tetr. Lett., Vol. 40, p. 4143 (1972); and R. K. Murmann and H. J. Goff, J. Am. Chem. Soc., Vol. 93, p. 6058-6065 (1971)). Ferrate can act as a selective oxidant for synthetic organic studies and is capable of oxidizing / removing a variety of organic and inorganic compounds from, and of d...

Claims


Application Information

Patent Timeline
IPC IPC(8): C02F1/72
CPCC02F1/72C02F1/008C02F1/686C02F2209/005G01N31/22
Inventor DALY, LUKE J.ALIG, CRAIG S.
Owner FERRATE TREATMENT TECH
Why Eureka
Try Eureka