Power grid visualization system and method based on three-dimensional gis technology

a technology of geographic information and visualization system, applied in the field of three-dimensional geographic information system, can solve the problems of inability to really reflect the topography around power facilities such as circuits and pole towers, the defects the gradual exposure of two-dimensional gis technology on information representation, etc., and achieve the effect of low loading speed

Inactive Publication Date: 2013-12-05
STATE GRID SHANDONG ELECTRIC POWER +1
View PDF5 Cites 49 Cited by
  • Summary
  • Abstract
  • Description
  • Claims
  • Application Information

AI Technical Summary

Benefits of technology

[0006]In order to solve the technical problem of relatively low loading speed due to real-time modeling and loading of each object by the visual state system based on the three-dimensional GIS technology in the prior art, the invention provides a power grid visualization system and a power grid visualization method based on a three-dimensional geographic information technology for realizing real-time visualization by fully using the characteristic of single types of power equipment.

Problems solved by technology

But in practical work, the defects of the two-dimensional GIS technology on information representation are gradually exposed.
For example, the two-dimensional GIS represents actual ground objects of different types by using characters of points, lines, planes and the like in different layers, and has the biggest defects that geometric figures are simple and the topography around power facilities such as circuits and pole towers cannot be really reflected.
Although the conventional primary wiring diagram or secondary wiring diagram can express the connection relation of the internal equipment of the transformer station, the wiring diagram is only a schematic diagram of topological connection and cannot reflect the spatial relative relation of the equipment.
When a power grid is required to be rebuilt or expanded, the two-dimensional GIS cannot reflect the spatial position relation between power equipment and the surrounding objects, and rebuilding or expanding constructors are required to carry out measurement on a power grid site to acquire the spatial position data, so time and labor are wasted, and smooth rebuilding or expanding work is not favored.

Method used


Image

  • Power grid visualization system and method based on three-dimensional gis technology
  • Power grid visualization system and method based on three-dimensional gis technology

Examples


Embodiment Construction

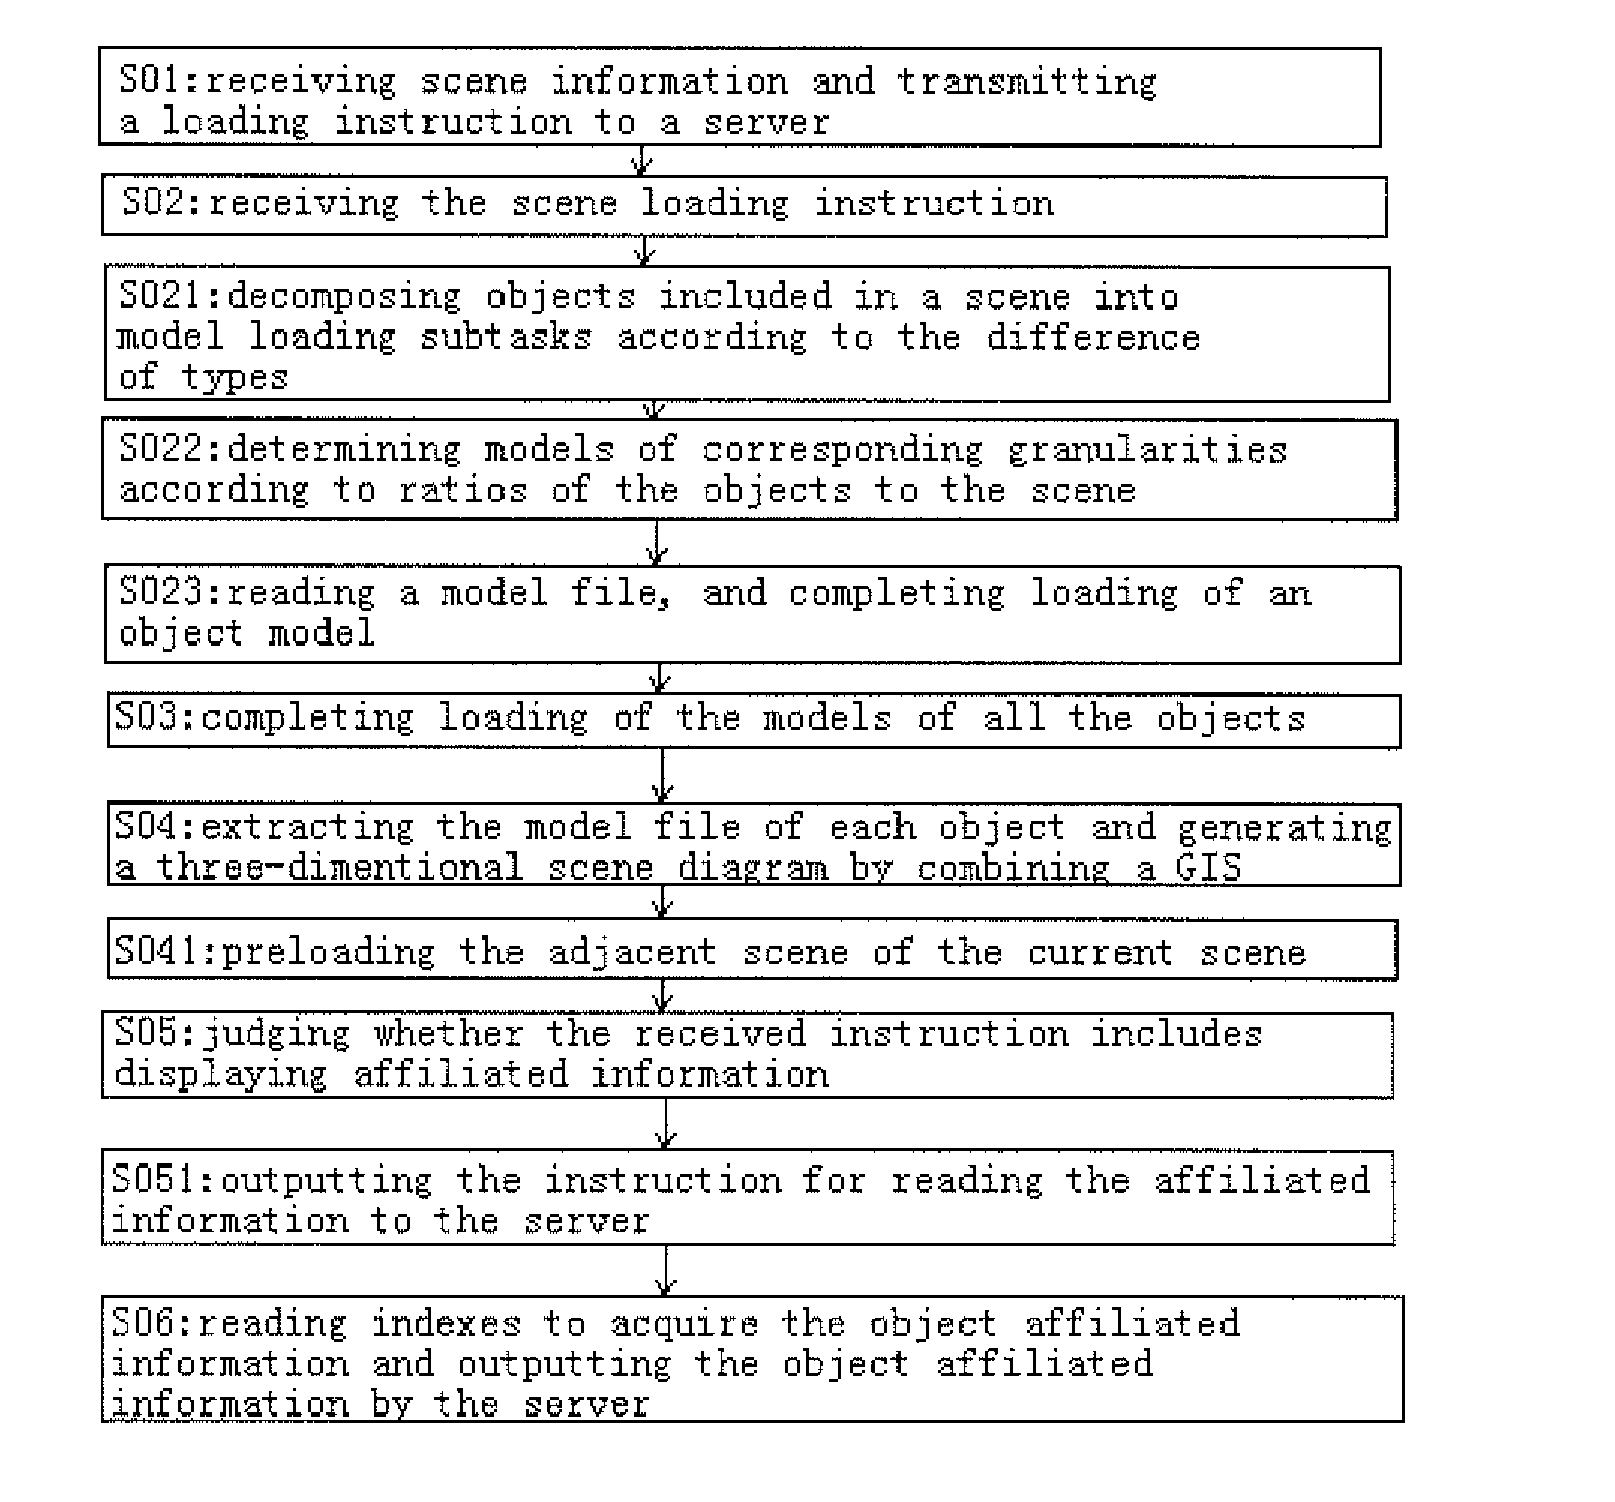
[0039]Please see the FIG. 1, a power grid visualization system based on a three-dimensional GIS technology in an embodiment of the invention, comprises:

[0040]a database, which further comprises a first database for storing three-dimensional geographic information, a second database for storing power grid equipment data and a three-dimensional model file addressing information table (not shown in the figure), wherein names of models and address information of three-dimensional model files of the models are stored in the three-dimensional model file addressing information table, various three-dimensional model files are directly stored in a hard disk of a server, and each three-dimensional model comprises three-dimensional models of an object of any type in a scene, such as three-dimensional models of buildings, streets, transformer stations, wire poles and the like; when reading the model files, the server should read the storage position of a required model file from the three-dimen...


PUM


Abstract

The invention relates to a power grid visualization system and a power grid visualization method based on a three-dimensional geographic information system (GIS) technology. Models to be loaded are divided into different model loading subtasks according to the difference of object types included in a scene to be loaded, and model files are called in parallel from a plurality of subtasks in a multi-thread mode; and meanwhile, on the basis that loading tasks are divided into a plurality of model loading subtasks according to the loaded object types, model files of objects of each type are only read once, moreover, reuse of the model files is not limited to a client loading task, different clients can reuse the read model files, and the characteristics of limited type and relatively consistent specification of power equipment are fully considered, so that rereading of the model files of the same type is avoided.

Description

FIELD OF THE INVENTION[0001]The invention relates to a three-dimensional geographic information system, and in particular to a power grid visualization system and a power grid visualization method based on a three-dimensional geographic information technology.BACKGROUND OF THE INVENTION[0002]GIS (Geographic Information System) is a technical system for scientifically managing and comprehensively analyzing geographic data with space meaning based on a geographic spatial database under the support of computer software and hardware by using the theories of system engineering and information science so as to provide information required by management, decision and the like. Briefly, the GIS is a technical system for comprehensively processing and analyzing geographic spatial data, and relates to a global spatial analysis real-time technology using mapping and surveying as basis, using a database as a data source for data storage and use and using computer programming as a platform.[0003...

Claims


Application Information

Patent Timeline
Patent Type & Authority Applications(United States)
IPC IPC(8): G06F3/0481
CPCG06F3/04815G05B15/02G05B17/02G06F30/00
Inventor SHI, XIANGZHAO, SHENG CHUANCHEN, ZHI YONGWANG, XING ZHAOHAN, KE CUNZHANG, LI QUNWANG, YOU JIELIU, CHENG MINGXU, QIANGLAN, XIAN MING
Owner STATE GRID SHANDONG ELECTRIC POWER
Why Eureka
Try Eureka