
Systems and methods for quantifying flood risk

a flood risk and quantitative technology, applied in the field of flood risk analysis, can solve the problems of more property damage, 1600 deaths, and properties located near flood sources with lower elevations, and achieve the effect of reducing the uncertainty in flood risk assessmen

Active Publication Date: 2014-08-14
CORELOGIC SOLUTIONS
View PDF1 Cites 21 Cited by
  • Summary
  • Abstract
  • Description
  • Claims
  • Application Information

AI Technical Summary

Benefits of technology

The patent text describes a method for using statistically determined points from geospatial flood risk zoning maps to create a curve that shows the frequency of floods in relation to the depth of the flood. This curve can be used to improve the accuracy of flood risk assessment for insurance companies and others. Essentially, the method involves analyzing the data from flood maps and using it to reduce uncertainty in estimating the risk of flood damage.

Problems solved by technology

Worldwide, floods may be the number one cause of losses from natural events.
Flood risk may be a function of flood hazards (e.g., hurricanes and / or damage to a levee or dam), property exposure to these hazards, and the damage vulnerability of properties during a flood.
In the United States, floods may account for significant property and business interruption losses affecting thousands of enterprises each year, which may cost more in property damages than other natural disasters.
In 2005, the flooding from Hurricane Katrina alone caused over $40 billion in property damage, led to over 1600 deaths, and affected over 250,000 businesses according to the United States Census Bureau.
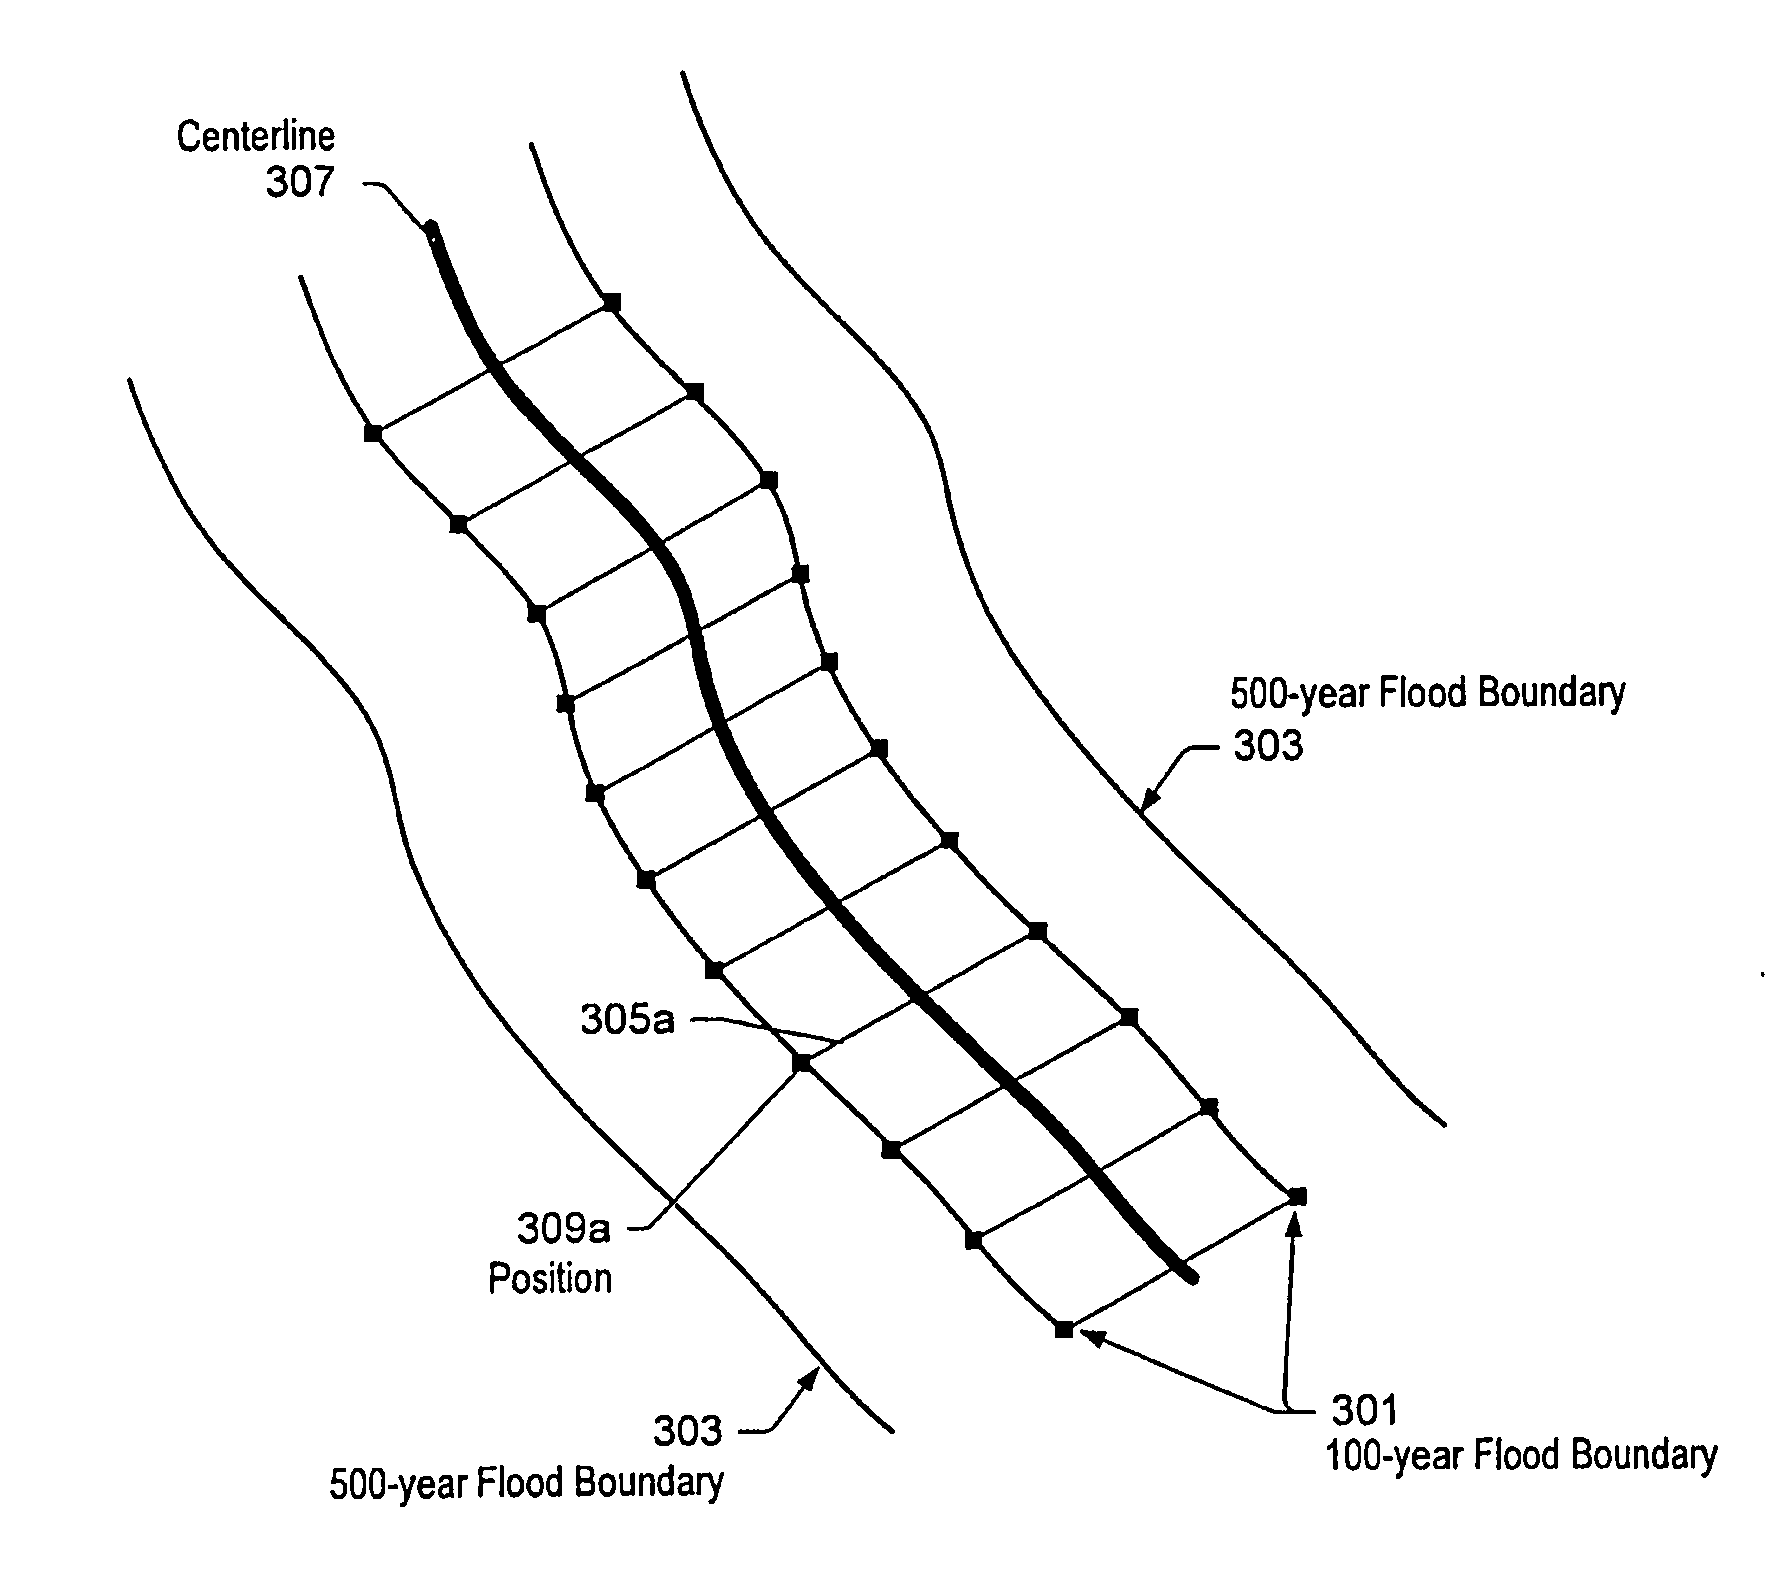
In an SFHA, properties located near flood sources with lower elevations may have a higher flood risk than properties near SFHAs boundaries at a higher elevation.
Beyond the 100 yr flood zone, properties may also suffer flood damage.
In the United States, floods may account for significant property and business interruption losses affecting thousands of enterprises each year, which may cost more in property damages than other natural disasters.
The difference in elevation between the GE of the property point and the elevation of the calculated point may indicate a risk that the property will experience flooding.

Method used


Image

  • Systems and methods for quantifying flood risk
  • Systems and methods for quantifying flood risk
  • Systems and methods for quantifying flood risk

Examples


Embodiment Construction

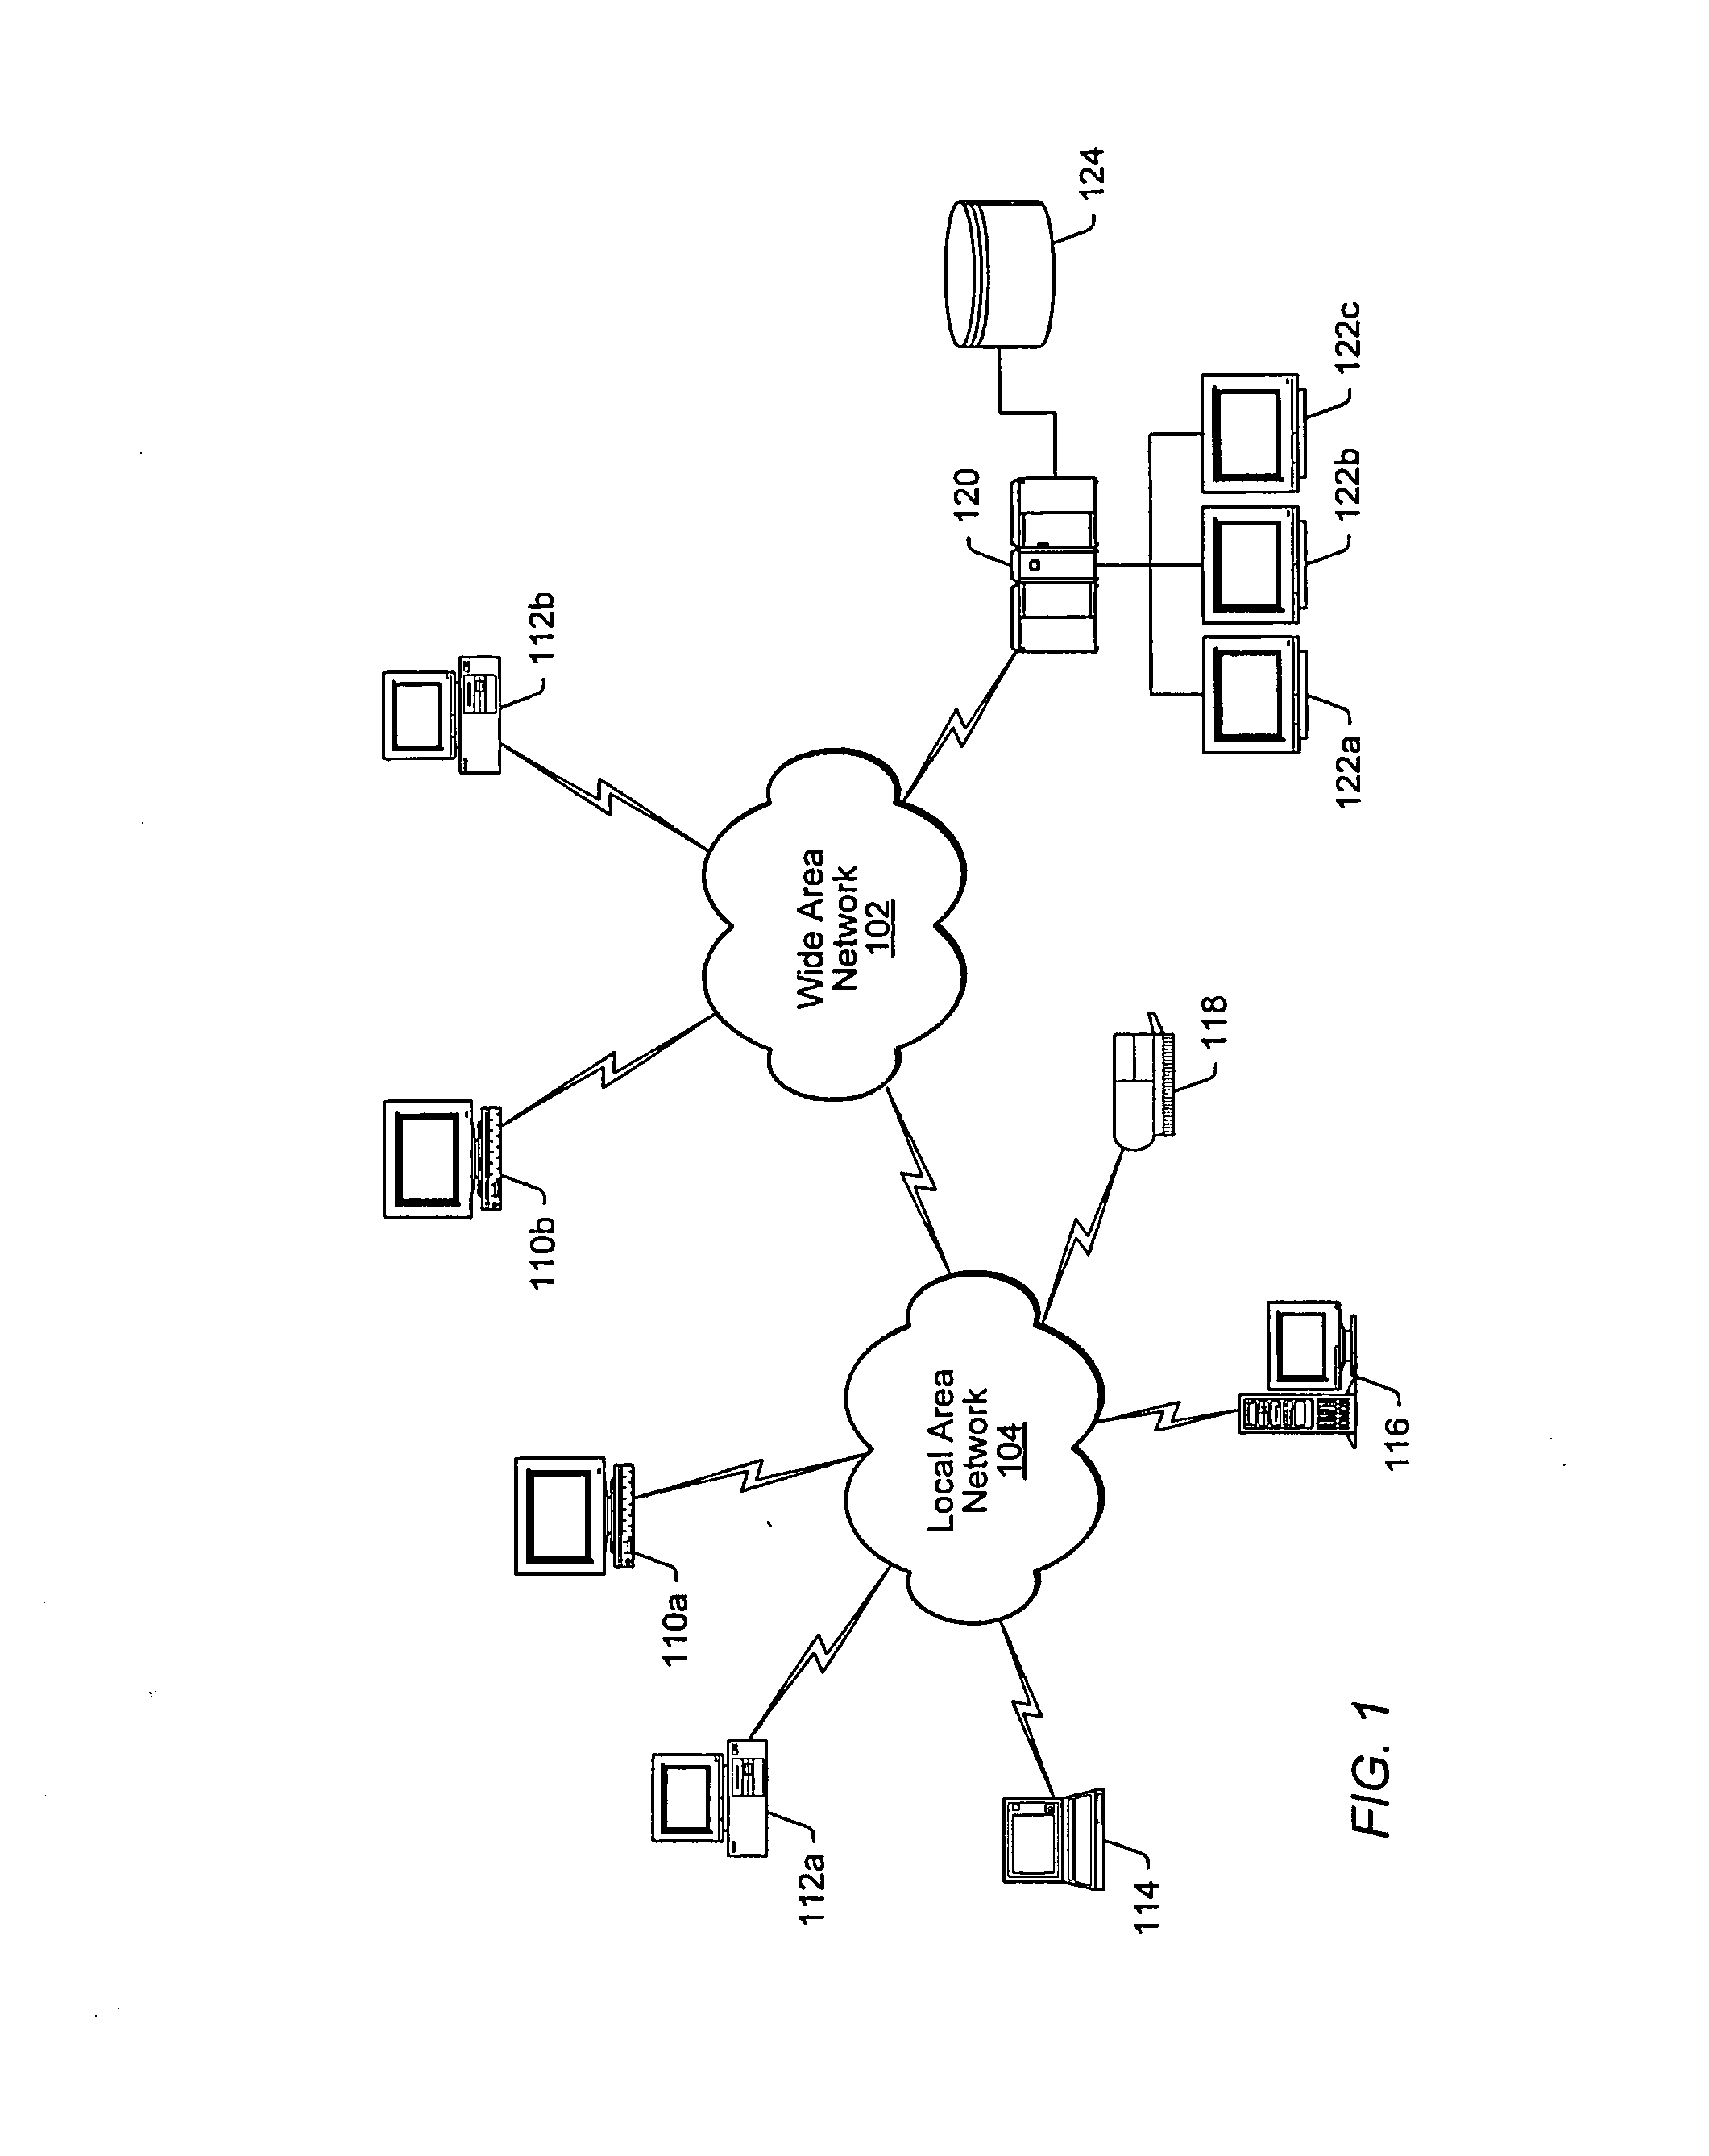
[0090]FIG. 1 illustrates an embodiment of a WAN 102 and a LAN 104. WAN 102 may be a network that spans a relatively large geographical area. The Internet is an example of a WAN 102. WAN 102 typically includes a plurality of computer systems that may be interconnected through one or more networks. Although one particular configuration is shown in FIG. 1, WAN 102 may include a variety of heterogeneous computer systems and networks that may be interconnected in a variety of ways and that may run a variety of software applications.

[0091]One or more LANs 104 may be coupled to WAN 102. LAN 104 may be a network that spans a relatively small area. Typically, LAN 104 may be confined to a single building or group of buildings. Each node (i.e., individual computer system or device) on LAN 104 may have its own Central Processing Unit (CPU) with which it may execute programs. Each node may also be able to access data and devices anywhere on LAN 104. LAN 104, thus, may allow many users to share d...


PUM


Abstract

In various embodiments, a flood risk score may be determined for a property point that provides a comprehensive assessment of the property point's risk of flooding. Determining the flood risk score may include determining a flood risk characteristic for the property point and assigning a flood risk score that corresponds to the flood risk characteristic. In some embodiments, flood risk characteristics may include a difference in elevation between the elevation of the property point and an elevation of a calculated point (e.g., on a known flood risk zone boundary). Flood risk characteristics may also include a flood zone determination for the property point and / or proximity of the property point to a known flood risk zone boundary or a flood source. In some embodiments, flood risk scores may be provided on flood risk score reports.

Description

CROSS REFERENCE TO RELATED APPLICATIONS[0001]This application is a Continuation of and is based upon and claims the benefit of priority under 35 U.S.C. §120 for U.S. Ser. No. 12 / 027,096, filed Feb. 6, 2008, which is a continuation-in-part application of U.S. patent application Ser. No. 11 / 974,911, filed Oct. 16, 2007 and is related to and claims priority under 35 U.S.C. §119(e) to Provisional Application Ser. No. 60 / 899,904, filed Feb. 7, 2007 and Provisional Application Ser. No. 60 / 852,379, filed Oct. 17, 2006, the contents of which are hereby incorporated herein by reference.BACKGROUND[0002]1. Field of the Invention[0003]The present invention relates generally to flood risk analysis and, more specifically, to quantifying flood risk.[0004]2. Description of the Related Art[0005]Worldwide, floods may be the number one cause of losses from natural events. Flood risk may be a function of flood hazards (e.g., hurricanes and / or damage to a levee or dam), property exposure to these hazard...

Claims


Application Information

Patent Timeline
Patent Type & Authority Applications(United States)
IPC IPC(8): G06Q40/08G06N5/04
CPCG06N5/048G06Q40/08G06Q50/16G06Q90/00Y02A10/40
Inventor GREEN, MARK CHARLESSEARS, LEE JASONDU, WEIHIMMELRIGHT, JEFF C.MADDEN, KEVIN EUGENE
Owner CORELOGIC SOLUTIONS
Learn More