
Interactive multidimensional portfolio analysis

Inactive Publication Date: 2015-04-30
LIGHTKEEPER
View PDF15 Cites 6 Cited by
  • Summary
  • Abstract
  • Description
  • Claims
  • Application Information

AI Technical Summary

Benefits of technology

The invention provides a method and system for visualizing dynamically changing financial portfolio statistic data in a web browser. The system includes a data communications server for storing financial portfolio statistic data and computer-executable instructions for presenting the portfolio statistic data. The system allows users to filter the financial portfolio data based on various data facets, such as assets, and display the filtered data on a screen using a time scale and statistic selectable list. The system also includes user-friendly features, such as a sliding scale for users to analyze financial data and subdisplays for users to view statistic data on a portfolio's performance. The technical effect of this invention is to provide a convenient and user-friendly way for users to analyze financial data and make informed decisions.

Problems solved by technology

While having access to all this information can improve a user's ability to manage a financial portfolio, it may be useless unless presented in an organized fashion.
A presentation with limited entries or graphs, or without sufficient context, can inhibit a user's understanding of the information being presented.
This may lead to a significant time investment by the user to parse the presented materials, or worse, incorrect assumptions or analysis.
Typical systems for presenting such information tend to be inflexible or unwieldy, often requiring the user follow a rigid and complex process to display the desired information.

Method used


Image

  • Interactive multidimensional portfolio analysis
  • Interactive multidimensional portfolio analysis
  • Interactive multidimensional portfolio analysis

Examples


Embodiment Construction

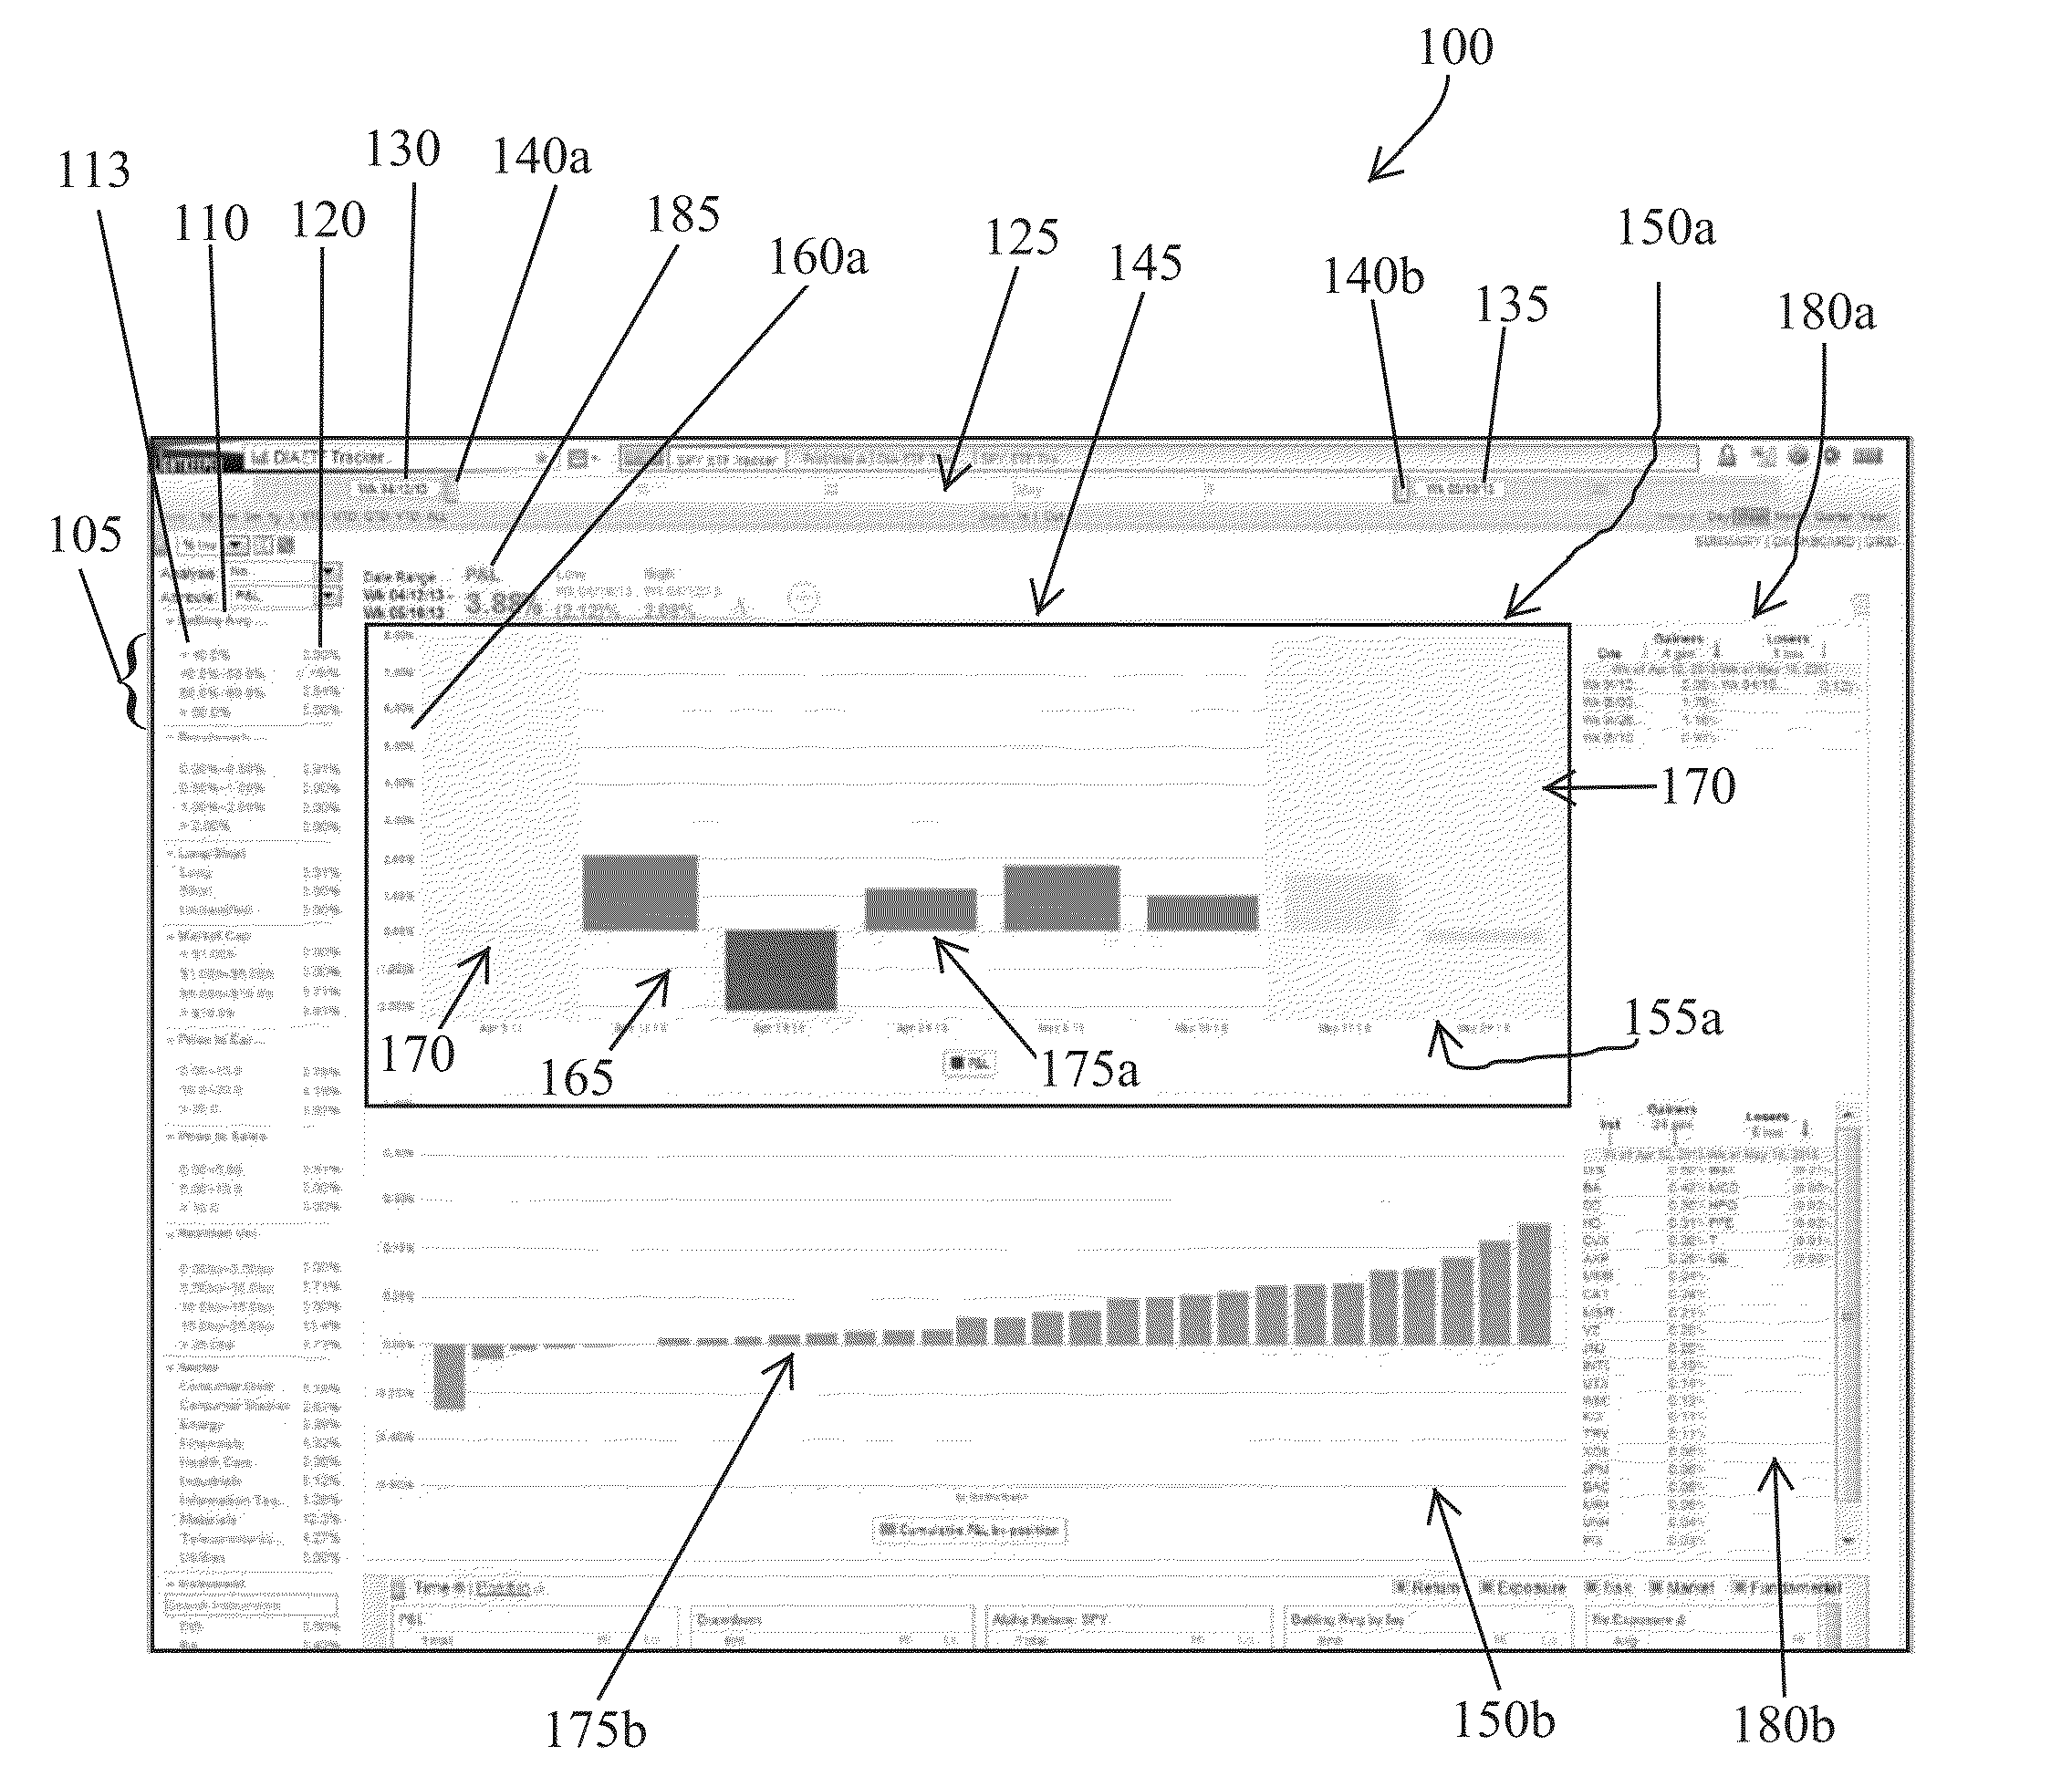
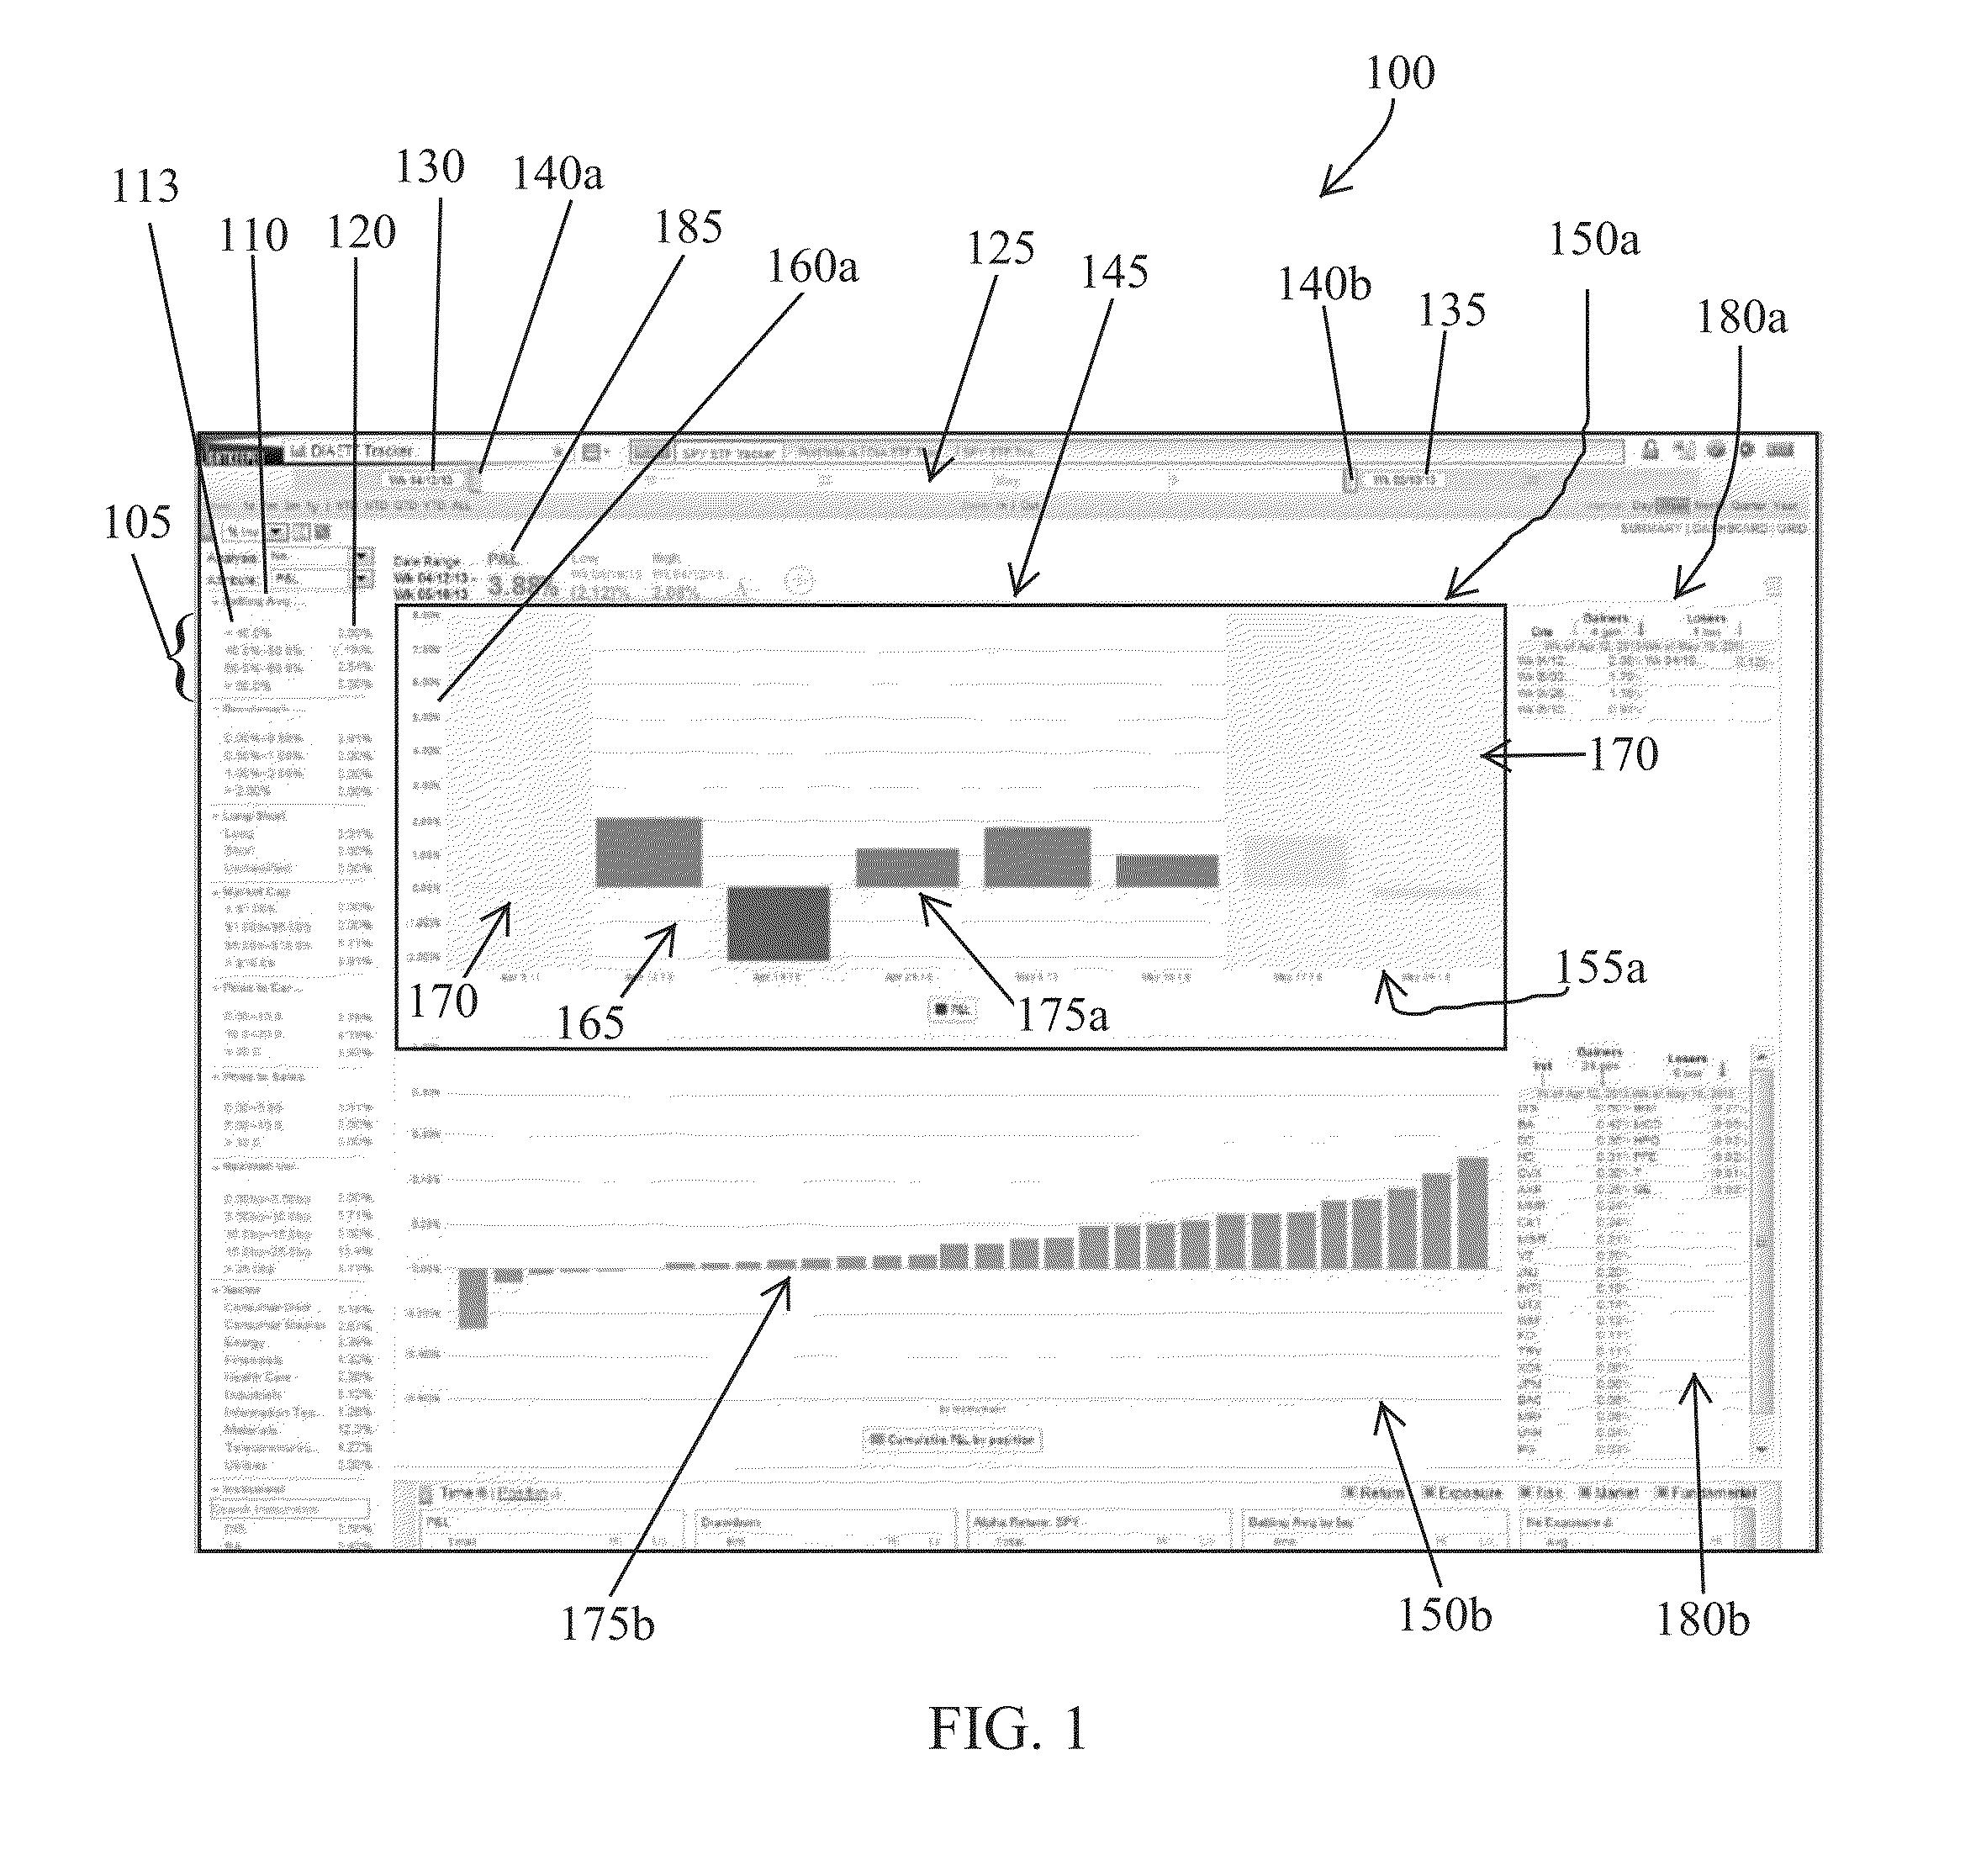
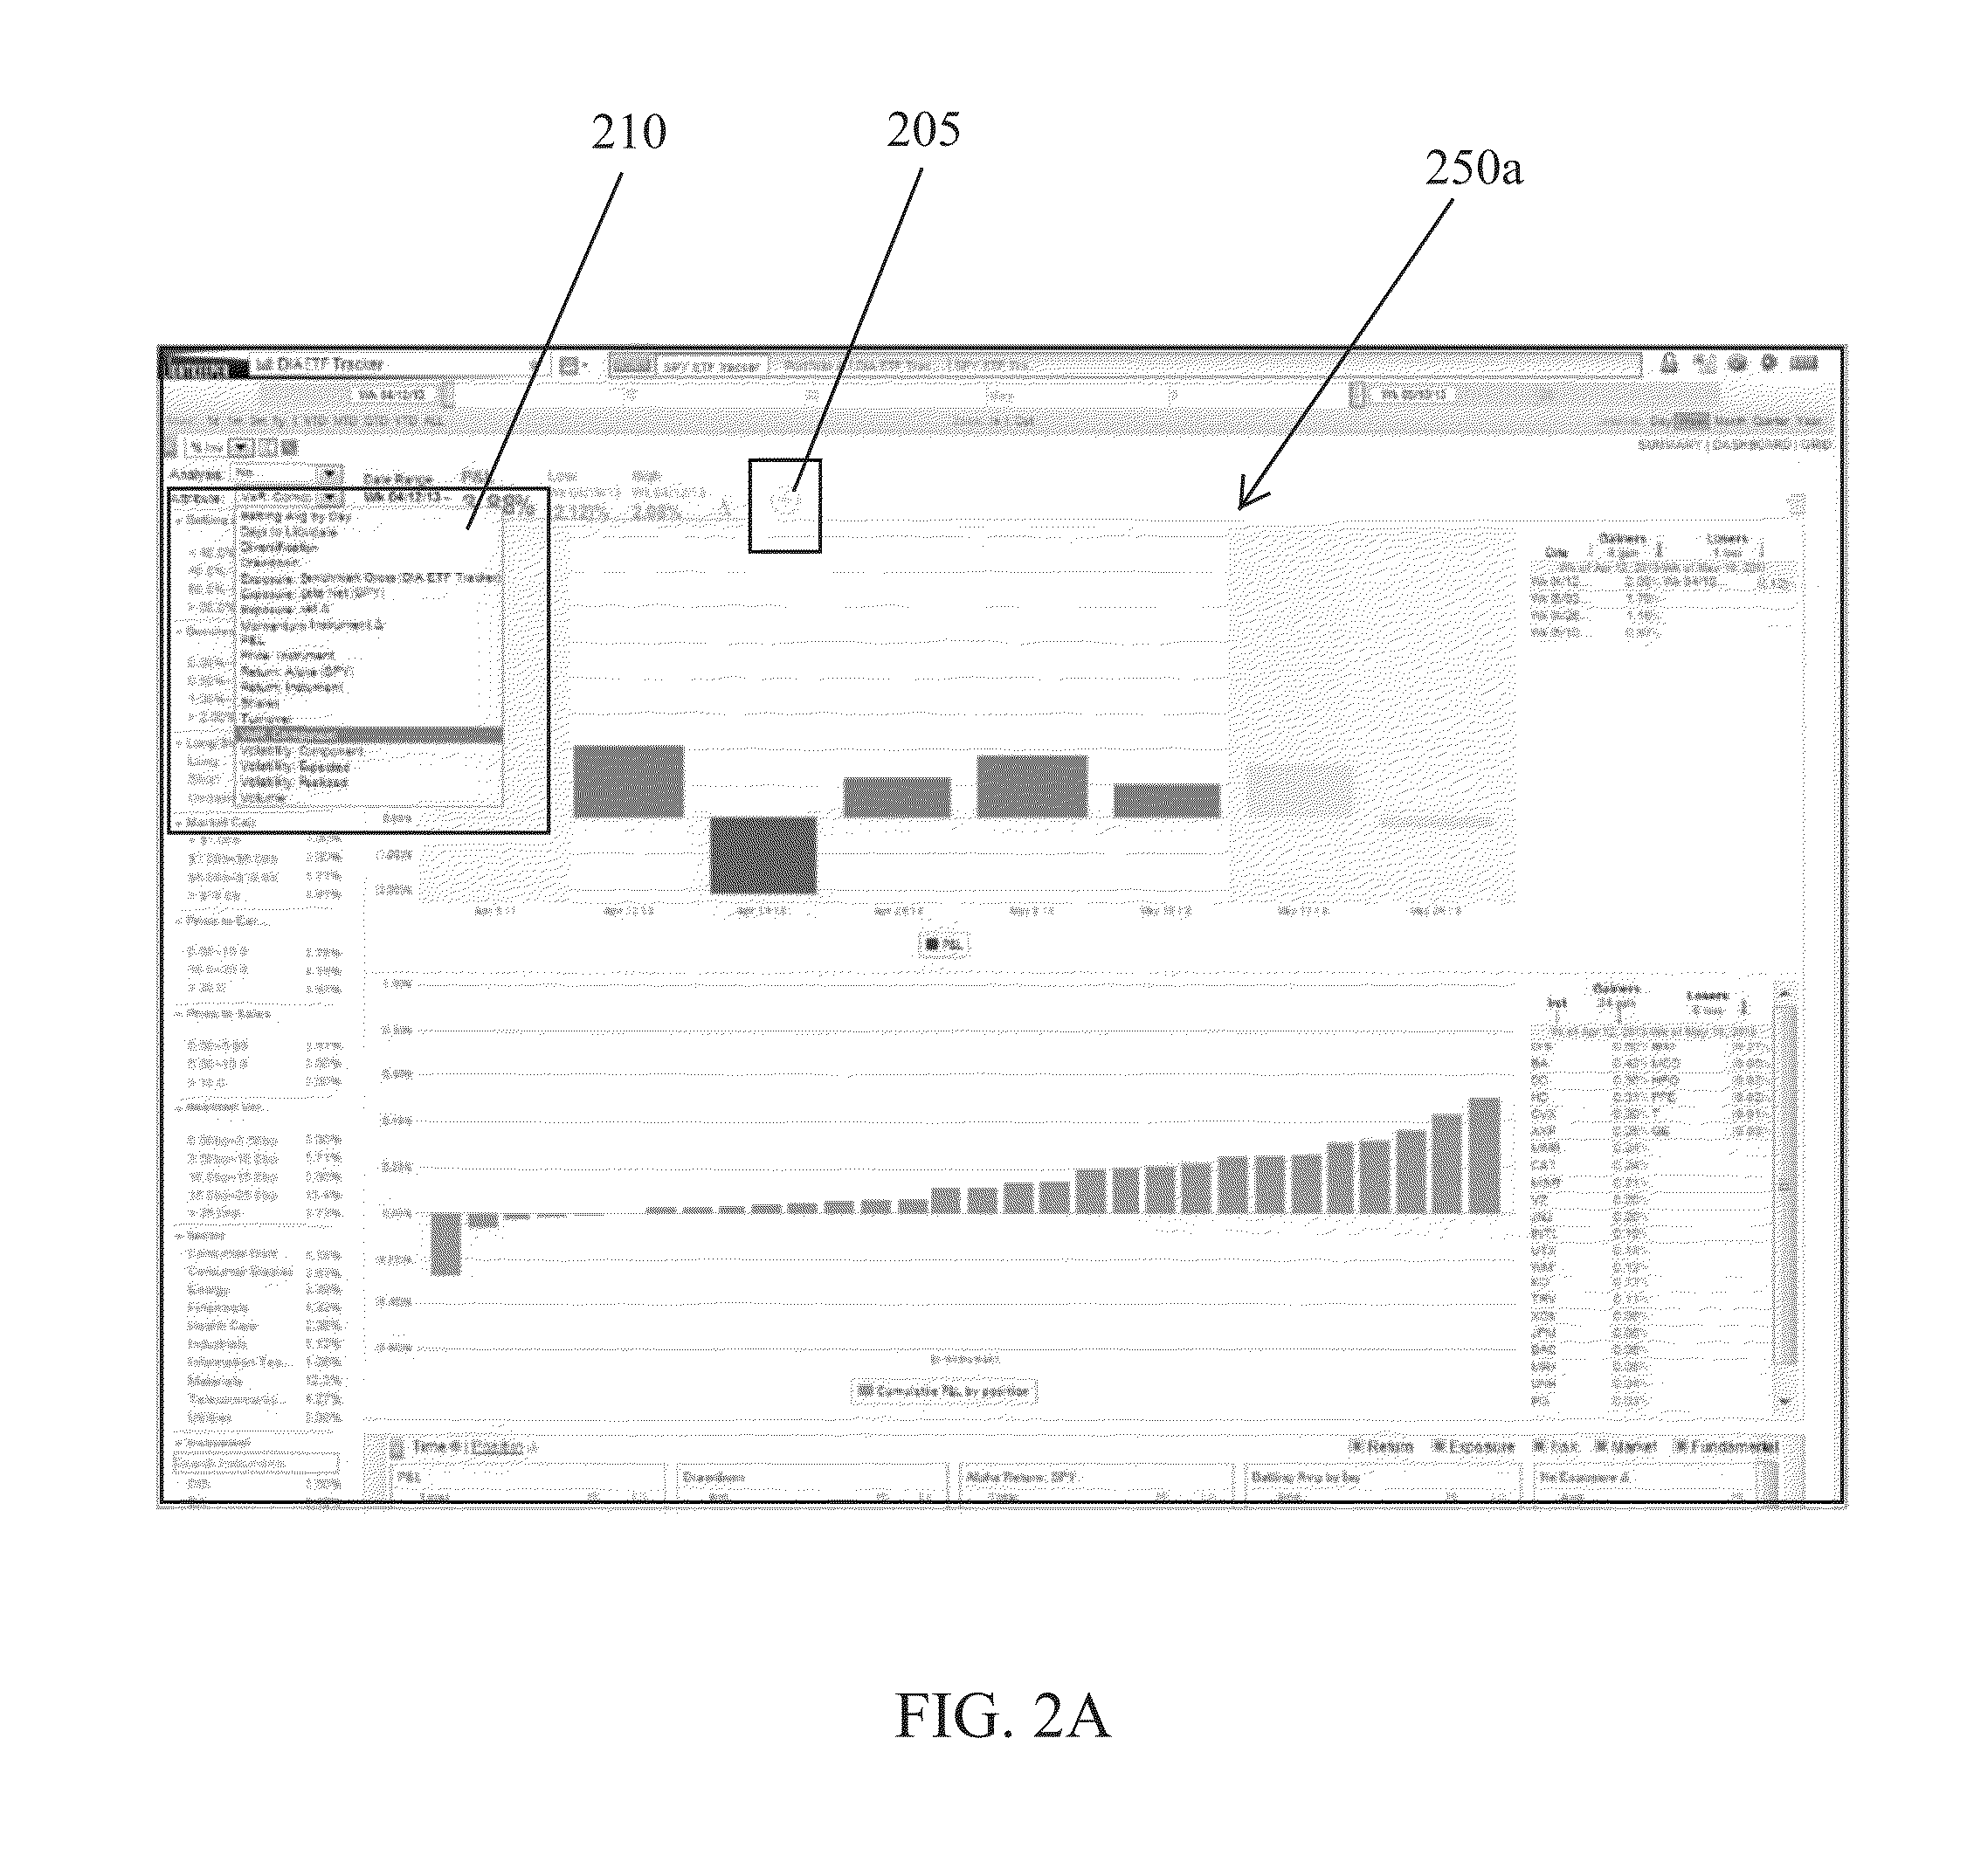
[0025]Referring to FIG. 1, the elements of a browser-based visualization 100 of dynamically changing financial portfolio data is depicted. In this case, the portfolio's return (or profit and loss) is depicted, but the visualization applies more broadly to performance, exposure, risk and market metrics. These are collectively called financial portfolio statistics. The visualization 100 includes several filter selection widgets 105. The filter selection widgets 105 are differentiated based on a related data facet 110 that may be of interest to a user, through which one or more financial portfolio metrics may be filtered. The data facets 110 can be any portfolio statistic (or attribute), including batting average (the average number of investments that were profitable), benchmark performance (the performance relative to a benchmark), days to liquidate (the number of days to liquidate the portfolio's investments under an assumption of a volume participation rate and a residual portfolio...


PUM


Abstract

Financial portfolios are analyzed based on a number of statistics and presented as a visualization on a display. The visualization is changeable based on user inputs, including definition by the user of a analysis period and selection of specific statistical filters. The visualization responds to the inputs substantially in real-time.

Description

FIELD OF THE INVENTION[0001]The invention relates generally to the graphical presentation of data, and more specifically to methods and supporting systems for presenting statistical data in a manner that provides enhanced knowledge of a portfolio and improves operation capabilities.BACKGROUND[0002]Over the past few decades, the financial industry has switched from a paper business to an almost entirely digital business. This transition has enabled participants to access more information than ever before and to perform complex calculations and analysis, all in near real-time. Further, this information can be accessed on a variety of client devices, such as personal computers, monitors, and hand-held devices that are capable of connecting with a server through one or more networks (wired, wireless, etc.).[0003]While having access to all this information can improve a user's ability to manage a financial portfolio, it may be useless unless presented in an organized fashion. A presentat...

Claims


Application Information

Patent Timeline
IPC IPC(8): G06Q40/06G06F3/0482
CPCG06F3/0482G06Q40/06G06T11/206
Inventor LEFTWICH, ROBERTHOASHI, MAKIDIAS, DANNYCALDER, MATTHEWLONGO, LARRYRICHARD, MICHAELMACKEY, RYANBLINN, WILLIAMNORTON, STEVEMARTIN, BRIANTISHMAN, ROBERT
Owner LIGHTKEEPER
Learn More