

Set of Tumor-Markers
a tumor marker and tumor technology, applied in the field of tumor markers, can solve the problems of unnecessarily treating patients for malignant diseases, lack of known specificity, poor classification,
- Summary
- Abstract
- Description
- Claims
- Application Information
AI Technical Summary
Benefits of technology
Problems solved by technology
Method used
Image

Examples
example 1
Datasets
[0042]Datasets were downloaded either from websites or from public repositories (GEO, ArrayExpress). Table 7 shows a summary of the datasets used in this study (He et al, PNAS USA 102(52): 19075-80 (2005); Huang et al. PNAS USA 98(26): 15044-49 (2001); Jarzab Cancer Res 65(4): 1587-97 (2005); Lacroix Am J Pathol 167(1): 223-231 (2005); J Clin Endocrinol Metab 90(5): 2512-21 (2005)). Here, three different categories of non-cancer tissues are used: contralateral (c.lat) for healthy surrounding tissue paired with a tumor sample, other disease (o.d.) for thyroid tissue operated for other disease and SN (Struma nodosa) for benign thyroid nodules. For all subsequent analysis these were combined as healthy.
TABLE 7Microarray Data used for Meta AnalysisPublishedFTAFTCPTCSNo.d.c.lat PlatformHePNAS 2005009009Affy U133plusHuangPNAS 2001008800Affy U133AJarzabCancer Res 2005002301117Affy U133ALacroixAm J Path 20054801100Agilent CustomReyesnot published?007007Affy U133AWeberJ Clin Endocr12...
example 2
Finding the Gene Overlap
[0043]The first step in any MetaAnalysis of microarray data is to find the set of genes which is shared by all microarray platforms used in the analysis. Traditionally, overlap is assessed by finding common UniGene identifiers. This, however, disregards all possible splice variations in the genes under investigation. For example, if a gene had 2 splice variants, one of which was differentially expressed in the experiment and the other not and if one platform would contain an oligo specific only to the differentially expressed variant and the other platform only an oligo to the other variant, then a matching based on UniGene would merge probes which measure different things.
[0044]To overcome this problem, the approach adopted here merges only probes which annotate to the same set of RefSeq identifiers. To this end all matching RefSeqs were downloaded for each probe(set), either via the Bioconductor annotation packages (hgu133a, hgu95a and hgu133plus2; availabl...
example 3
Preprocessing and Data Integration
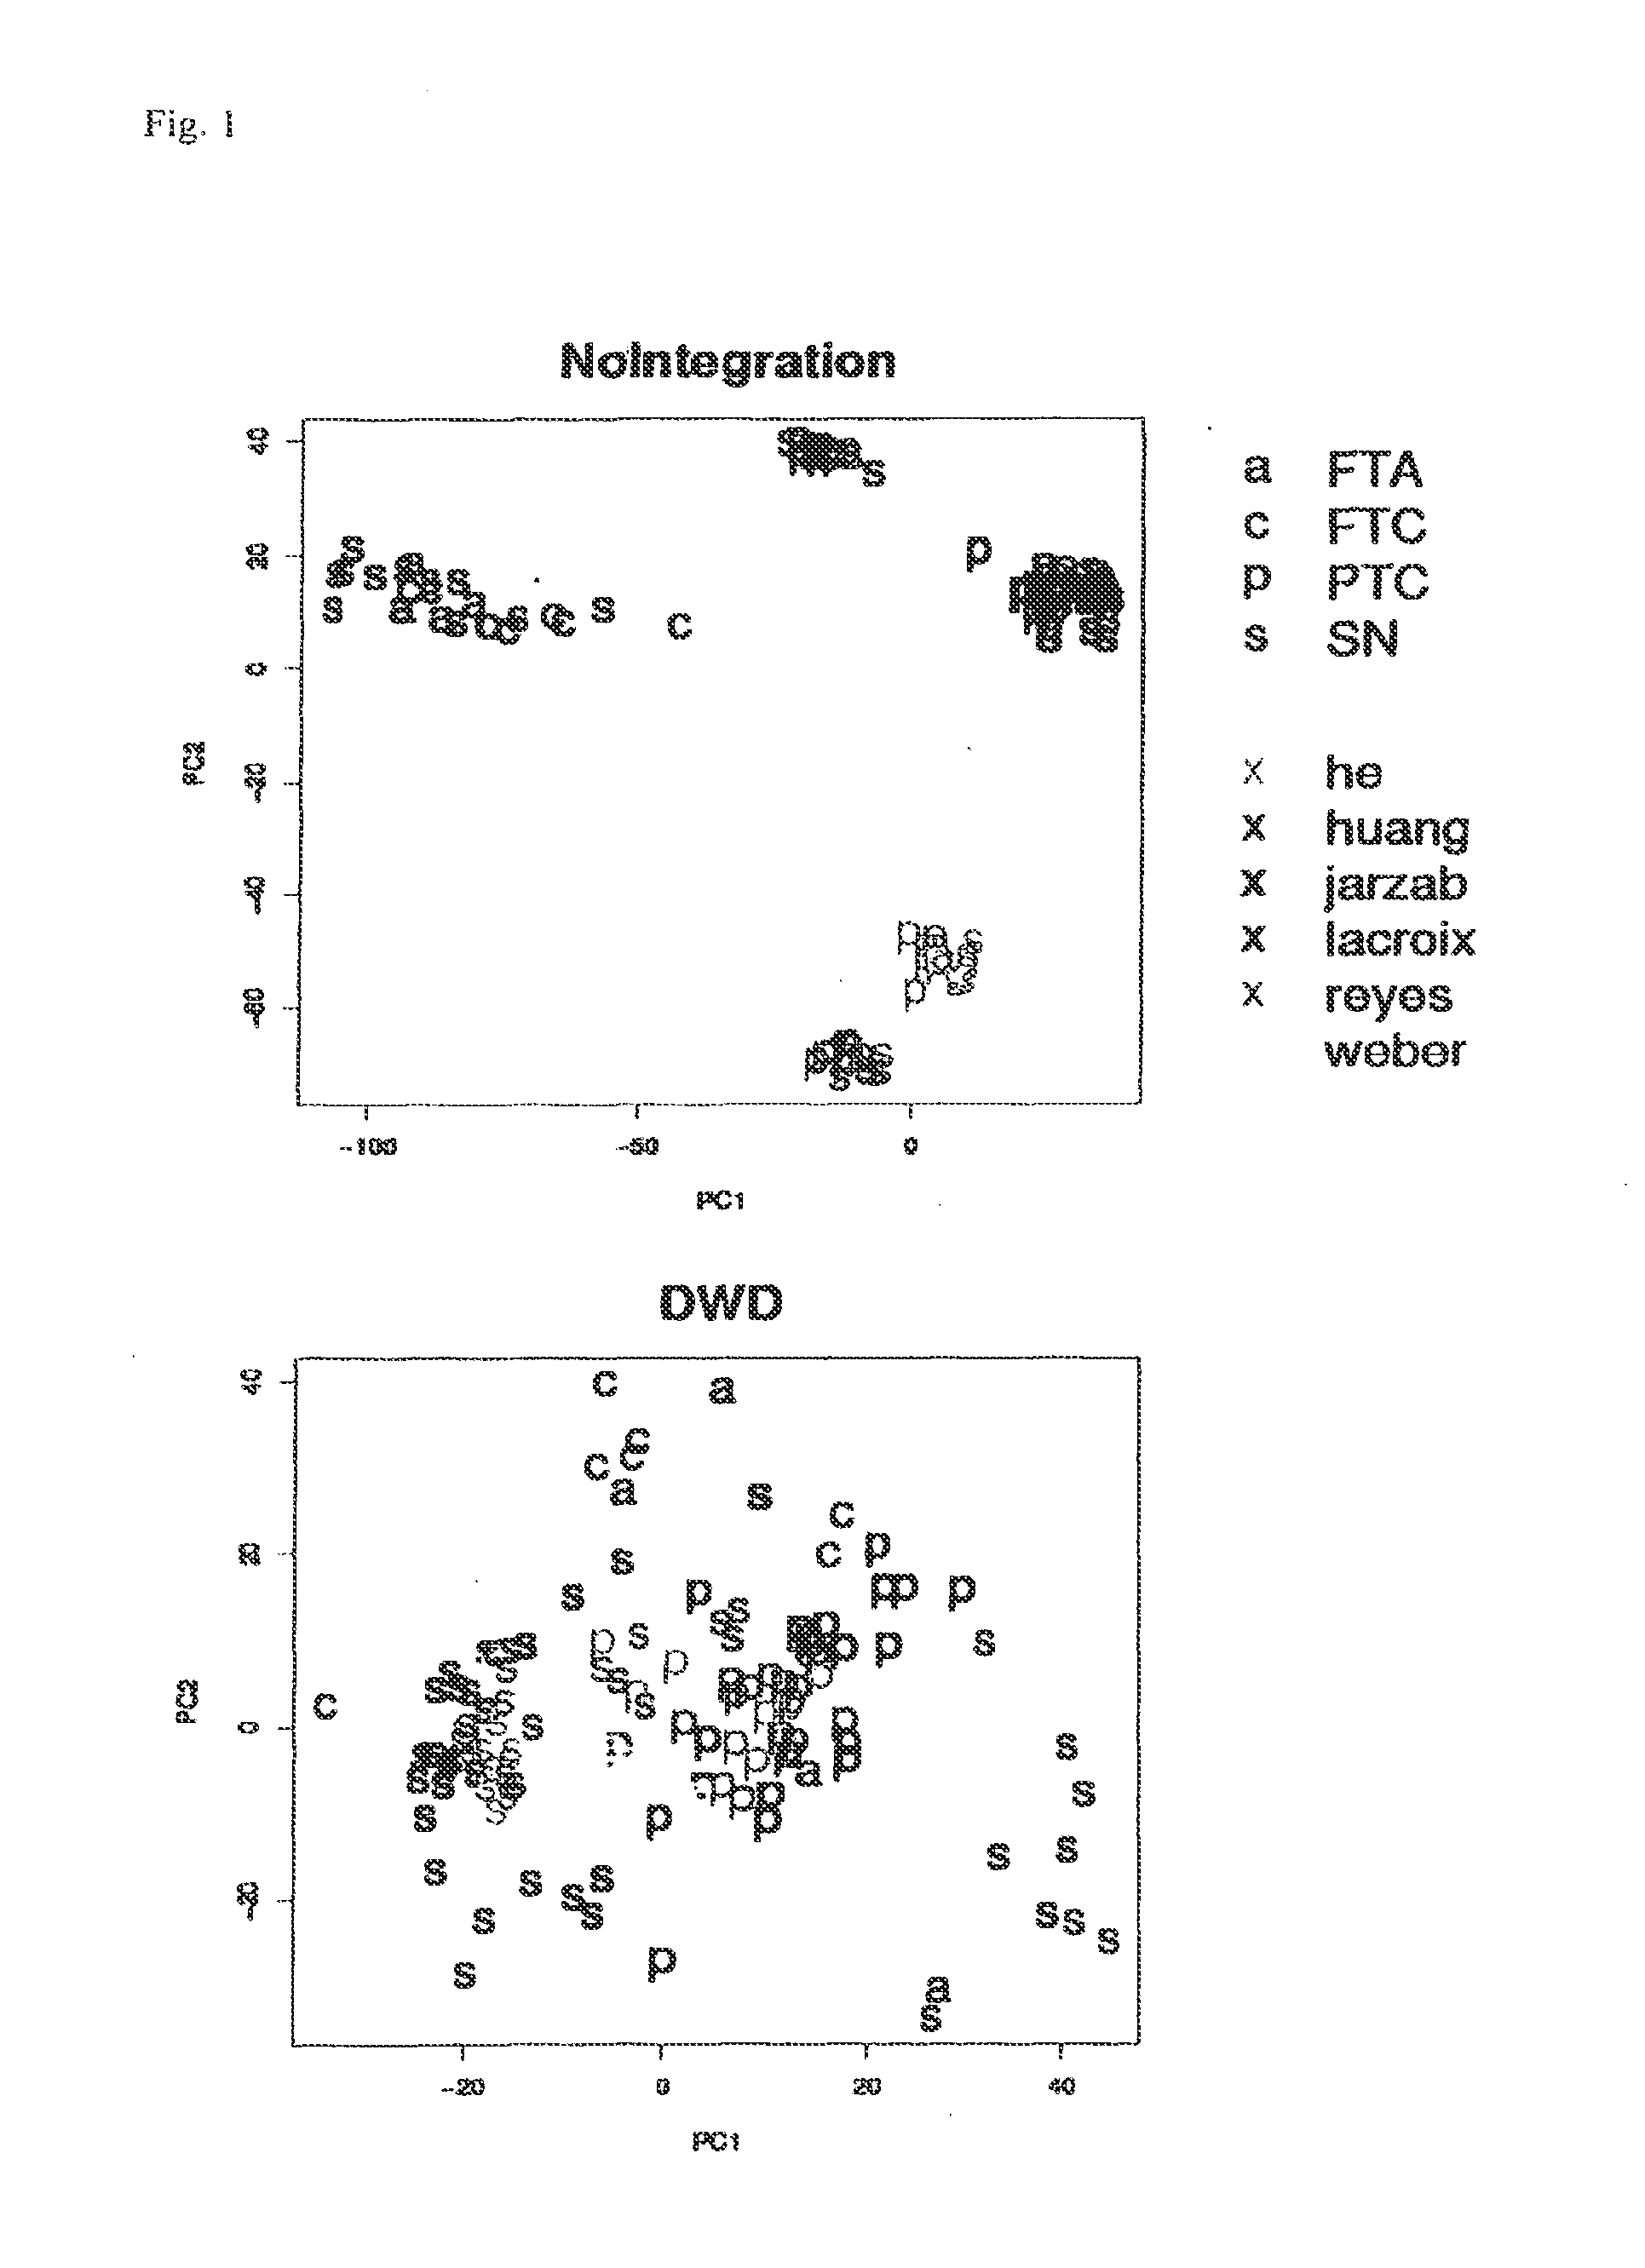
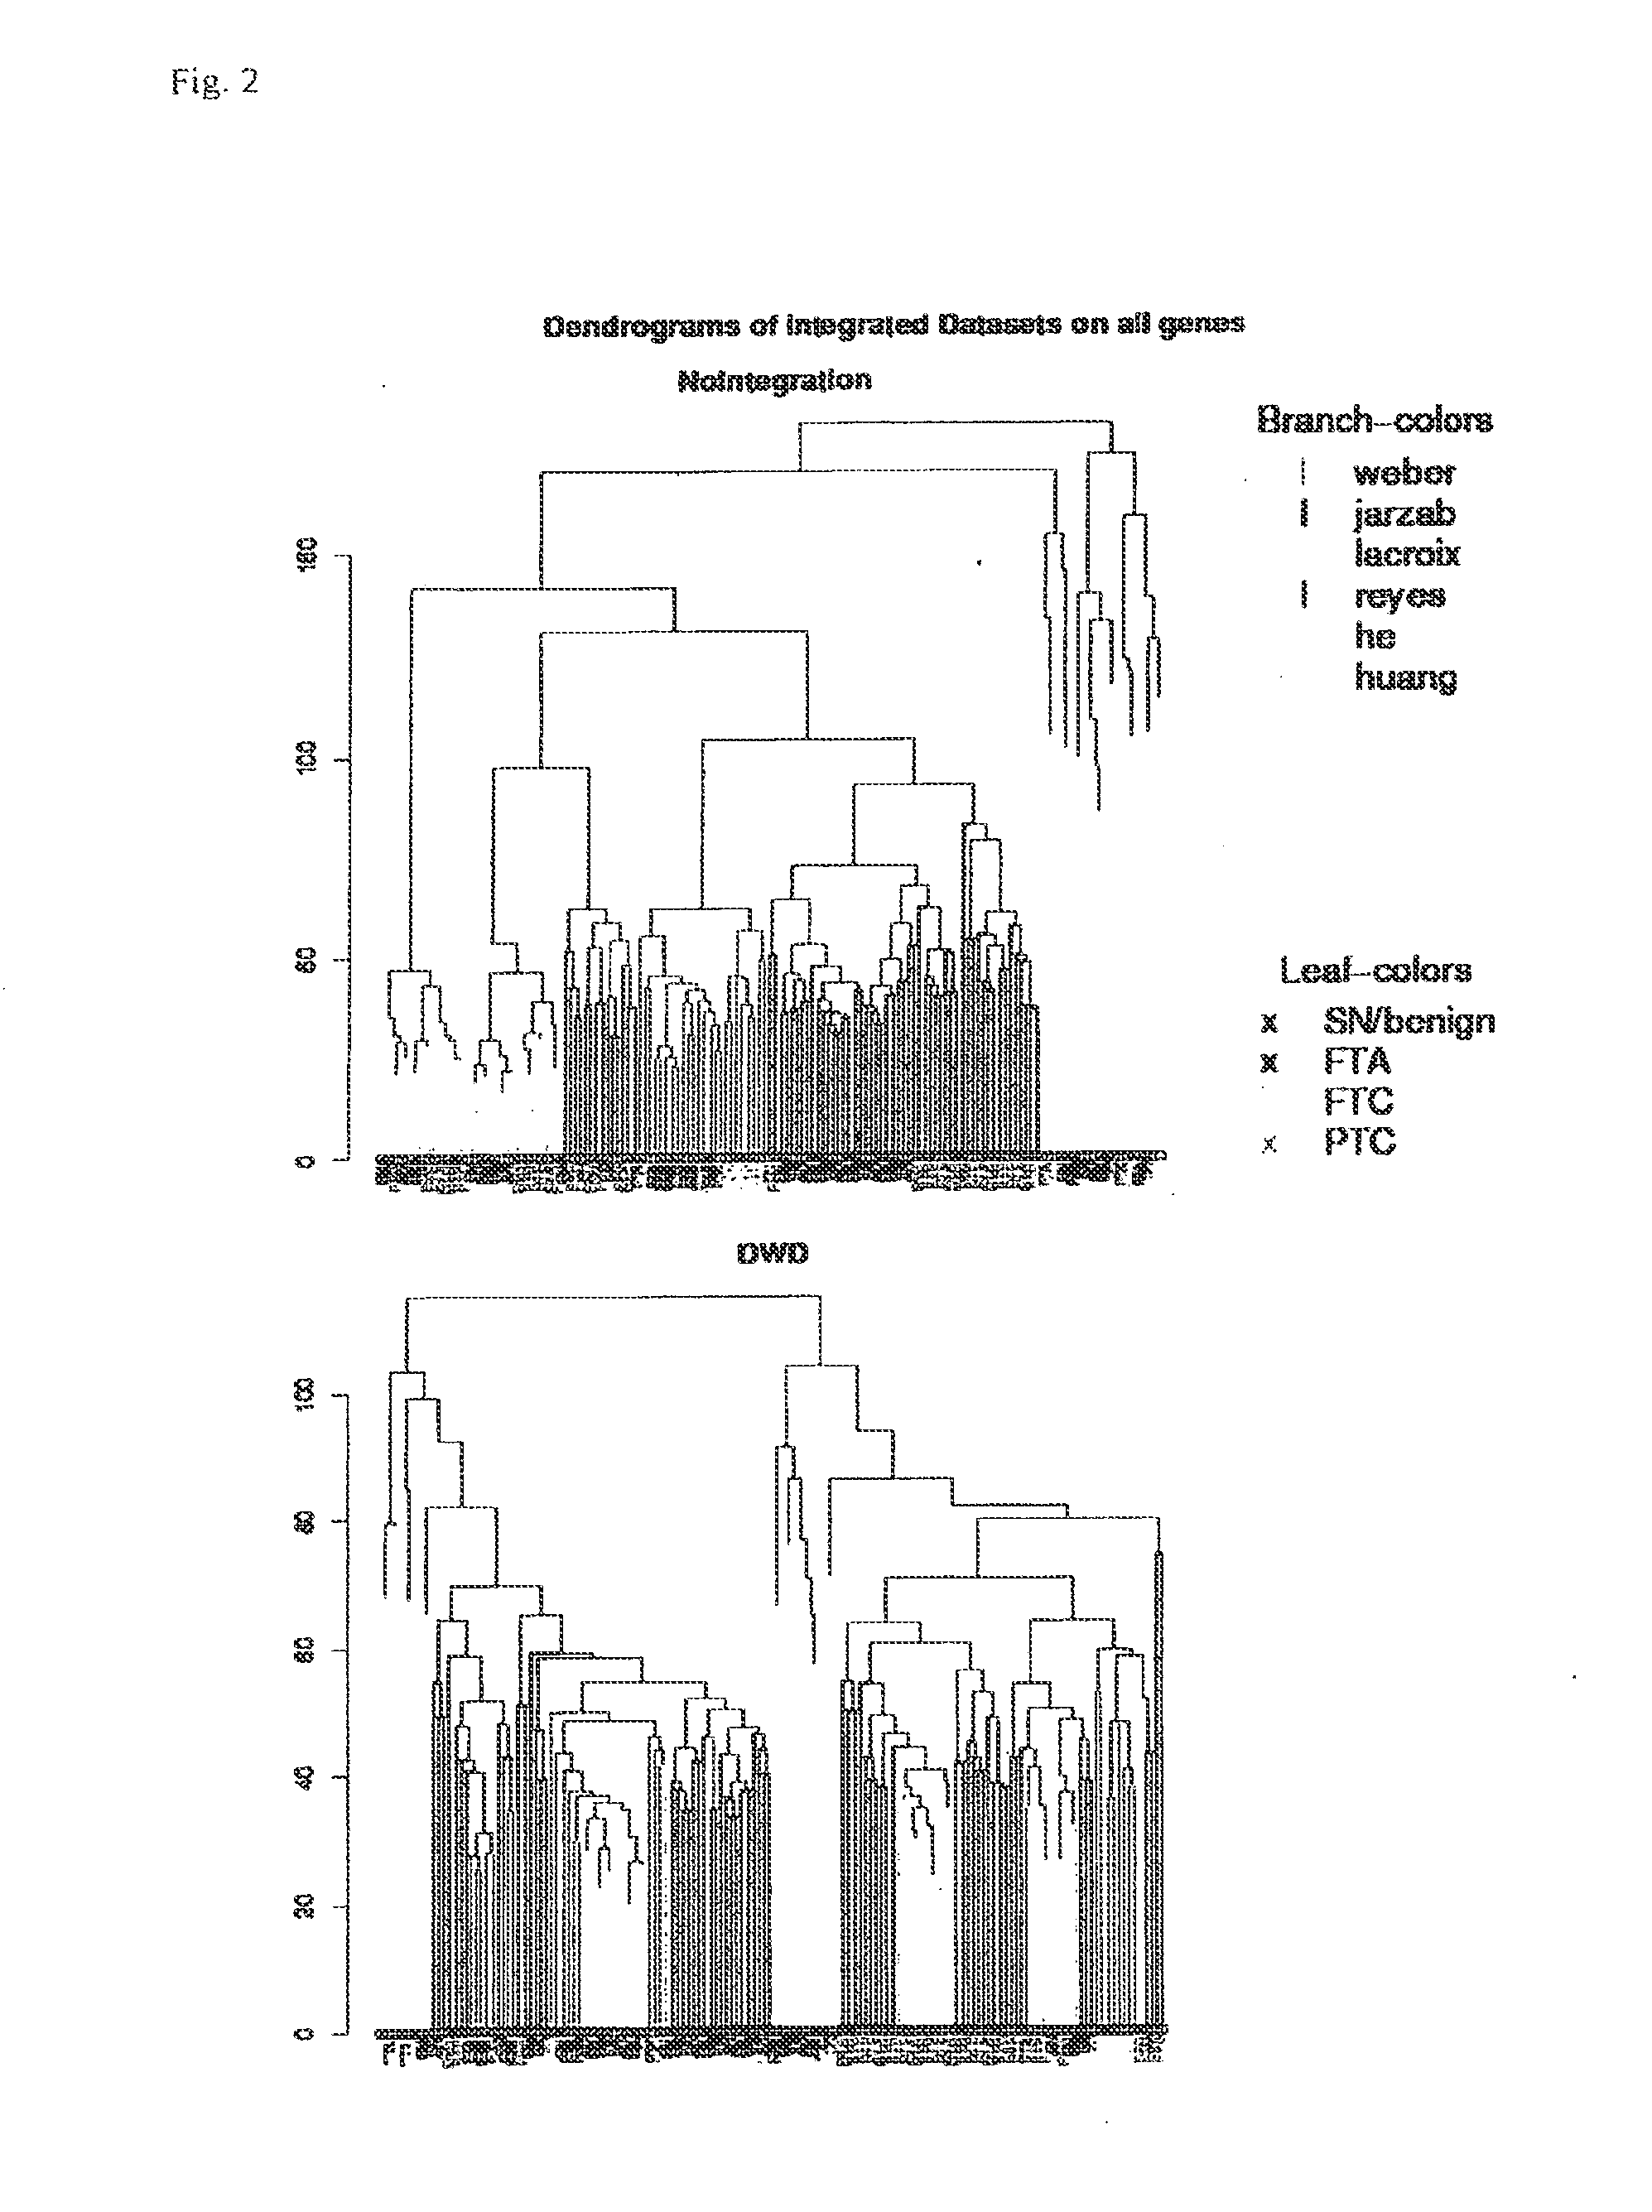
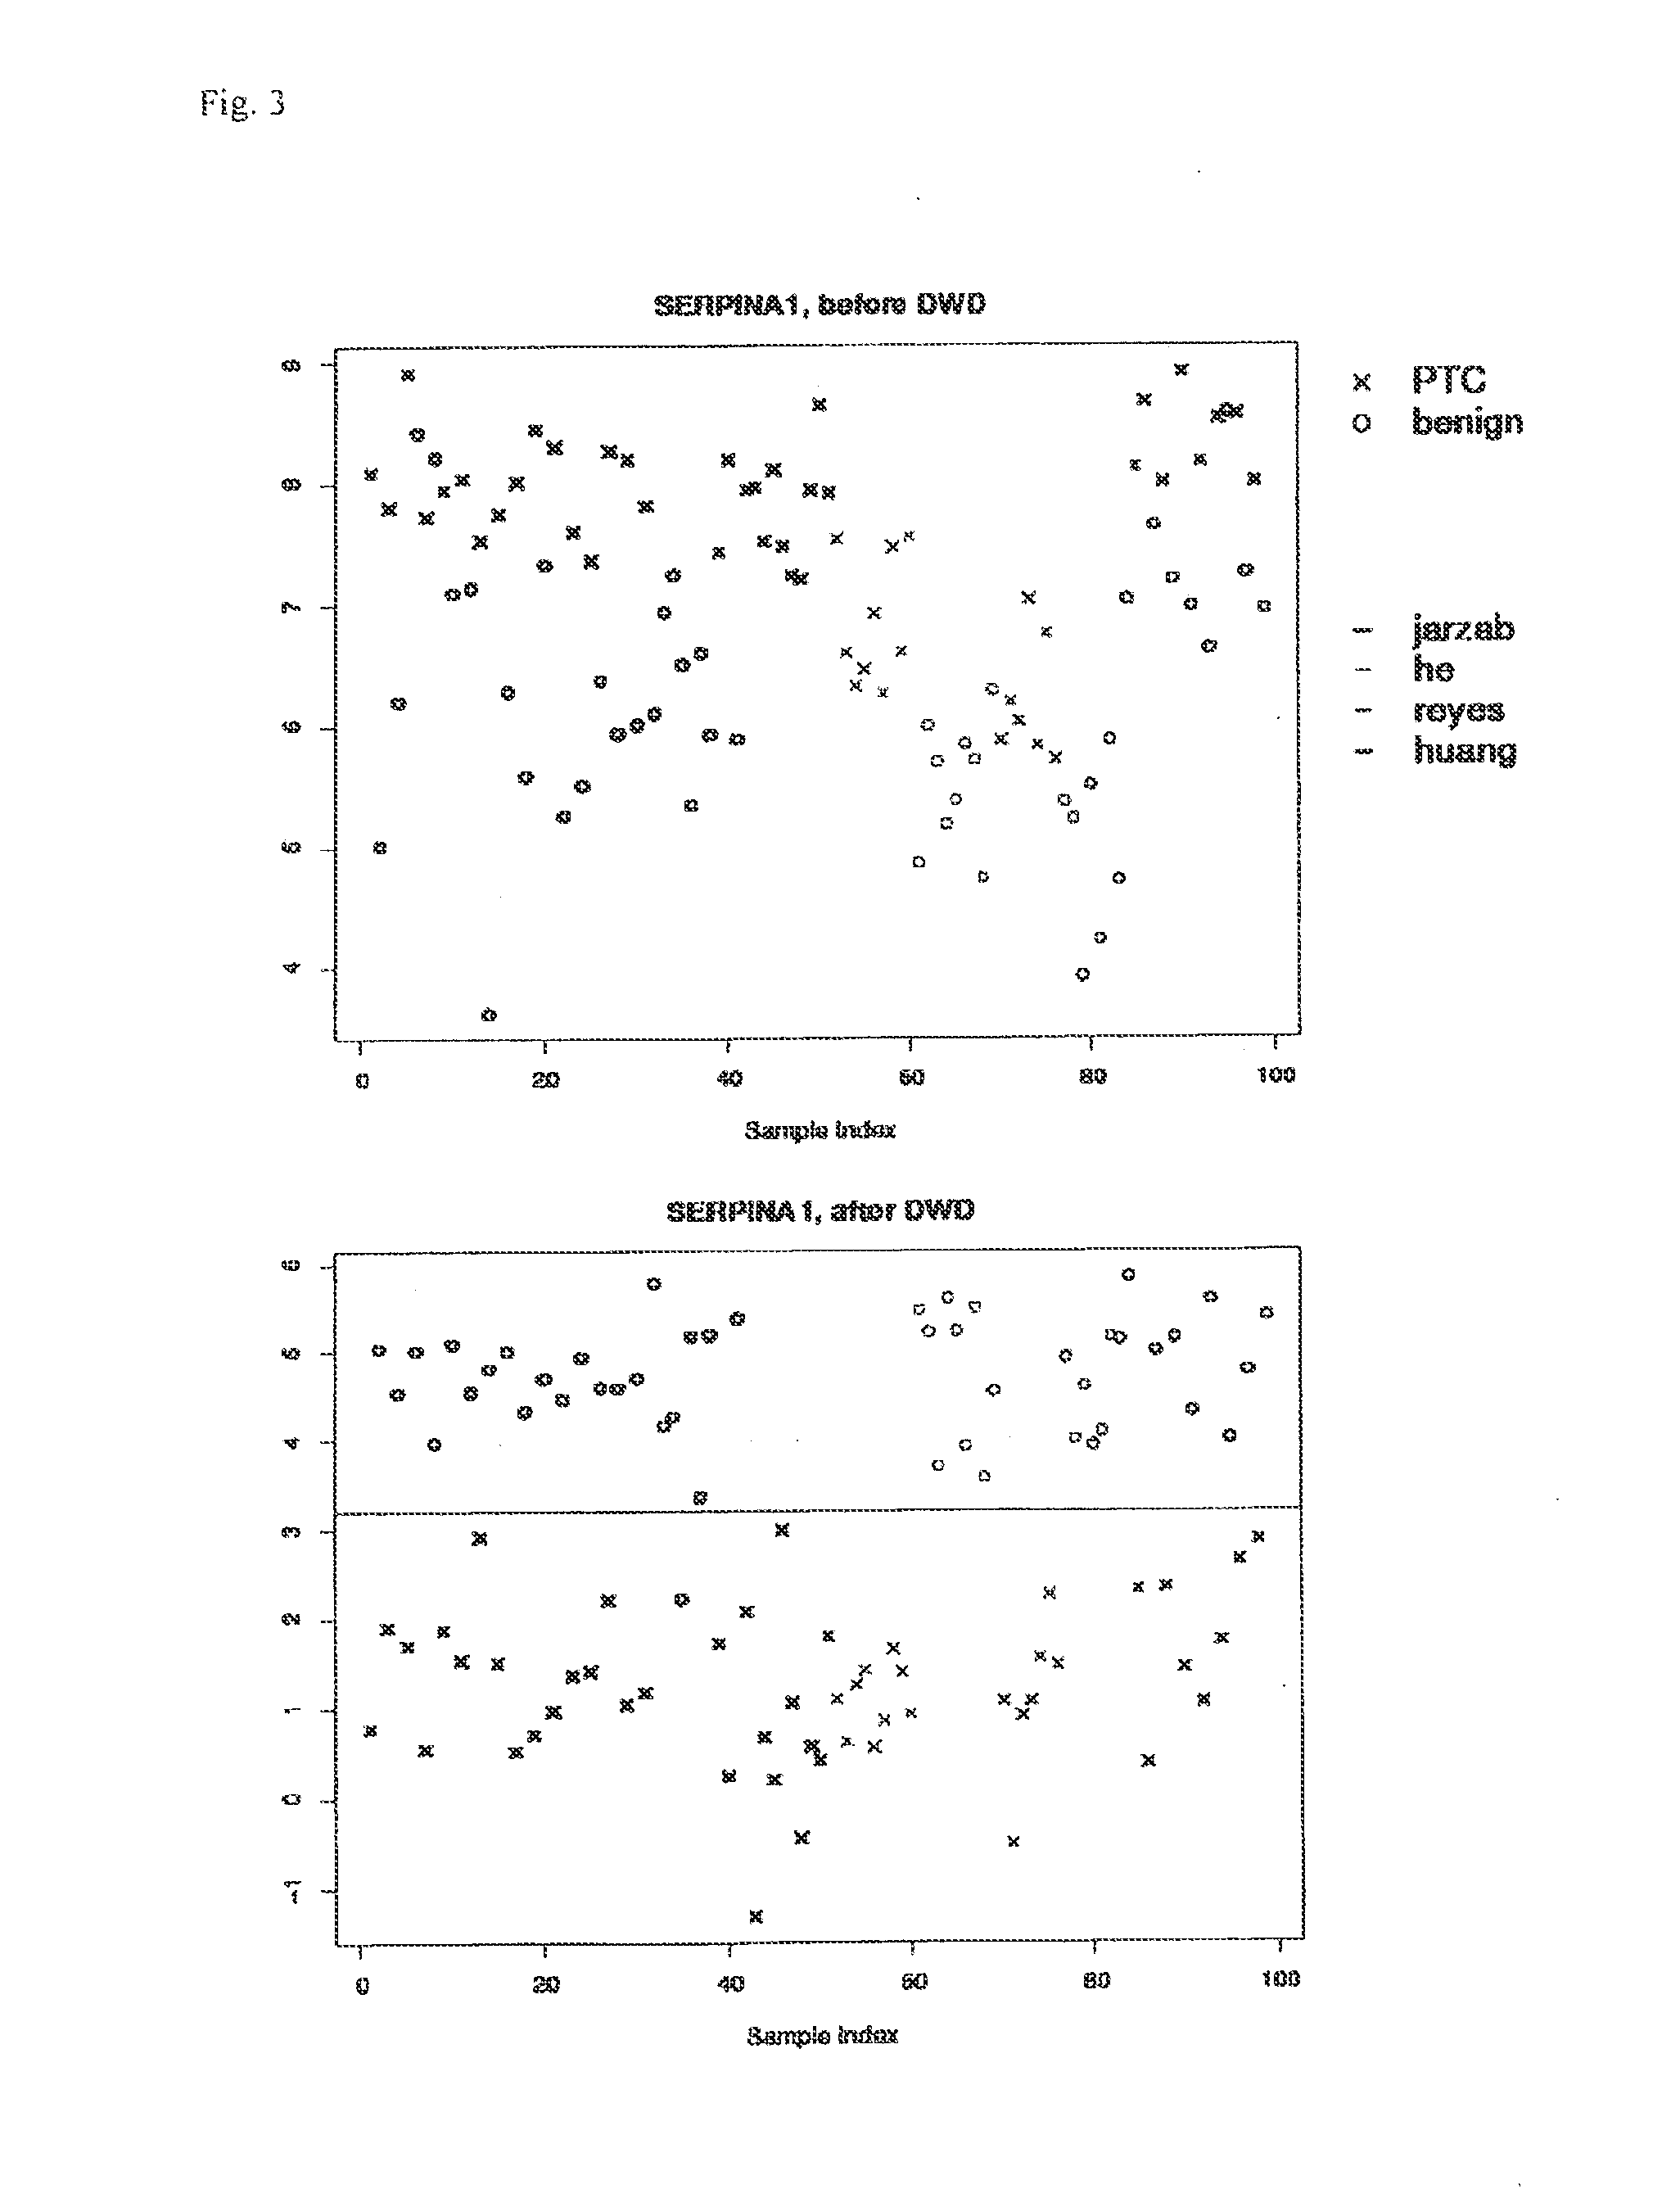
[0045]First each dataset was background-corrected and normalised separately, as recommended for each platform (lowess for dual color and quantile normalisation for single color experiments) (Bolstad et al. Bioinformatics 19(2): 185-193(2003); Smyth et al. Methods 31(4): 265-273 (2003)), then they were merged and quantile normalised collectively. Despite all preprocessing, it has been shown that data generated on different microarray platforms or on different generations of the same platform may not be comparable due to platform specific biases (Eszlinger et al. Clin Endocrinol Metab 91(5): 1934-1942 (2006)). This is also evident from principal component analysis of the merged data as shown in FIG. 1. In order to correct for these biases, methods have been developed for integration of microarray data. One of these methods is Distance Weighted Discrimination (DWD) which is described in detail elsewhere (Benito et al. Bioinformatics 20(1): 105-114 (200...
PUM
| Property | Measurement | Unit |
|---|---|---|
| Fraction | aaaaa | aaaaa |
| Fraction | aaaaa | aaaaa |
Abstract
Description
Claims
Application Information