Presentation of multivariate data on a graphical user interface of a computing system

Active Publication Date: 2016-04-07
PALANTIR TECHNOLOGIES
View PDF20 Cites 59 Cited by
  • Summary
  • Abstract
  • Description
  • Claims
  • Application Information

AI Technical Summary

Benefits of technology

[0021]For purposes of summarizing the embodiments and the advantages achieved over the prior art, certain items and advantages are described herein. Of course, it is to be understood that not necessarily all such items or advantages may be achieved in accordance with any particular embodiment. Thus, for example, those skilled in the art will recognize that the inventions may be embod

Problems solved by technology

A significant drawback of a parallel coordinates plot is the visual clutter that results for large data sets.
Another drawback is “overplotting,” in which the lines representing the data points are plotted on top of each other, which can hamper the recognition of patterns in the data set.

Method used


Image

  • Presentation of multivariate data on a graphical user interface of a computing system
  • Presentation of multivariate data on a graphical user interface of a computing system
  • Presentation of multivariate data on a graphical user interface of a computing system

Examples


Embodiment Construction

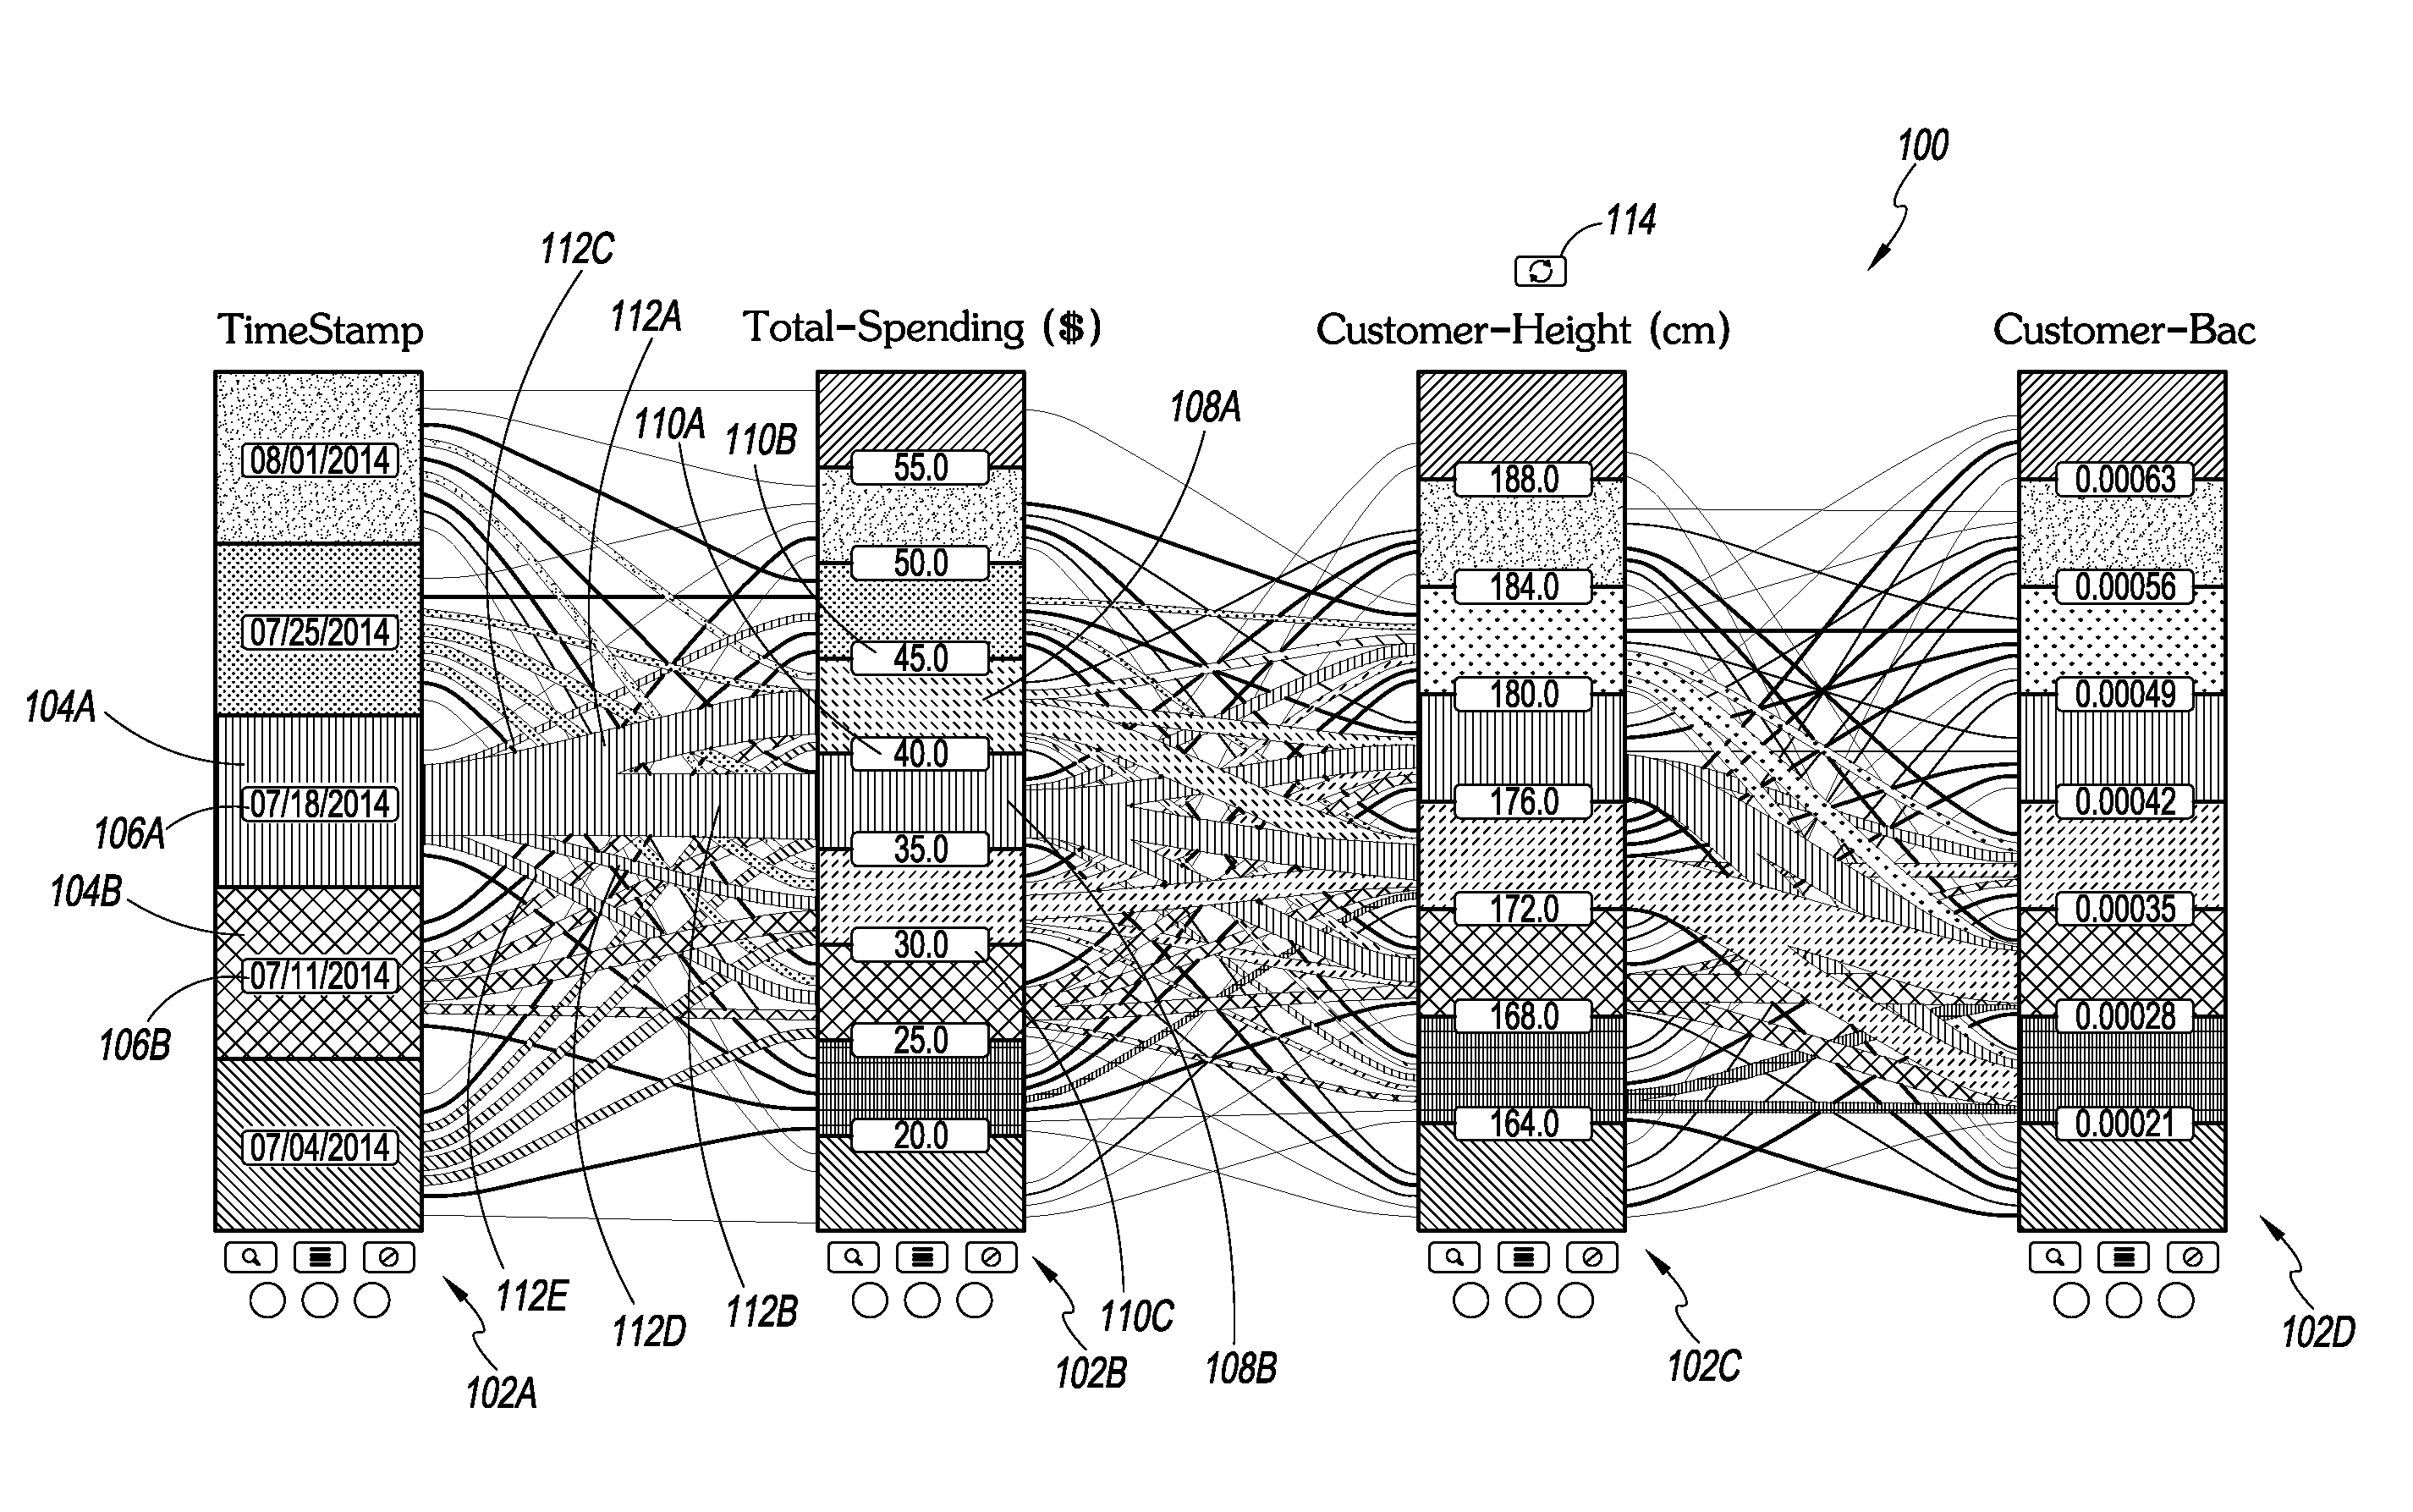
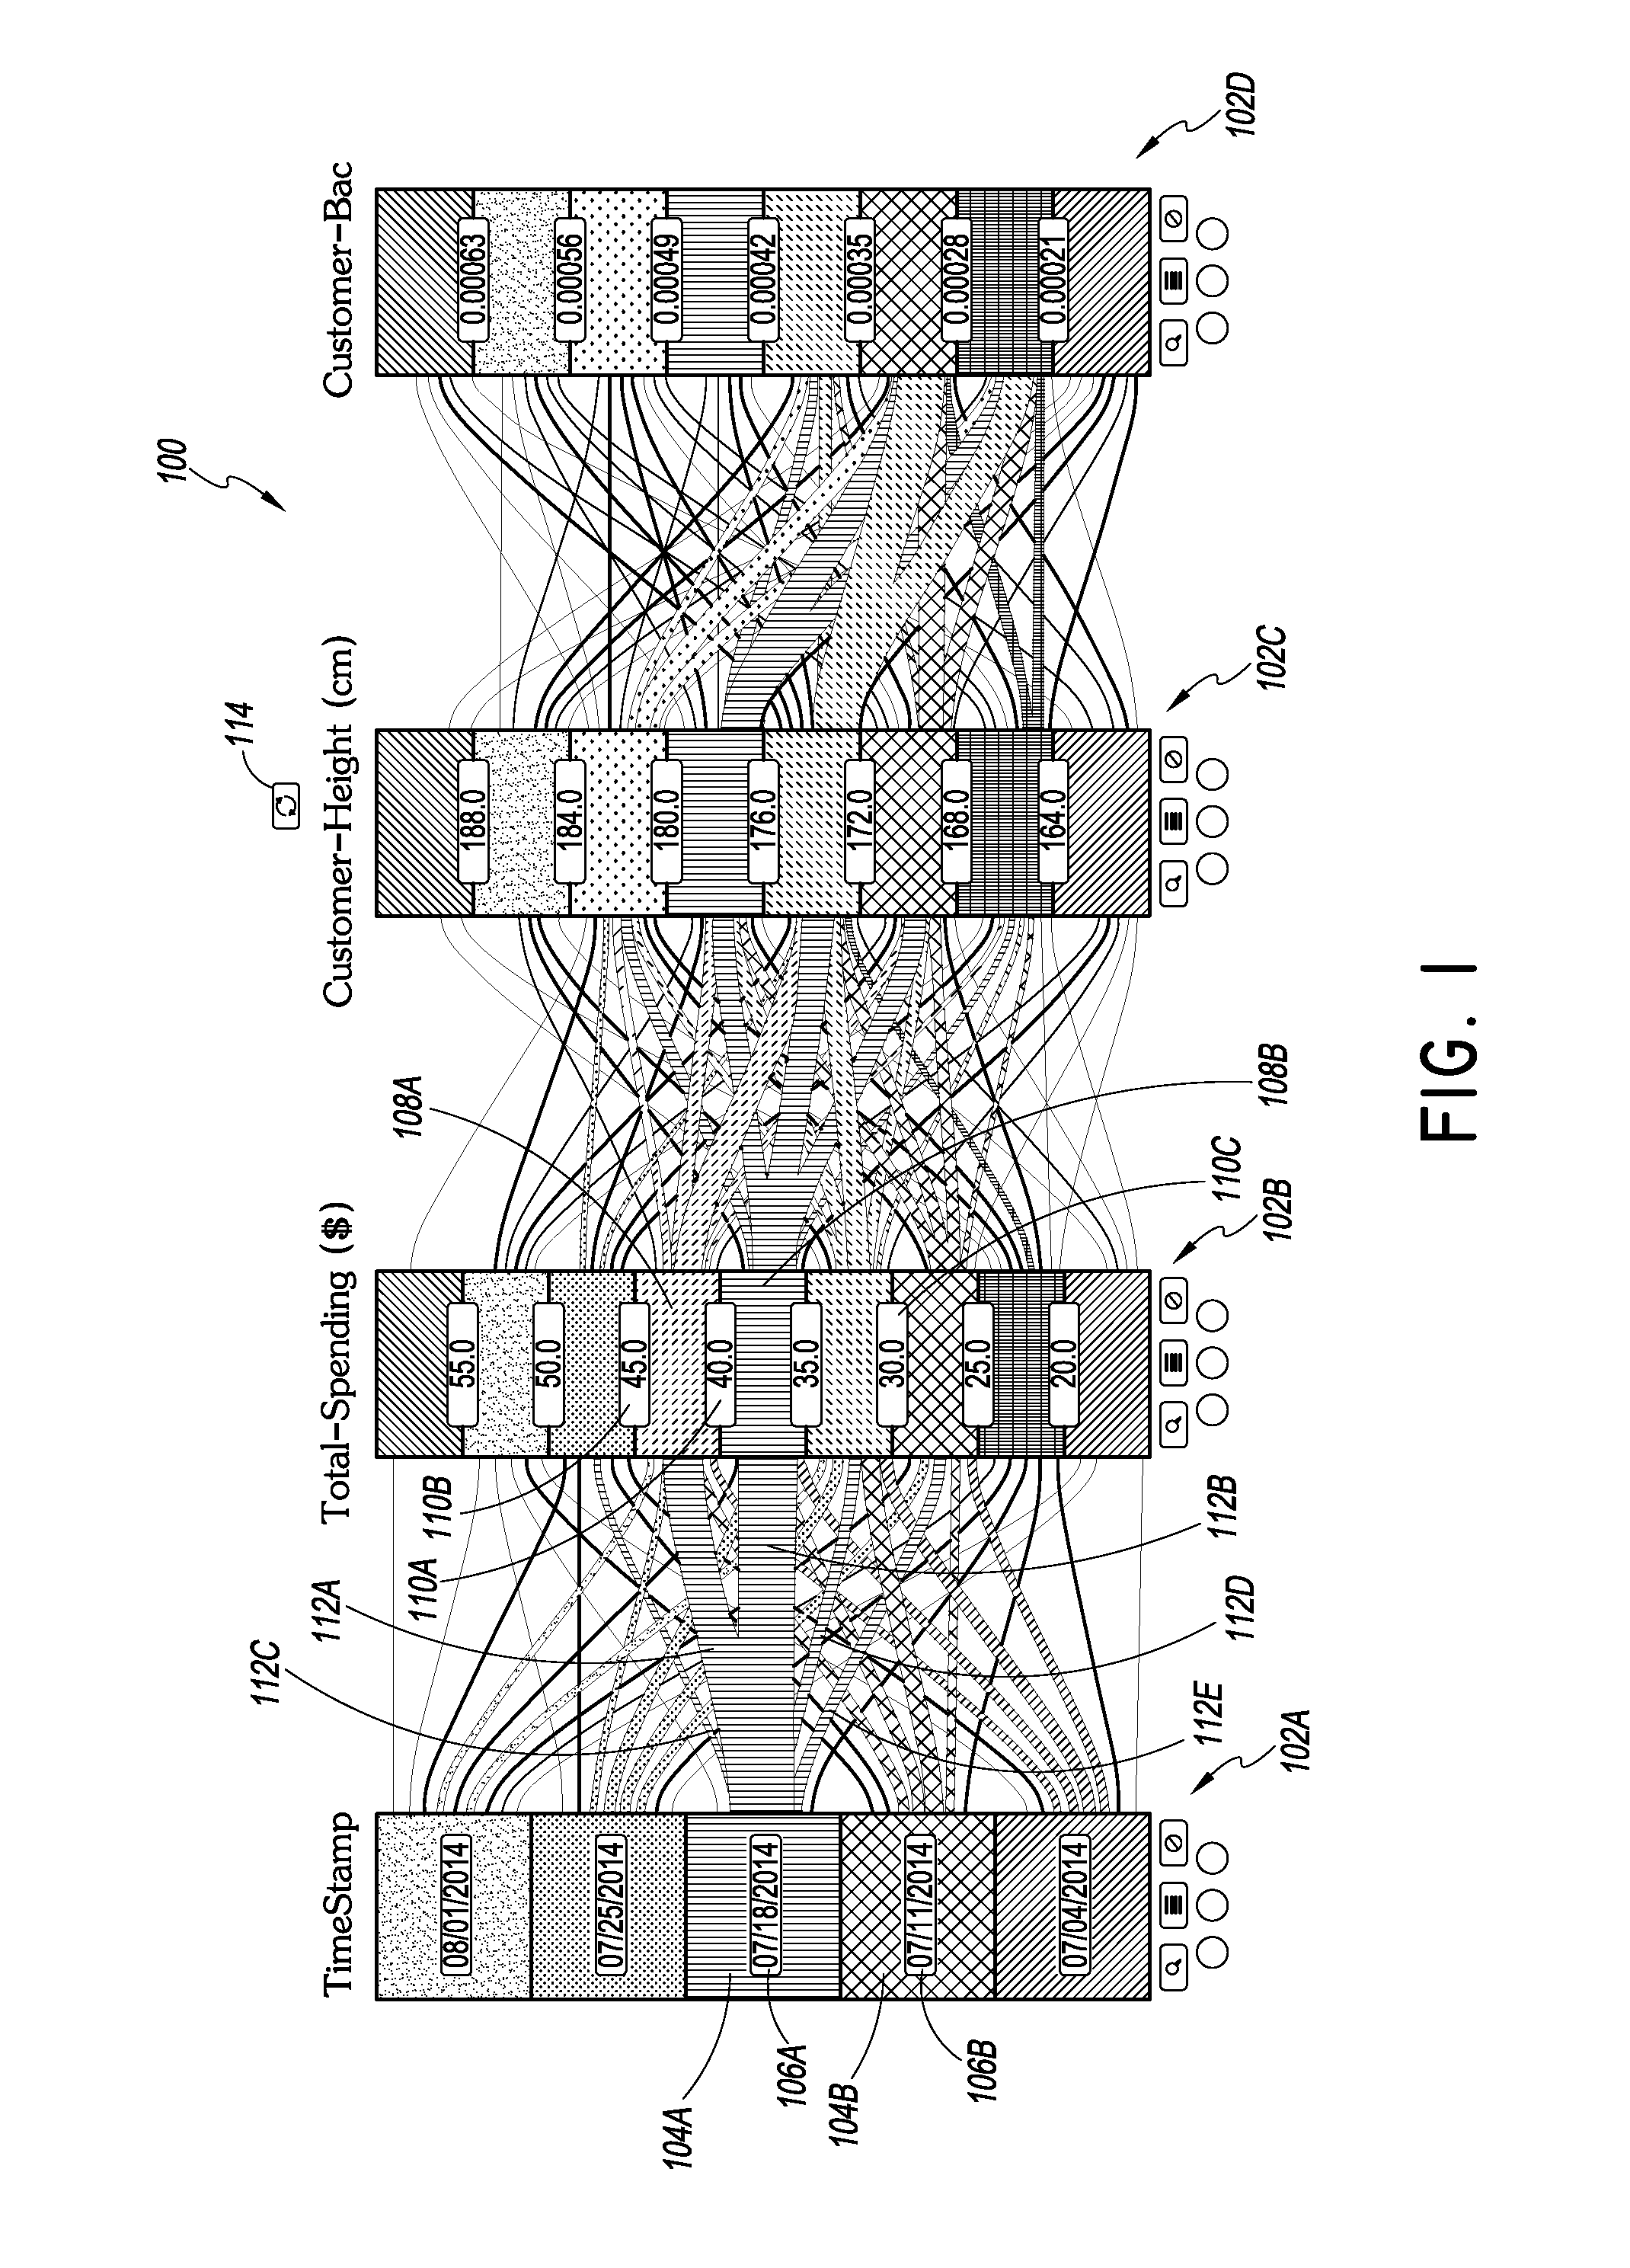
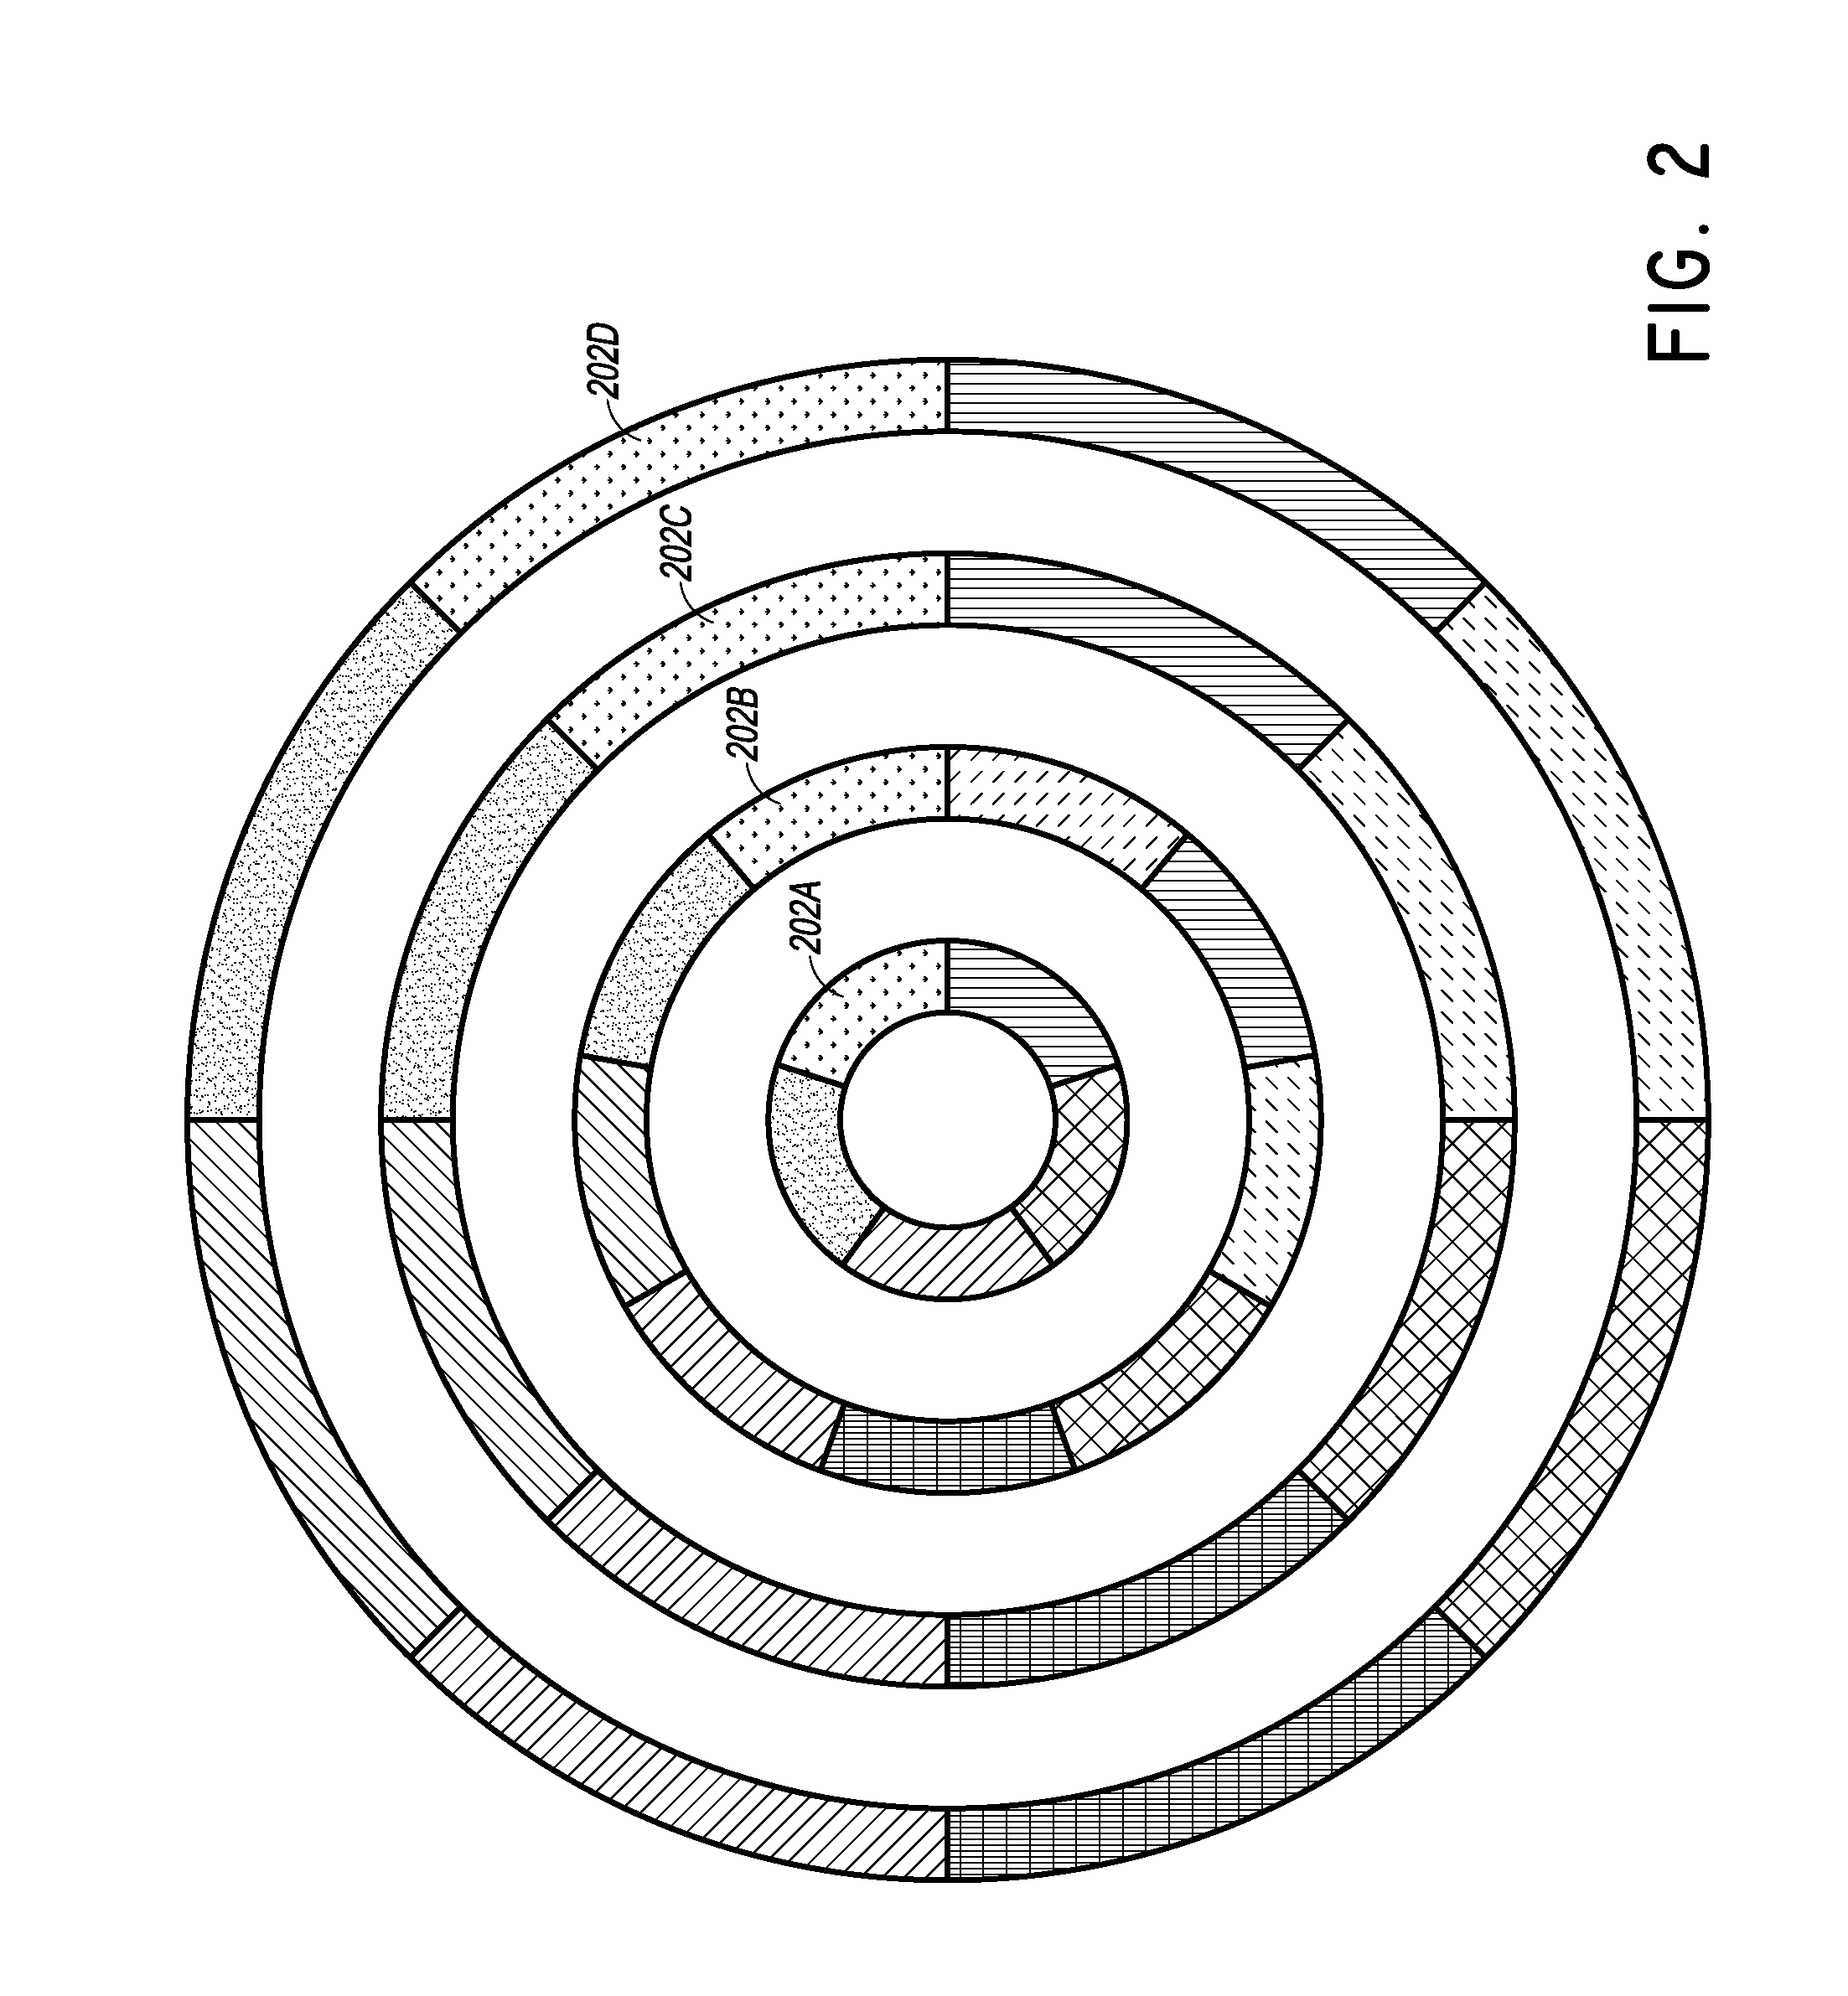
[0044]This disclosure relates to computing systems for representing multivariate data. As used herein, “multivariate data” refers to data involving two or more variables, such as a data involving three or more variables.

[0045]In at least one embodiment, such a computing system includes one or more computers, as described in greater detail below in relation to FIG. 20. The system can also include a network interface coupled to a data network for receiving and transmitting one or more packet flows comprising the multivariate data. The system can further comprise a computer processor and a computer readable storage medium storing program instructions for execution by the computer processor. Suitable computer readable media include non-transitory computer readable storage media.

[0046]The program instructions can cause the computer processor to generate a user interface. The user interface can be displayed on a computer display communicating directly or indirectly with the computing syst...


PUM


Abstract

Various systems, methods, and media allow for graphical display of multivariate data in parallel coordinate plots and similar plots for visualizing data for a plurality of variables simultaneously. These systems, methods, and media can aggregate individual data points into curves between axes, significantly improving functioning of computer systems by decreasing the rendering time for such plots. Certain implementations can allow a user to examine the relationship between two or more variables, by displaying the data on non-parallel or other transformed axes.

Description

BACKGROUND[0001]1. Field[0002]This disclosure relates to systems for visually presenting multivariate data on a graphical user interface and methods and computer-related media related thereto.[0003]2. Description of the Related Art[0004]Parallel coordinates is a visualization method for multivariate data sets. A parallel coordinates system arranges several dimensions as parallel axes next to each other in a plane and renders each data point in the multivariate data set as a line intersecting each of the axes. A parallel-coordinates plot provides an overview of the relations between the variables. A significant drawback of a parallel coordinates plot is the visual clutter that results for large data sets. Another drawback is “overplotting,” in which the lines representing the data points are plotted on top of each other, which can hamper the recognition of patterns in the data set.SUMMARY[0005]Disclosed herein are various systems, methods, and computer-readable media for plotting mul...

Claims


Application Information

Patent Timeline
IPC IPC(8): G06F3/0484G06F3/0481
CPCG06F3/04842G06F3/0481G06F3/04847G06Q30/02G06F16/904
Inventor SLAWINSKI, ALBERTSJOBERG, ANDREAS
Owner PALANTIR TECHNOLOGIES
Why Eureka
Try Eureka