Curve editing mechanism

a curvature and editing mechanism technology, applied in the field of curvature definition, can solve the problems of not being able to display the original material colour and generally being clumsy in the approach

Inactive Publication Date: 2017-09-28
FRENCH CIVIL AVIATION UNIVERSITY
View PDF2 Cites 0 Cited by
  • Summary
  • Abstract
  • Description
  • Claims
  • Application Information

AI Technical Summary

Benefits of technology

[0029]In accordance with a third aspect there is provided an apparatus for defining a continuous path, adapted to define a first path comprising a plurality of points, to define a second path comprising a plurality of points, and to move each point on said first path with respect to each point on the second path in a manner analo

Problems solved by technology

Since the resulting X-ray scanned image only contains voxel or pixel densities, it cannot display the original material colours.
A drawback of such approaches is that even a sma

Method used


Image

  • Curve editing mechanism
  • Curve editing mechanism
  • Curve editing mechanism

Examples


Embodiment Construction

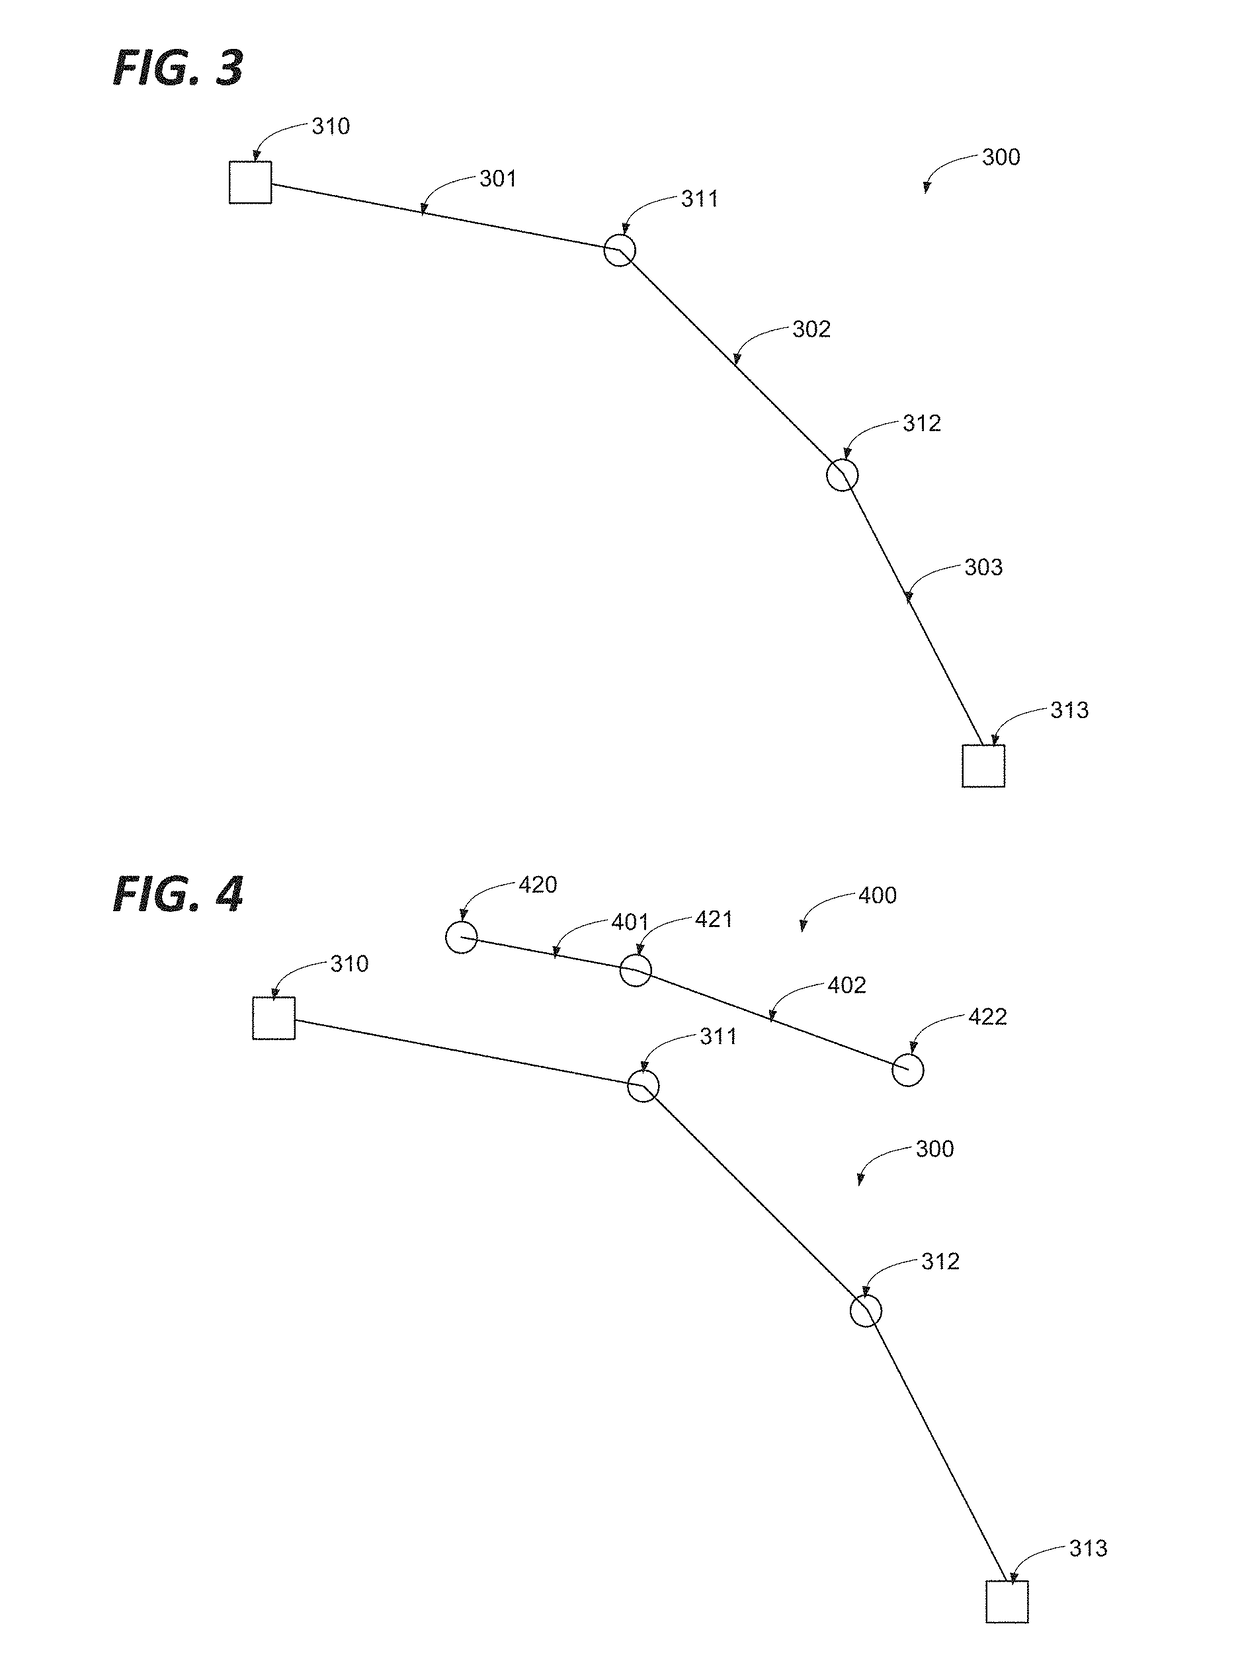
[0044]FIG. 3 shows a curve to which embodiments may be applied. As shown in FIG. 3 there is provided a curve 300, defined by three straight sections 301, 302, 303. Sections 301 and 302 intersect at point 311, and sections 302 and 303 intersect at point 312. Section 301 terminates at anchor point 310, and section 303 terminates at anchor point 313, so that the curve 300 itself also terminates at anchor points 310 and 313. This curve may represent a transfer curve as described above.

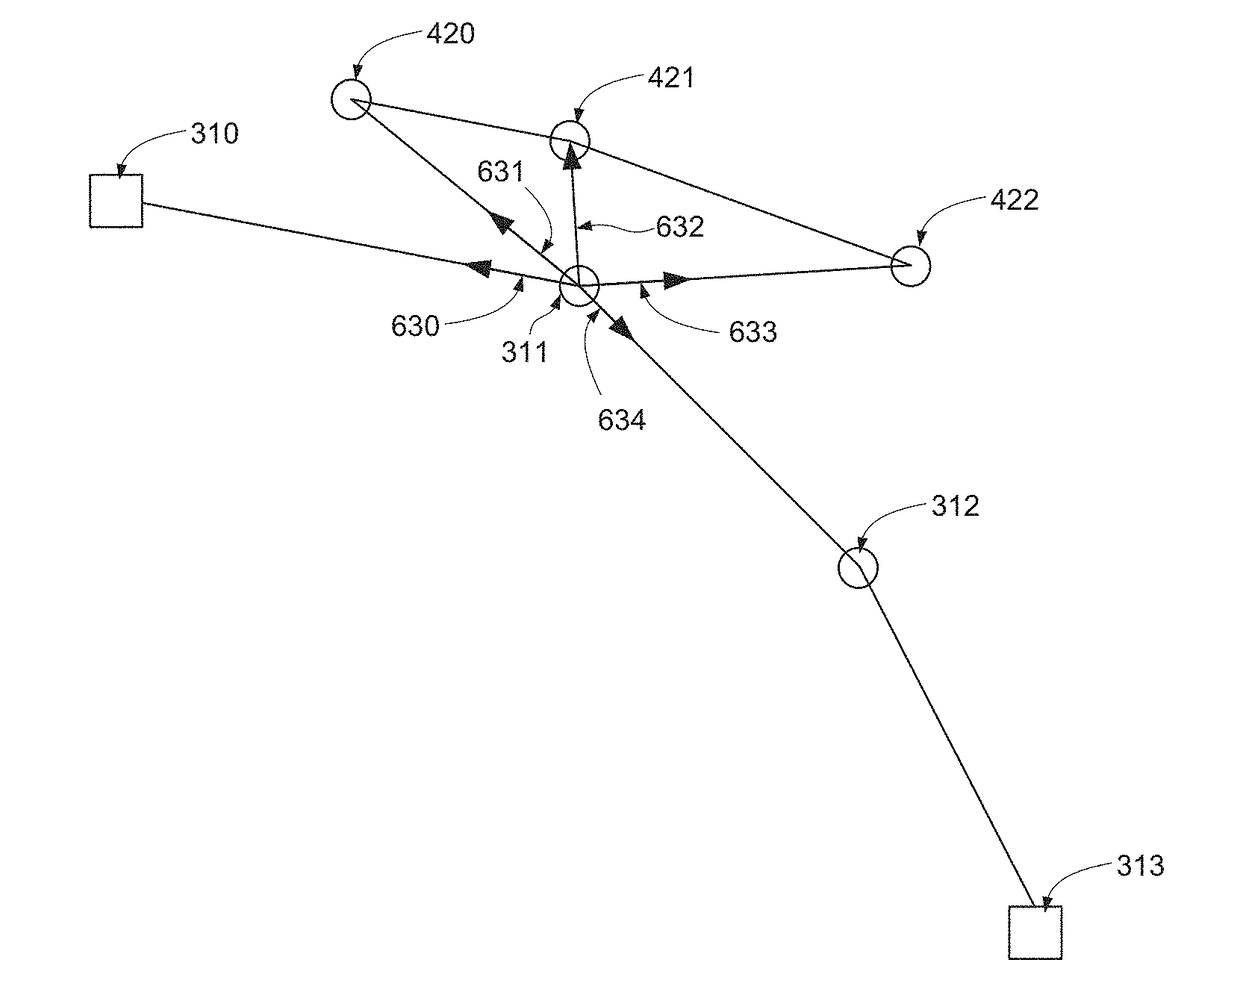
[0045]FIG. 4 shows a set of curves in accordance with an embodiment. As shown in FIG. 4 there is provided a curve 300 as described above, and a further curve 400 defined by two straight sections 401, 402. Sections 401 and 402 intersect at point 421. Section 401 terminates at point 420, and section 402 terminates at point 422, so that the curve 400 itself also terminates at anchor points 420 and 422. In accordance with embodiments as described hereafter, this second curve 400 may be the result of a user int...


PUM


Abstract

Datasets such as two dimensional raster images or three dimensional voxel based representations are often processed for representation using a transfer function defined by a curve. A mechanism for manually adjusting such curves is described, whereby a user adds a second curve. The transfer curve is recalculated so as to draw closer to the second curve. By drawing the second curve in the shape required for the transfer curve, and repeating this gesture as the transfer curve evolves, the user can subtly and interactively develop the transfer curve until the processed representation is exactly as required. The attractive effect of the points of the first curve on those of adjacent point on the first curve and on those of the second may be attractive or repellent, may vary in any manner as a function of distance, and in particular may imitate the effects of physical forces such as magnetic, elastic, etc.

Description

FIELD OF THE INVENTION[0001]The present invention relates to the definition of curves, and their use to manipulate data.BACKGROUND OF THE INVENTION[0002]FIG. 1 shows a histogram representing a dataset.[0003]As shown, the histogram comprises an x axis and two y axes 101 and 102. Arranged along the x axis area series of bars 110, 111, 112, 113, 114, 115, 116, 117.[0004]Histograms such as that shown in FIG. 1 are a common way to represent the content of a dataset, in a variety in different contexts. For example, the data may be a two dimensional image. In this context, the first ordinate axis 101 may represent a number of pixels, and the abscussa may reflect pixel intensity, so that each of the bars represents the number of pixels in the image in a particular intensity range.[0005]Another example may be the representation of a three dimensional volume, for example defined in terms of a collection of voxels, each having a characteristic density or opacity, such that the x axis may refle...

Claims


Application Information

Patent Timeline
IPC IPC(8): G06T11/20G06F3/01G06F17/30
CPCG06T11/203G06F3/011G06F17/30572G06T11/001G06T11/206G06F16/26
Inventor HURTER, CHRISTOPHE
Owner FRENCH CIVIL AVIATION UNIVERSITY
Why Eureka
Try Eureka