System and method for visualizing and analyzing cyber-attacks using a graph model

a graph model and graph model technology, applied in the field of security vulnerability analysis of cyber networks, can solve the problems of complex networks, insufficient visualization, and simple detection of network intrusions, and achieve the effect of maintaining mission readiness

Active Publication Date: 2017-10-05
MITRE SPORTS INT LTD
View PDF13 Cites 88 Cited by
  • Summary
  • Abstract
  • Description
  • Claims
  • Application Information

AI Technical Summary

Benefits of technology

[0005]Accordingly, a system and method for visualizing and analyzing network vulnerabilities and cyber-attacks is provided. The system described herein can bring together isolated data and events into an ongoing overall picture for decision support and situational awareness. The system and method can prioritize exposed vulnerabilities, mapped to potential threats in the context of mission-critical assets. In response to actual attacks, the system can correlate intrusion alerts to known vulnerability paths and suggest best courses of action for responding to attacks for maintaining mission readiness. For post-attack forensics, the system and method can determine vulnerable paths that may warrant extra scrutiny by security analysts.

Problems solved by technology

Enterprise computing networks, in which a particular organization employs numerous computing devices that can communicate with one another and share data, are often complex.
Often times, simply detecting a network intrusion may not be sufficient to effectively understand and visualize how the purported attack may impact a computer network and the organizational mission functions that depend on continued network operations.
Often times, the obstacle to completely analyzing a computer network for vulnerabilities may not be due to a lack of information, but rather the ability to assemble disparate pieces of information into an overall analytic picture for situational awareness, optimal courses of action, and maintaining mission readiness.
Security analysts and operators can be overwhelmed by a variety of consoles from multiple security analysis tools, with each tool providing only a limited view of one aspect of the overall space under consideration.

Method used


Image

  • System and method for visualizing and analyzing cyber-attacks using a graph model
  • System and method for visualizing and analyzing cyber-attacks using a graph model
  • System and method for visualizing and analyzing cyber-attacks using a graph model

Examples


Embodiment Construction

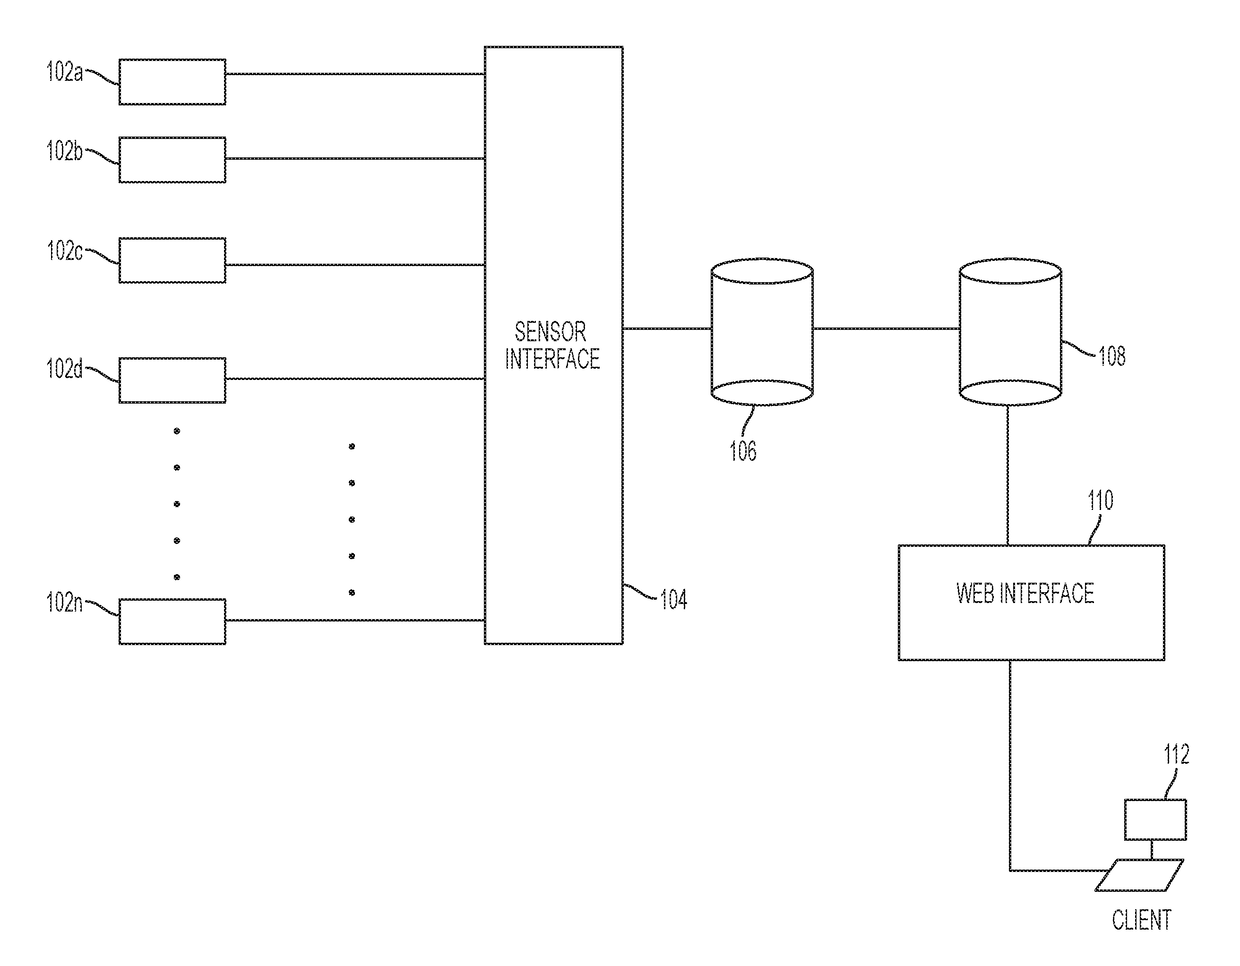
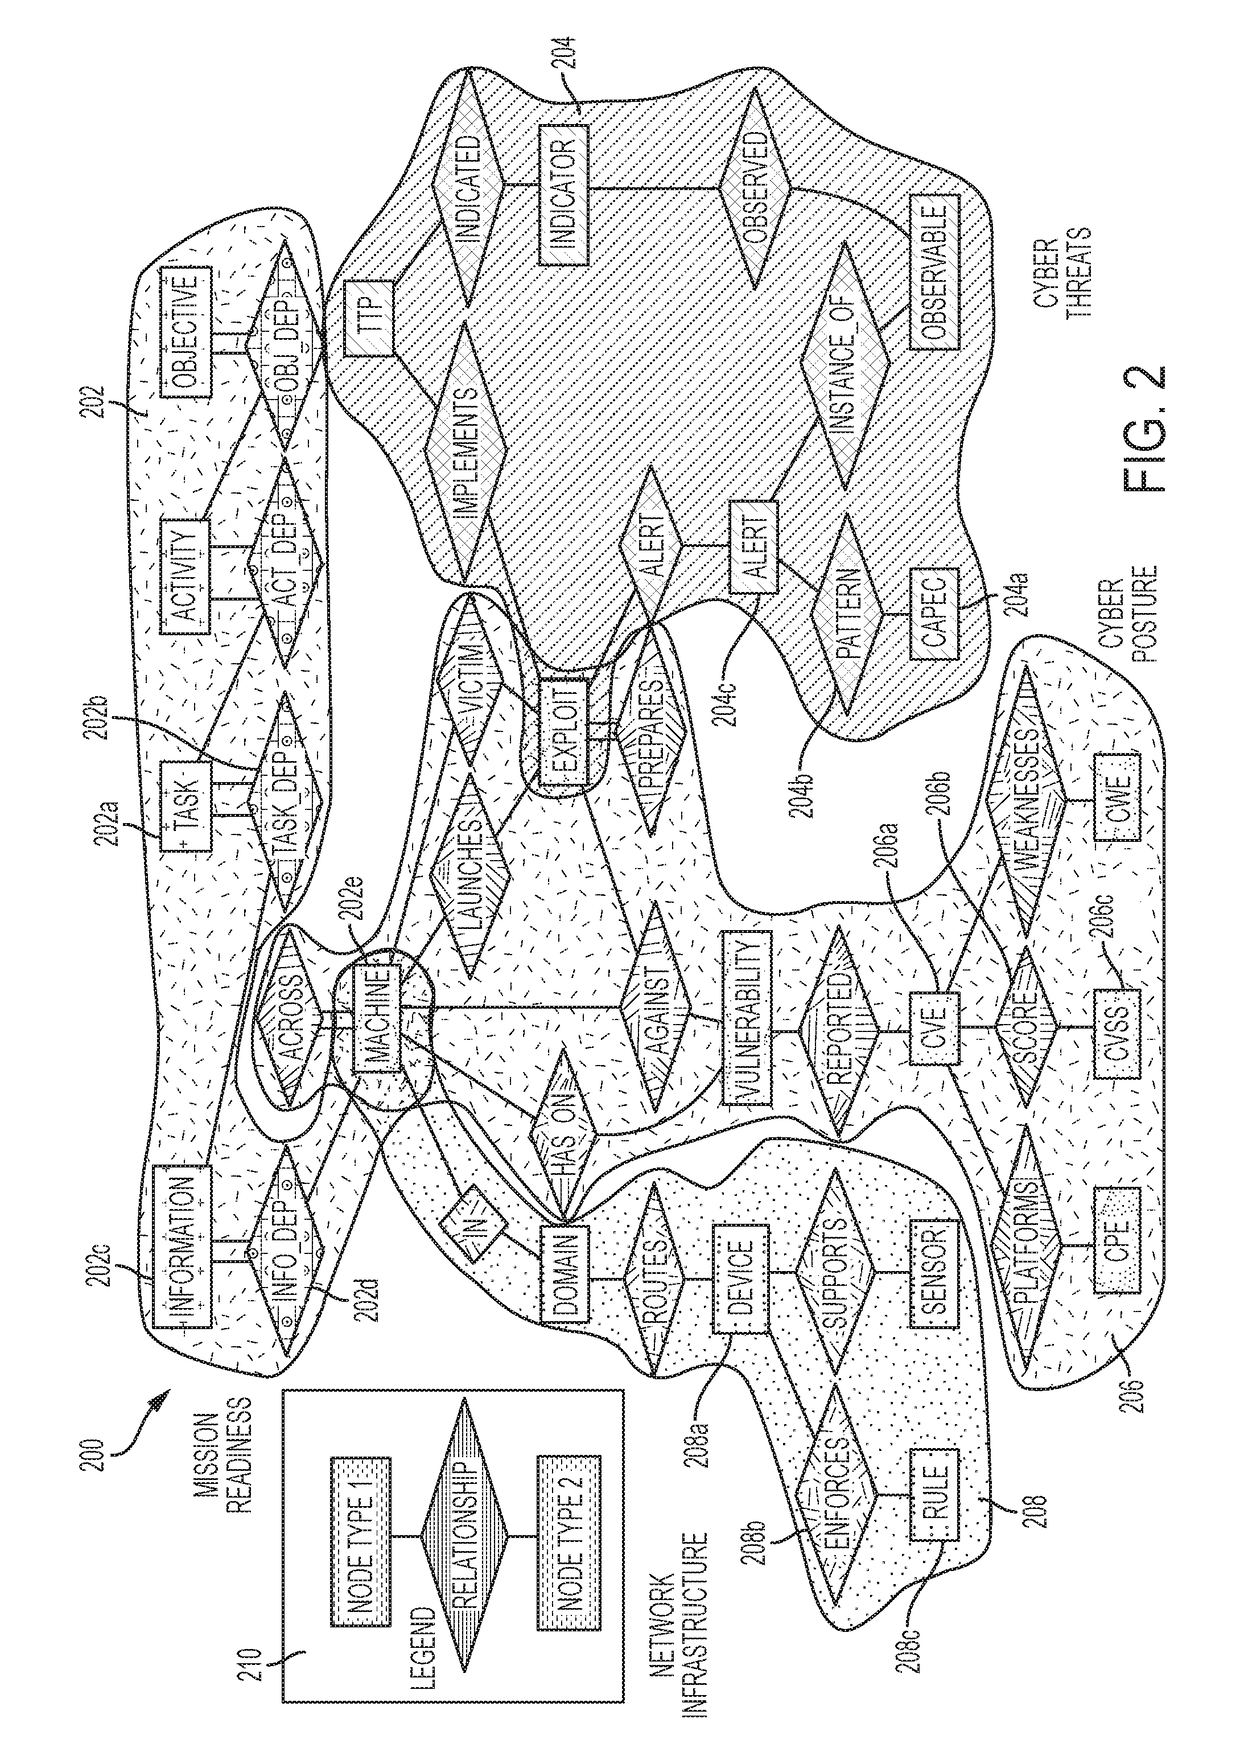
[0018]Described herein are systems and methods for visualizing and analyzing computer network vulnerabilities that employ a graph database to effectively monitor and assess security threats to a computing infrastructure in real-time. The systems and methods described herein can be used to synthesize information from disparate and varied sources to create an overall visualization of the security posture of a particular computing network.

[0019]The system and methods can employ a plurality of sensors designed to provide real-time information about the state of the computer network and integrate the data from the sensors into a graph database that can allow a user of the system to visualize attack pattern relationships, highlight exposed vulnerabilities of the network, provide mission impact analysis, and provide cyber-security modeling and simulation capabilities, among other services.

[0020]FIG. 1 illustrates an exemplary cyber-security analysis system architecture according to example...


PUM


Abstract

A system and method for implementing a graph database to analyze and monitor a status of an enterprise computer network is provided. In one example, a plurality of sensors can be inputted into sensor interface in which all of the data associated with the sensors in converted into a common data format. The data can be parsed into a data model that contains nodes and edges in order to generate a graph database model that can allow a network analyst to analyze the real-time status of a computer network. The graph database model can include multiple layers including an infrastructure layer, a cyber threats layer, a cyber posture layer, and a mission readiness layer. The graph database model can also be queried by a user using a domain-specific query language, so as to provide a user-friendly syntax in generating queries.

Description

FIELD OF THE DISCLOSURE[0001]The present disclosure relates to the security vulnerability analysis of cyber networks. More specifically, the present disclosure relates to systems and methods for modeling a computer network and the impacts of a cyber-attack upon the computer network utilizing graph database techniques that can allow a security analyst to robustly analyze and visualize threats to a computer network and the potential impacts those threats can have upon the network and organizational mission functions.BACKGROUND OF THE DISCLOSURE[0002]Enterprise computing networks, in which a particular organization employs numerous computing devices that can communicate with one another and share data, are often complex. Adding to this complexity can be the fact that computer networks can constantly change, with machines added and removed, patches applied, applications installed, firewall rules changed, etc. Changes to the network can have substantial impacts on the security posture of...

Claims


Application Information

Patent Timeline
Patent Type & Authority Applications(United States)
IPC IPC(8): H04L29/06G06F17/30
CPCH04L63/1433H04L63/145G06F17/30867G06F17/30569G06F17/30427G06F17/30958H04L67/12G06F21/577G06F2221/034G06F16/28G06F16/9024H04L67/565H04L67/01
Inventor NOEL, STEVENHARLEY, ERICTAM, KAM HIMLIMIERO, MICHAELSHARE, MATTHEW
Owner MITRE SPORTS INT LTD
Why Eureka
Try Eureka