State generation system for a sequential stage application

a technology of state generation and sequential stage, applied in the field of state generation system for sequential stage application, can solve the problems of identifying bottlenecks, requiring the most processing time, and a cost for the stage to improve,

Active Publication Date: 2019-12-05
CHICAGO MERCANTILE EXCHANGE INC
View PDF0 Cites 0 Cited by
  • Summary
  • Abstract
  • Description
  • Claims
  • Application Information

AI Technical Summary

Benefits of technology

[0185]The Multi-Stage View enables the developer to easily visually identify which stage is acting as a bottleneck for an application. In an embodiment, a stage may be considered to be a bottleneck if its average latency is greater than the inter-arrival rate of messages into that stage. In one embodiment, any stage whose latency midpoint (e.g., corresponding to peak 1102 in FIG. 11) is greater than the maximum of the inter-arrival rate plus a prior stage's upper bound may be highlighted (e.g., the portion of stage 3 in FIG. 6 above 87 microseconds could be highlighted) to indicate that this particular stage is incurring a queue, as inputs are arriving at a rate faster than they can be processed, and therefore is a bottleneck. A developer analyzing the performance of the application depicted in Multi-Stage View 600 can determine that messages must wait before entering stage 3, and therefore should spend resources, e.g., time and / or computer resources, to improve the performance of stage 3 of the application. The developer could also easily determine that for the state illustrated in FIG. 6, spending time / computing resources to minimize stage 1 would have minimal, if not zero, impact on the overall application response time.
[0218]By reallocating computing hardware and software resources, the disclosed embodiments allow a developer to not only determine which stages should be prioritized / optimized first, the disclosed embodiments actually optimize or tailor the use of available, finite resources for each stage.

Problems solved by technology

Any latency improvement to a stage may come at a cost, namely, the amount of time and computing resources required to cause such latency improvement.
The amount of performance improvement achieved, and the efforts / costs for achieving such improvement, is a tradeoff.
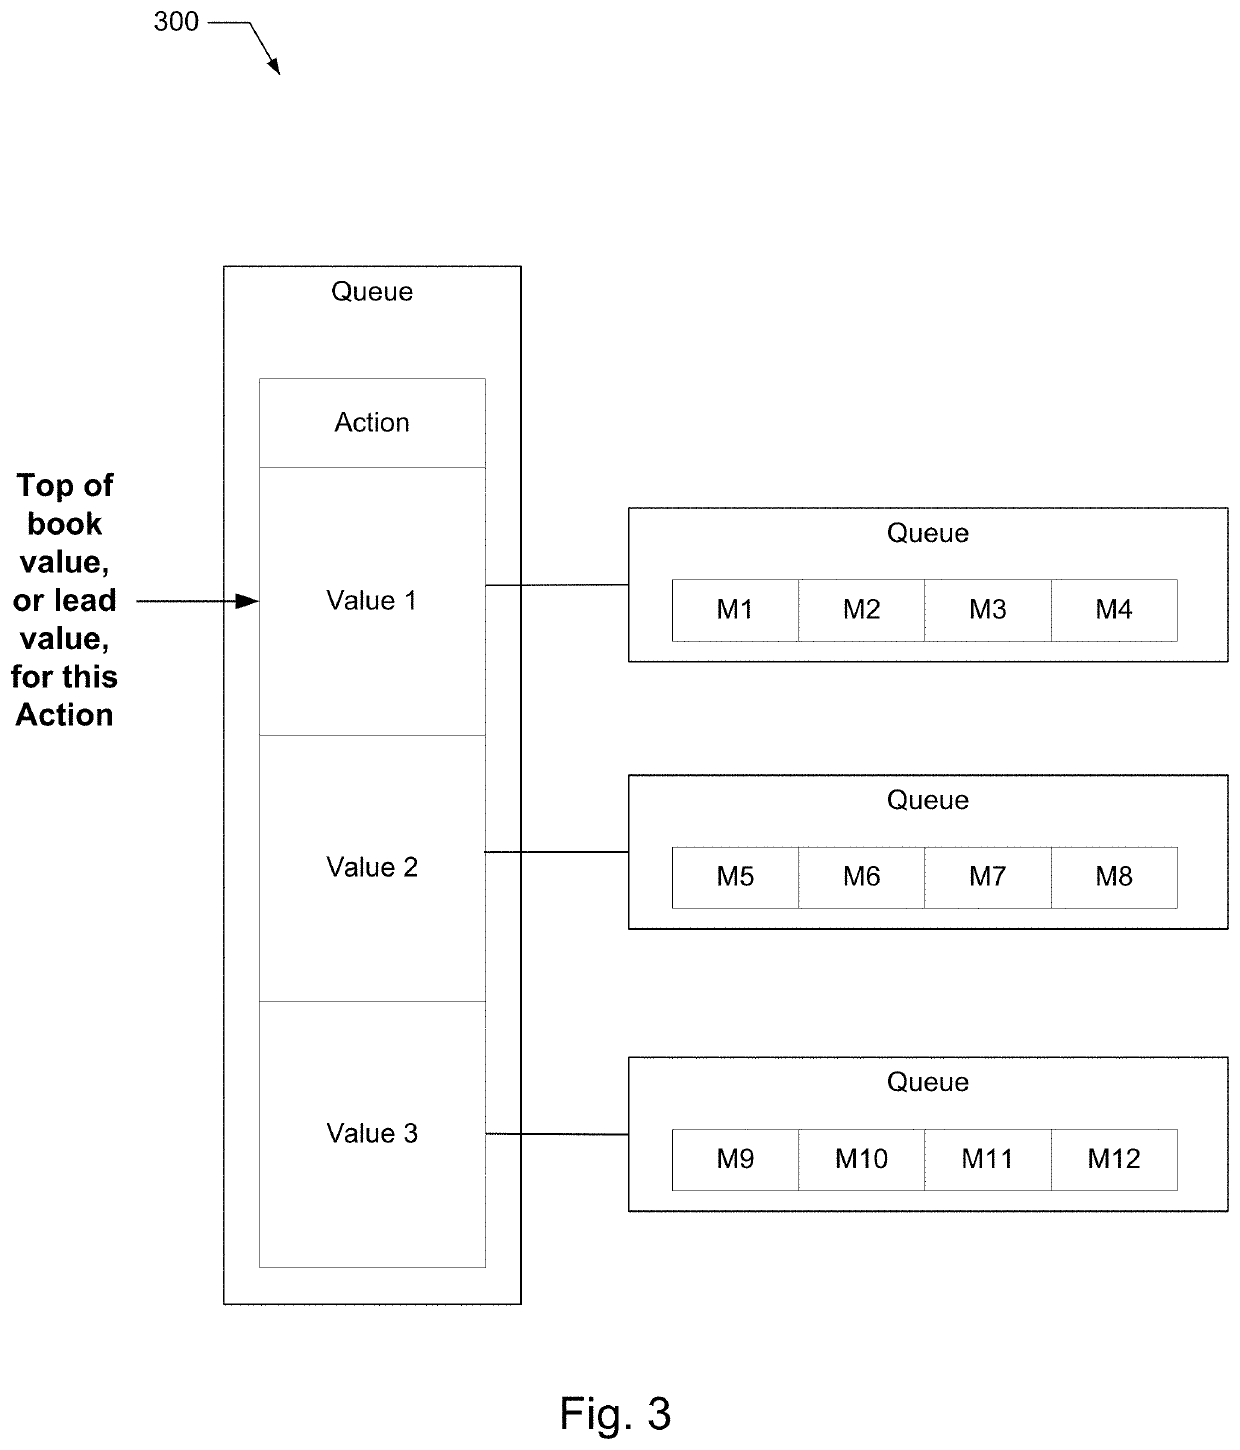
Any time a message waits in a queue could be considered unnecessary and the reason for a bottleneck.
A stage that requires the most processing time may be considered a bottleneck.
Because the complex application includes multiple different stages and because the application receives messages at a varying / dynamic rate, identifying bottlenecks (however a bottleneck may be defined for that application) becomes difficult.
In many cases, even if a bottleneck is identified, improving the performance of a stage identified to be a bottleneck may not cause an appreciable improvement on the overall application performance time.
In such cases, the time, money, and computing resources spent to reduce the message processing latency of the bottleneck stage could be considered wasted.
However, latency predication systems for a multiple sequential stage application where the latency of each stage can vary, and where the inter-arrival rate into the application, as well as into each of the stages, can vary, can be difficult for a user to use because each of the variables (e.g., latency for each stage, inter-arrival rate into the application) needs to be specified by the user.
And, the effects of a simulated system state can also be difficult for the user to understand or effectively use for application optimization because simply indicating to the user the estimated latency of a new simulated state does not impart any information about comparing the benefits of one simulated state versus another simulated state.
For example, optimizing for multiple variables is complex and makes finding the overall optimal solution difficult.
Textual inputs defining the state of the system (which can then be input into a latency prediction system) do not clearly or easily convey the interaction and relationships between stages in a multiple sequential stage application and cannot clearly show which stages act as bottlenecks.
Additionally, the number of fields requiring manual data entry would make the interface complex and prone to user error.
Combining the stage latencies results in an overall application latency.
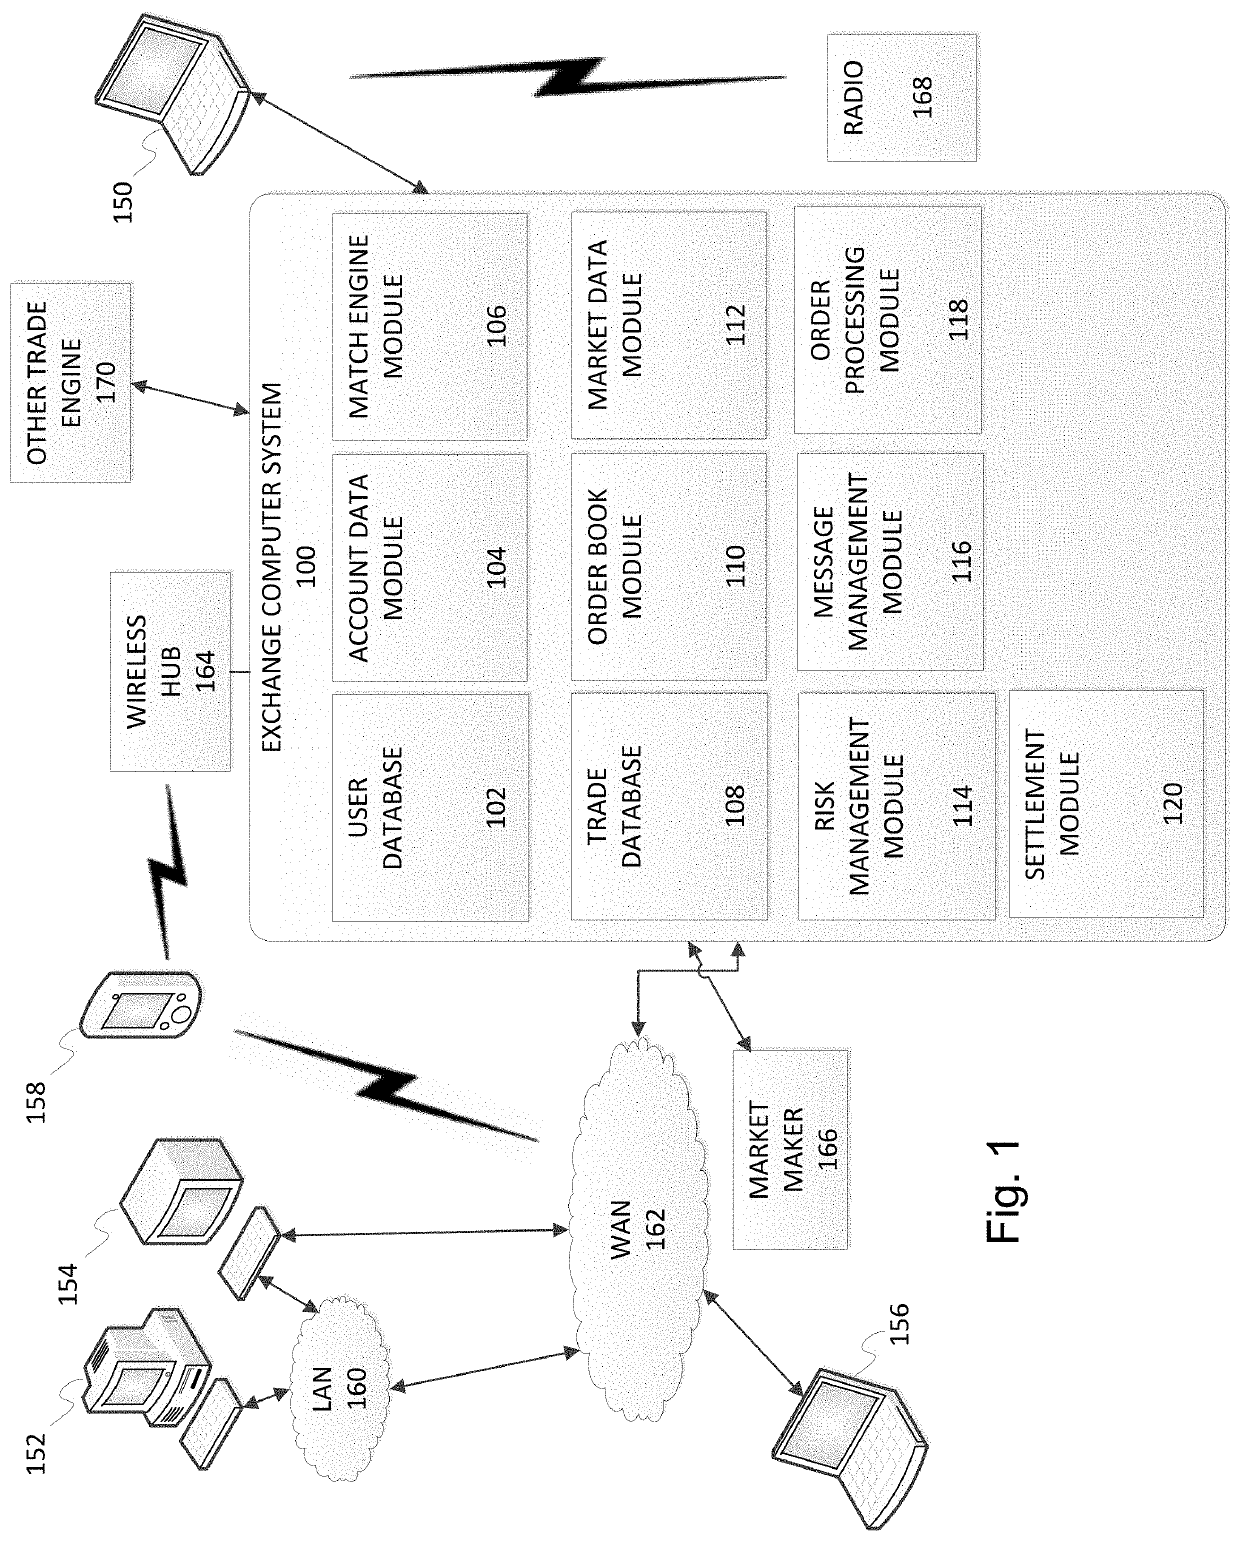
In addition, it may be appreciated that electronic trading systems further impose additional expectations and demands by market participants as to transaction processing speed, latency, capacity, and response time, while creating additional complexities relating thereto.
In those markets, the failure of one participant can have a ripple effect on the solvency of the other participants.
Conversely, CME's mark-to-the-market system does not allow losses to accumulate over time or allow a market participant the opportunity to defer losses associated with market positions.
As an intermediary to electronic trading transactions, the exchange bears a certain amount of risk in each transaction that takes place.
This may result in penalizing the trader who makes an errant trade, or whose underlying trading motivations have changed, and who cannot otherwise modify or cancel their order faster than other traders can submit trades there against.
Furthermore, while it may be beneficial to give priority to a trader who is first to place an order at a given price because that trader is, in effect, taking a risk, the longer that the trader's order rests, the less beneficial it may be.
However, a trader who took a risk by being first to place an order (a “market turning” order) at a price may end up having to share an incoming order with a much later submitted order.
This results in an escalation of quantities on the order book and exposes a trader to a risk that someone may trade against one of these orders and subject the trader to a larger trade than they intended.
In the typical case, once an incoming order is allocated against these large resting orders, the traders subsequently cancel the remaining resting quantity which may frustrate other traders.
If any one of the queues or components of the transaction processing system experiences a delay, that creates a backlog for the structures preceding the delayed structure.
For example, if the match or transaction component is undergoing a high processing volume, and if the pre-match or pre-transaction queue is full of messages waiting to enter the match or transaction component, the conversion component may not be able to add any more messages to the pre-match or pre-transaction queue.
Most message processing latencies cluster around an average message processing latency, but some messages are outliers and may require much less or much more time than usual.
The simulated application latency may vary as the number of simulated messages increases, because as more messages are processed, the likelihood that queues build up increases.
If the latency prediction system only simulates one message going through / being processed by all of the stages, the latency prediction system will not predict the buildup of a queue.
But, if the latency prediction system simulates 100 messages going through the application, some of the later messages may need to wait in a queue, which would result in a longer application response time.
Text inputs into and outputs out of a latency prediction system would not convey the relationships between the different stages and would be cumbersome to use.
Moreover, a text-based interface (without the visual presentation of the Multi-Stage View) would be complicated, and prone to user error due to increased data entry via a keyboard.
Even if all of the other stages are optimized, in some applications, a stage 1 bottleneck may cause a large delay that can only be fixed by addressing the message processing latency of stage 1.
The amount of resources allocated to an application stage affects that stage's message processing latency.
Additionally, the illustrations are merely representational and may not be drawn to scale.

Method used


Image

  • State generation system for a sequential stage application
  • State generation system for a sequential stage application
  • State generation system for a sequential stage application

Examples


example users

[0117]Generally, a market may involve market makers, such as market participants who consistently provide bids and / or offers at specific prices in a manner typically conducive to balancing risk, and market takers who may be willing to execute transactions at prevailing bids or offers may be characterized by more aggressive actions so as to maintain risk and / or exposure as a speculative investment strategy. From an alternate perspective, a market maker may be considered a market participant who places an order to sell at a price at which there is not a previously or concurrently provided counter order. Similarly, a market taker may be considered a market participant who places an order to buy at a price at which there is a previously or concurrently provided counter order. A balanced and efficient market may involve both market makers and market takers, coexisting in a mutually beneficial basis. The mutual existence, when functioning properly, may facilitate liquidity in the market s...


PUM


Abstract

A computer implemented method includes collecting, at a memory of a computing device having a processor, message processing latency information about processing electronic data transaction request messages over a timeframe by an application including a plurality of sequential stages; presenting, in a graphical user interface (GUI) rendered on a display coupled to the computing device, a digital dashboard, the digital dashboard displaying: for each stage, a stage box representing the stage positioned on a y-axis so as to represent a message processing latency associated with the stage over the timeframe; an inter-arrival message rate line positioned on the y-axis so as to represent an arrival rate between the electronic data transaction request messages over the timeframe; and an application box representing the application positioned on the y-axis so as to represent a message processing latency associated with the application over the timeframe; and in response to detecting a re-positioning of a stage box or the inter-arrival message rate line, displaying, on the digital dashboard, the application box at a different position associated with an expected message processing latency.

Description

CROSS REFERENCE TO RELATED APPLICATIONS[0001]This application is a continuation under 37 C.F.R. § 1.53(b) of U.S. patent application Ser. No. 15 / 813,968 filed Nov. 15, 2017 now U.S. Pat. No. ______, the entire disclosure of which is incorporated by reference in its entirety and relied upon.BACKGROUND[0002]Software applications have become indispensable in the modern world, and many of the world's biggest corporations rely on complex software applications to quickly and efficiently perform critical tasks. Many software applications include different stages, which may be different functions or processes executed by the software application code. Some software applications process or operate on a high volume of messages, e.g., millions of messages, with sub-microsecond response time. Software applications that process high message volumes may be characterized by a message processing latency, which may reflect the amount of time necessary to process or execute each message. In high-spee...

Claims


Application Information

Patent Timeline
Patent Type & Authority Applications(United States)
IPC IPC(8): H04L12/26G06F3/0484
CPCH04L43/067G06F3/0484H04L43/12H04L43/0852G06F9/5027G06F9/546G06Q40/04G06Q40/06G06Q40/08G06F2209/508
Inventor KAVANAGH, KYLE DENNISACUÑA-ROHTER, JOSÉ ANTONIO
Owner CHICAGO MERCANTILE EXCHANGE INC
Why Eureka
Try Eureka