Graphic-information flow method and system for visually analyzing patterns and relationships

Inactive Publication Date: 2001-10-23
CEDAR LANE TECH INC
View PDF6 Cites 447 Cited by
  • Summary
  • Abstract
  • Description
  • Claims
  • Application Information

AI Technical Summary

Benefits of technology

It is an object of the present invention to provide an interactive data flow and di

Problems solved by technology

Paper drawings and maps are representations of the real world; but often the viewer must struggle to see only what is relevant amidst too much information.
Transparent overlays can separate graphic information, but are cumbersome and restrictive.
However, they have not as yet enabled viewers to smoothly call forth sets of graphic data to inform and stimulate a sustained, multi-faceted, analytical thought process.
However, non-technicians--the public, executives, and experts in non-computer fields--cannot use them to easily access and manipulate selections of layered materials.
Nor can they easily create or assemble their own sets of interactive, layered data.
Drop-down menus, graphics tools, and palettes are used for customized map production; this slow, unwieldy process is of very limited use for multi-faceted analysis.
However, current GIS does not provide for seamless access to subset combinations from extensive data sets.
In some cases, entire themes may be shown or hidden by clicking a check box next to the theme title on the legend; however, a particular subset within a theme cannot be shown or hidden.
Current online GIS interfaces rely on the scrolling of palette scroll bars to extend the legend and to view selections for queries; this scrolling breaks the flow of data sele

Method used


Image

  • Graphic-information flow method and system for visually analyzing patterns and relationships
  • Graphic-information flow method and system for visually analyzing patterns and relationships
  • Graphic-information flow method and system for visually analyzing patterns and relationships

Examples


Example

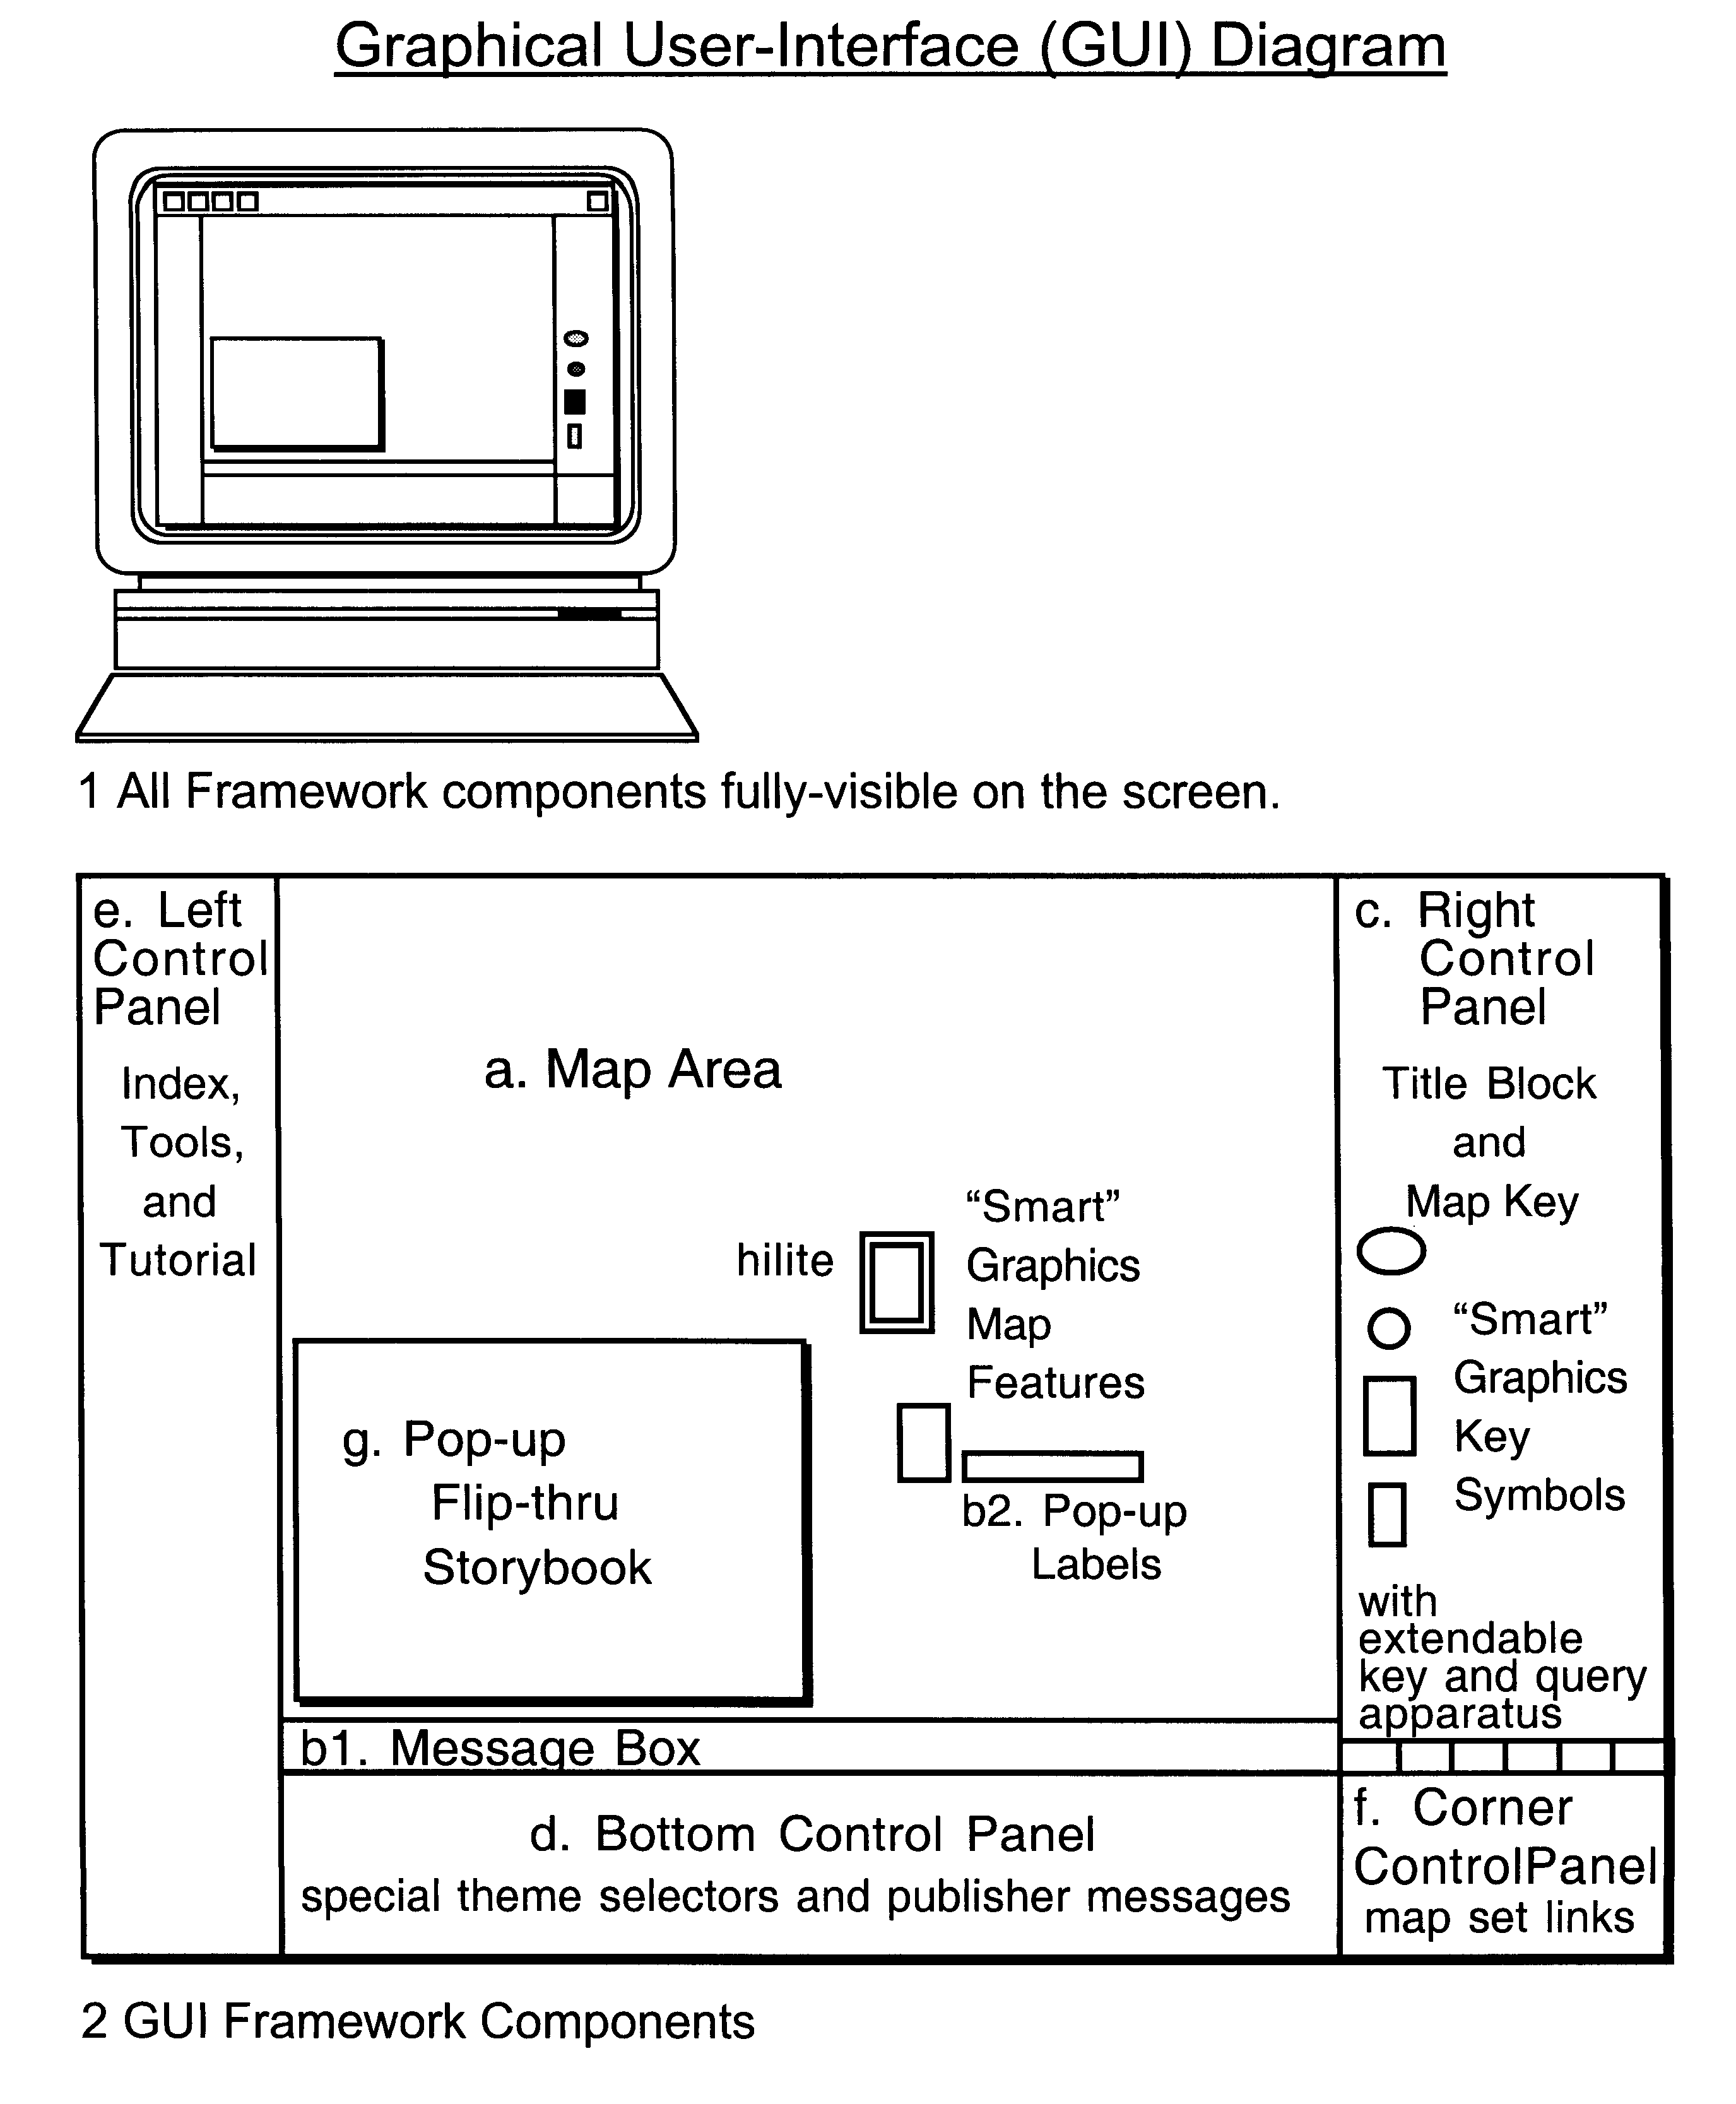
An exemplar GUI (Graphical User-Interface) layout and its components shown in FIG. 6a is designed to organize information from an extensive, complex data set. The special control apparatus maximize ease in retrieving subsets from the database. The navigation to the desired map can be accomplished via an optional index, 1-4, on the left by clicking on bar segments and list items. Retrieval Bar, 1, for switching categories of mapsets and Retrieval Bar, 2, for switching subcategories of mapsets call forth clickable lists of mapsets, 3, within the selected category and subcategory. The example shows a list organized in alphabetical order. Retrieval Bar, 4, is used for calling forth additional list information. The hilited segment designates the portion of the list that is displayed; clicking another letter calls up the portion of the list starting with that letter. Clicking on a map name in the list brings its base map into the Map Area. Orientation and navigation within a set of maps i...


PUM


Abstract

A novel display control and information management system seamlessly integrates layered and slotted formatted data from both local and remote sources to provide a highly versatile information display. The system permits selective control of display so that complex data and data flows can be seamlessly accessed with enhanced cognition of salient information by the User.

Description

The invention generally relates to computer controlled graphic display systems. More specifically, the present invention provides systems and software for organizing and configuring large, complex sets of graphic information for quick access and in-depth analytical study. The invention enables the integration of information from many sources for viewing in a layered and slotted, interactive map format.Throughout the ages, humans have devised ways to record, then examine, their thoughts and mental images on paper. People draw depictions of events, places, projects, and sets of objects. They chart scientific processes, demographics, weather conditions, and mechanical systems; and they diagram organizations, trade routes, music, and inventions. These drawings aid both the originator and subsequent audiences in picturing spatial or symbolic relationships. Paper drawings and maps are representations of the real world; but often the viewer must struggle to see only what is relevant amidst...

Claims


Application Information

Patent Timeline
IPC IPC(8): G06F17/30
CPCG06F17/30241G06F17/30994G06Q30/0641G06F3/0483Y10S715/968G06F16/904G06F16/29
Inventor BARROS, BARBARA L.
Owner CEDAR LANE TECH INC
Why Eureka
Try Eureka