Metastability risk simulation analysis tool and method

a metastability and risk technology, applied in the direction of instruments, program control, cad circuit design, etc., can solve the problems of metastability risk and metastability risk

Inactive Publication Date: 2002-06-18
BELL SEMICON LLC
View PDF7 Cites 32 Cited by
  • Summary
  • Abstract
  • Description
  • Claims
  • Application Information

AI Technical Summary

Benefits of technology

It is an object of the present invention to provide an apparatus and method

Problems solved by technology

Desirably, the computer readable code is configured to determine whether two signals, such as a data signal and a clock signal of a synchronous element of the design, cross over each

Method used


Image

  • Metastability risk simulation analysis tool and method
  • Metastability risk simulation analysis tool and method
  • Metastability risk simulation analysis tool and method

Examples


Embodiment Construction

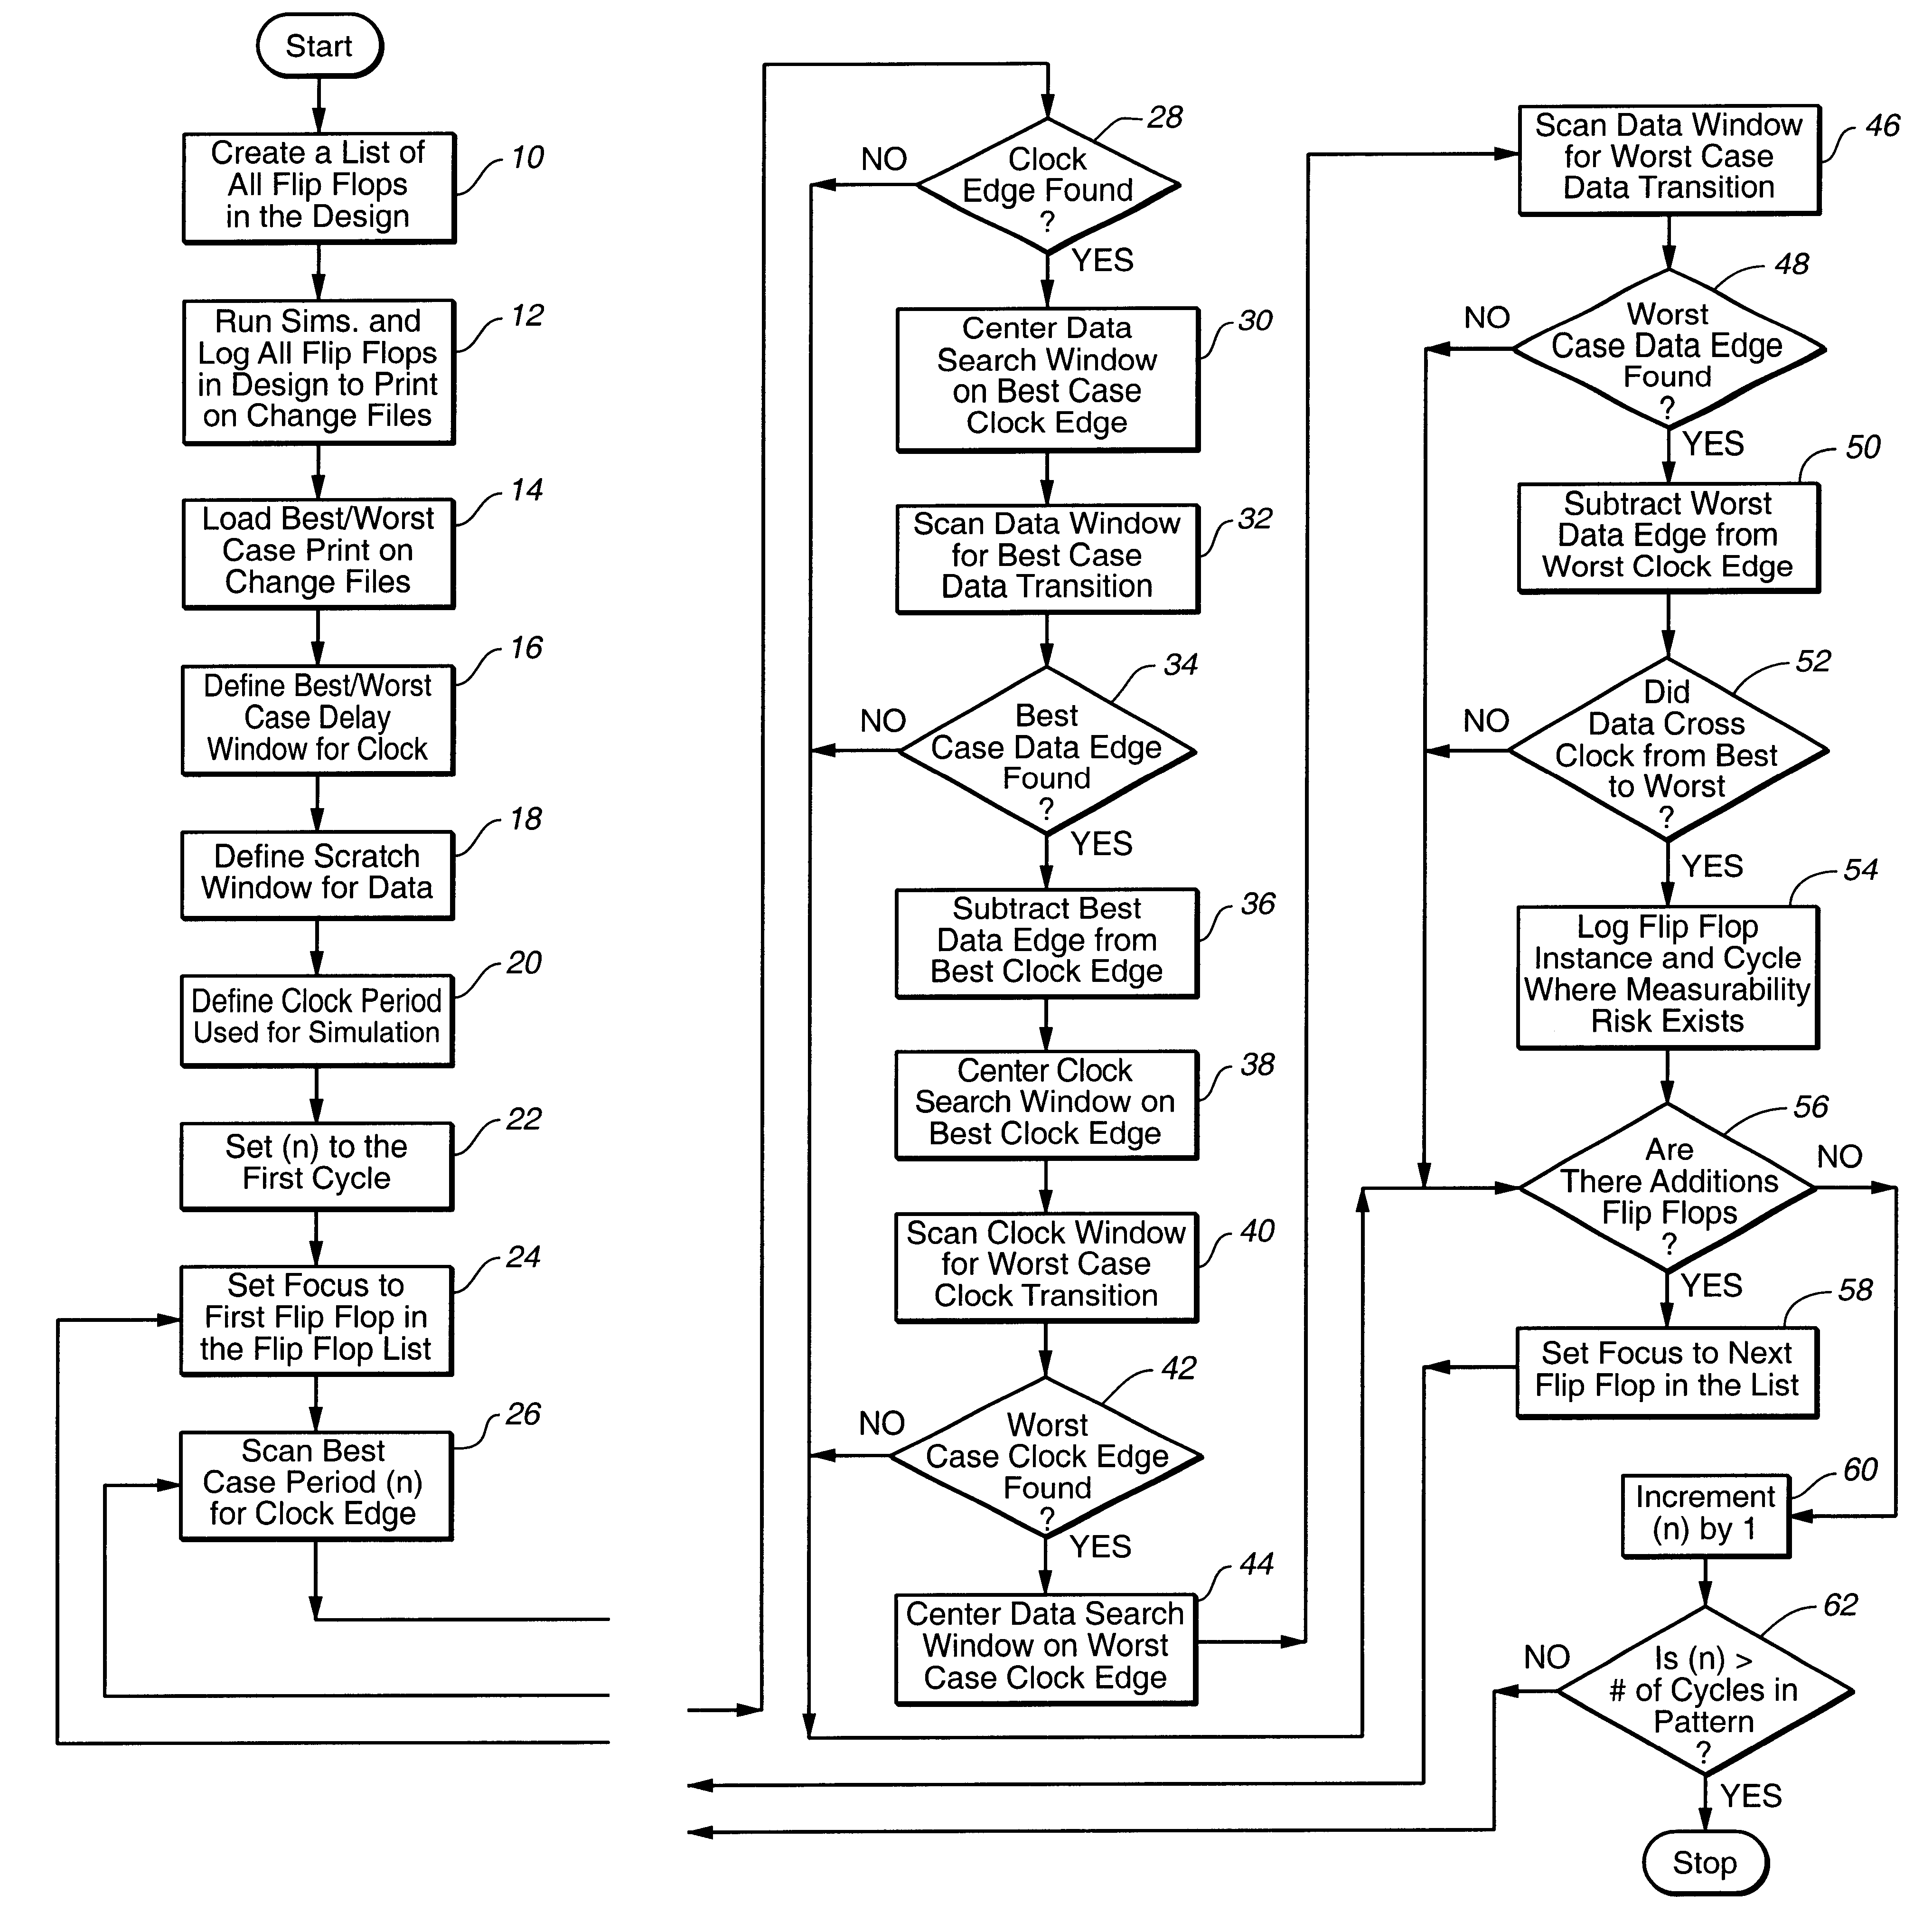
One or more simulations may be performed on a design to ensure that the transitions of signals relating the synchronous elements of the design are acceptable. The simulations produce certain data files, commonly referred to as "print on change files", which subsequently may be examined to determine whether the signal transitions are acceptable.

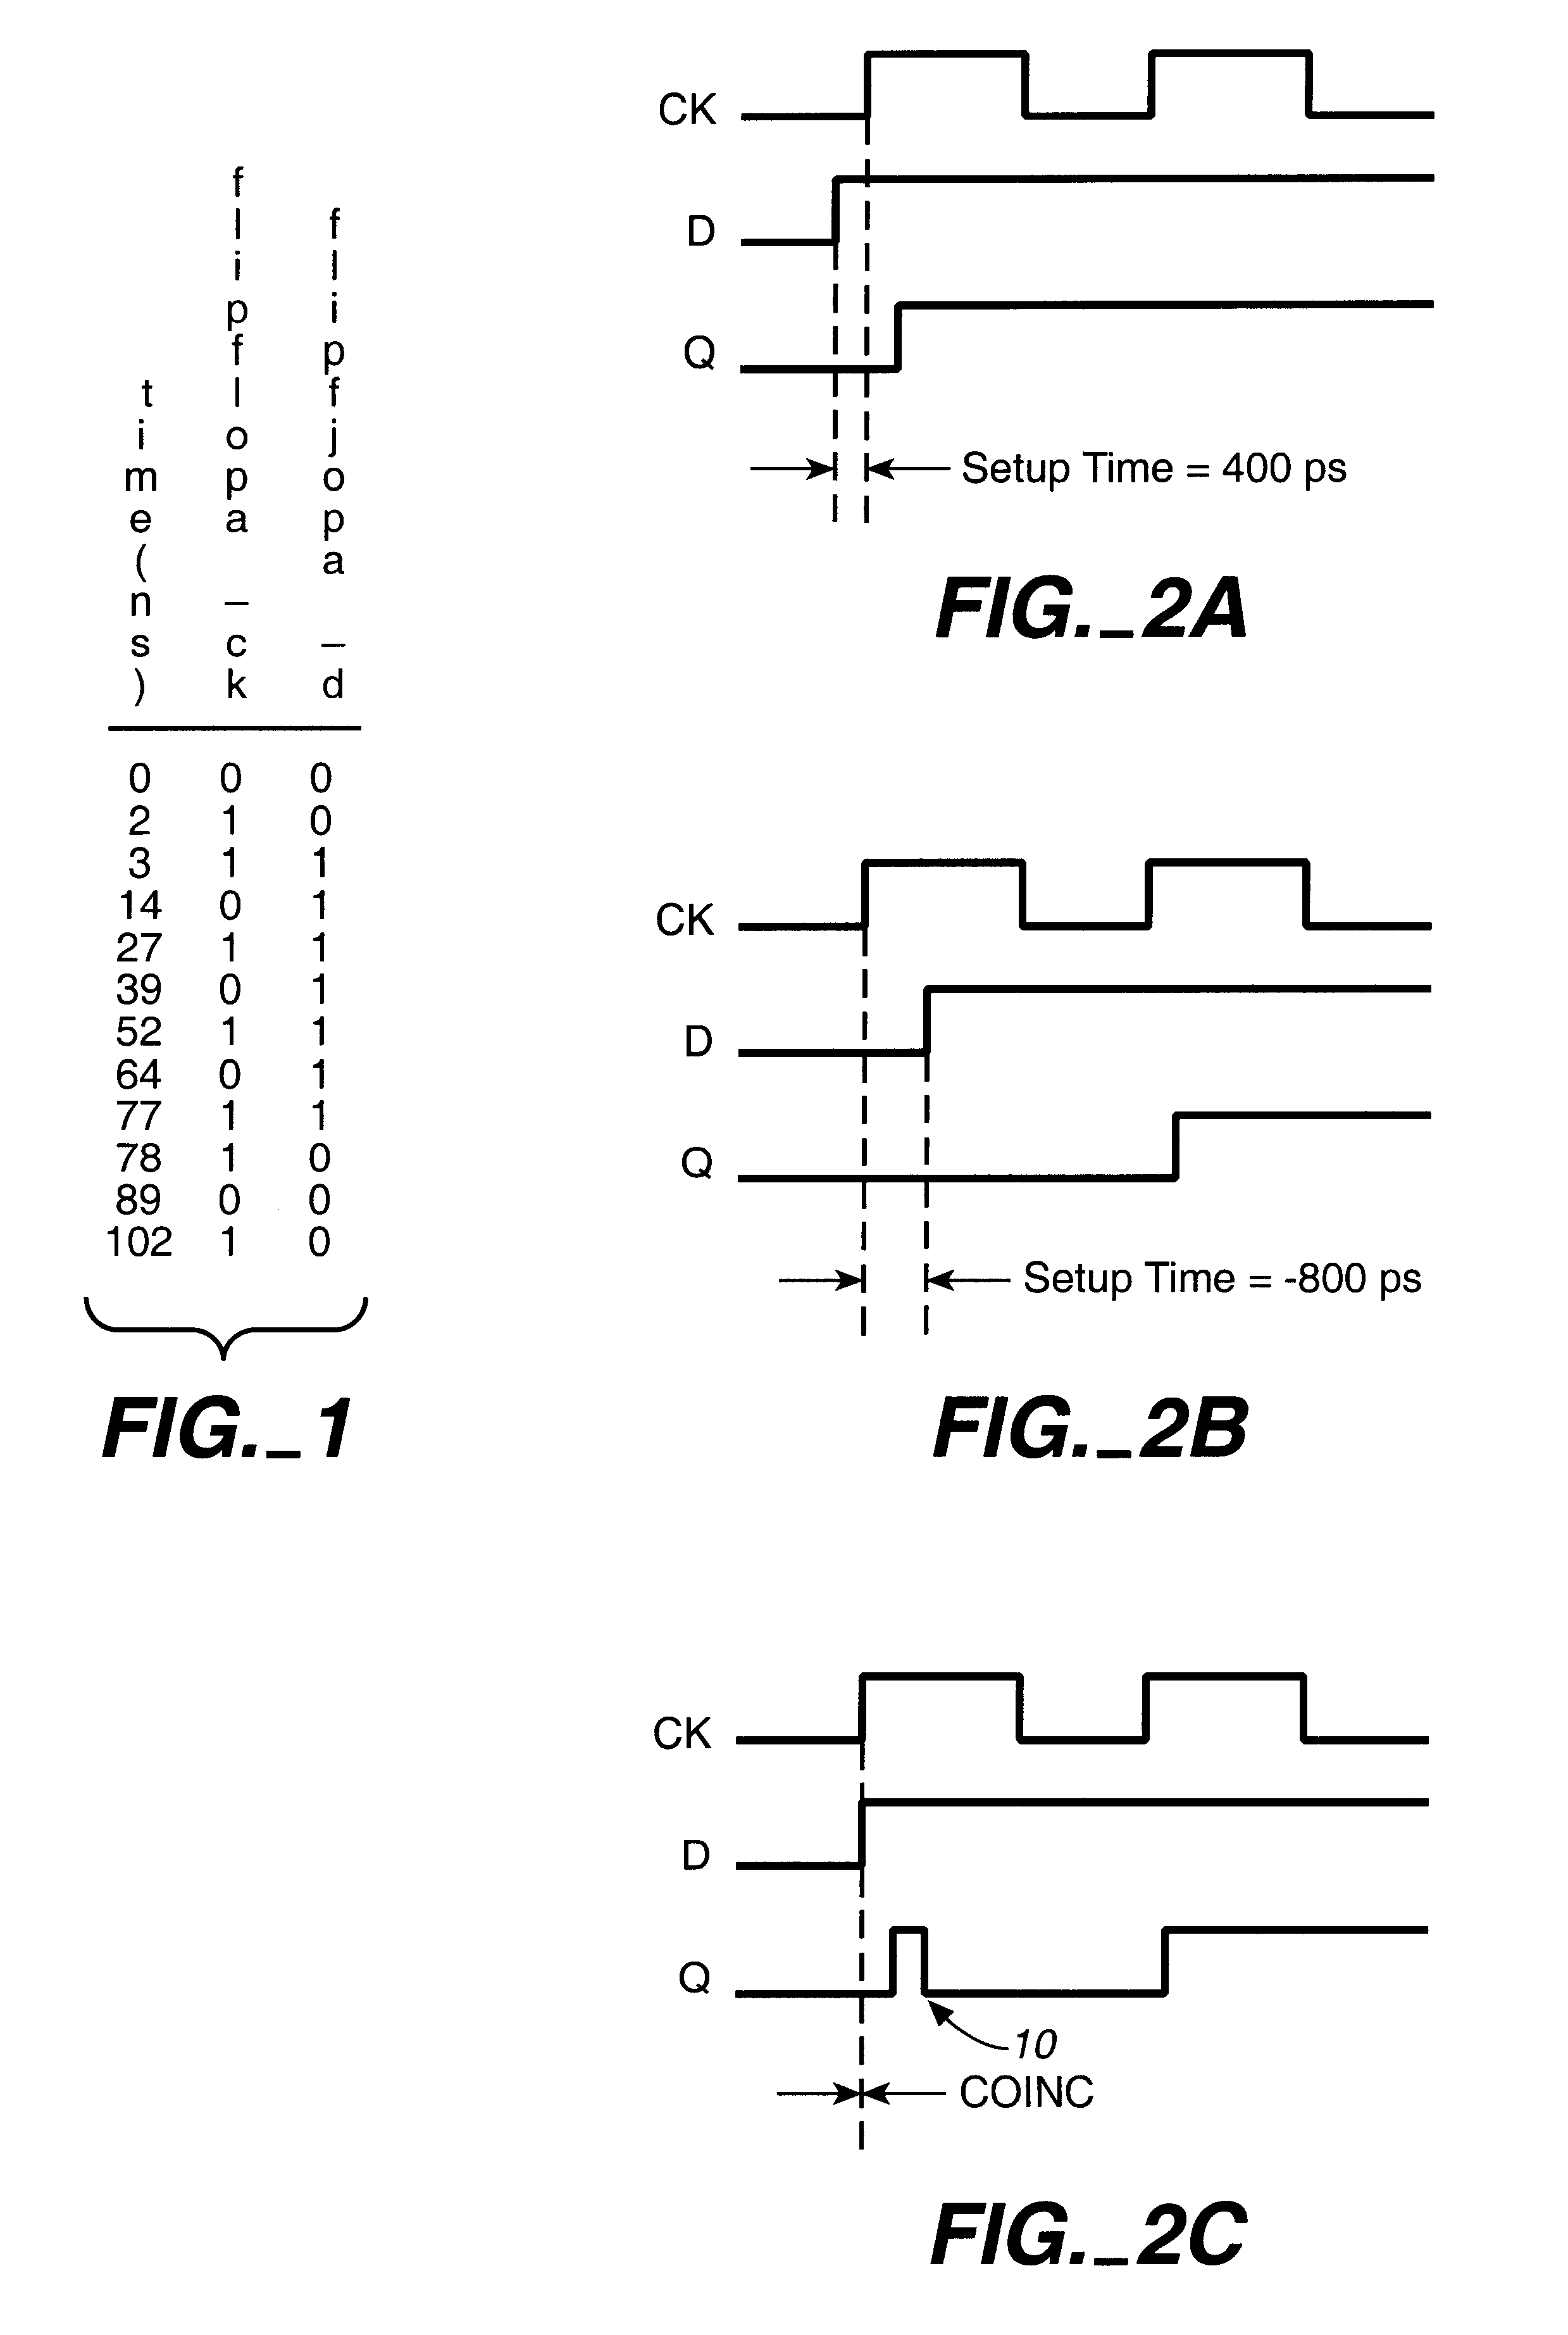
FIG. 1 depicts the contents of an illustrative print on change file where the file contains simulation information relating to the transitions of two signals, a data signal ("flipflopa_d") and a clock signal ("flipflopa_ck"), of a synchronous element ("flipflopa") of a design. The left hand column contains the simulation time ("time (ns)") where one of the signals, the data signal, "flipflopa_d", or the clock signal, "flipflopa_ck", changed states during the simulation. The center column and the right column show signal nets, "flipflopa_ck" and "flipflopa_d", respectively. While FIG. 1 shows two signal nets, the number of nets logged to the fi...


PUM


Abstract

A metastability risk simulation analysis device and method for identifying metastability risks of a design. The metastability risk simulation analysis device includes computer readable code which is configured to analyze simulation information relating to the design and determine whether the design presents a metastability risk. Desirably, the computer readable code is configured to determine whether two signals, such as a data signal and a clock signal of a synchronous element of the design, cross over each other thereby presenting a metastability risk, and is configured to generate a summary report identifying those synchronous elements of the design which present a metastability risk. Preferably, the computer readable code is configured to analyze simulation information relating to best case and worst case simulations of the design, and is configured to scan the simulation information to identify an edge of a clock signal and an edge of a data signal of the best case and worst case simulations and determine whether the signals cross each other.

Description

The present invention relates generally to apparatuses and methods for performing metastabilty analyses of designs which include one or more synchronous elements. The present invention more specifically relates to an apparatus and method which can be used to assess whether a design presents a metastability risk.Typically, simulation tests, such as best case and worst case simulations, are performed on designs which contain one or more synchronous elements. These simulations produce one or more simulation files (e.g. print on change files) which contain information regarding times at which data and clock signals changed during the simulation. This information can be reviewed to determine whether the design is acceptable.Best and worst case simulations may indicate that either the data signal or the clock signal leads the other with plenty of margin. For example, best case simulations may show the data signal leading the clock signal with plenty of margin, and worst case simulations m...

Claims


Application Information

Patent Timeline
IPC IPC(8): G06F17/50
CPCG06F17/5022G06F30/33
Inventor SCHULTZ, RICHARD T.GEARHARDT, KEVIN J.
Owner BELL SEMICON LLC
Why Eureka
Try Eureka