
Automated method for determining several critical dimension properties from scanning electron microscope by using several tilted beam or sample scans

a scanning electron microscope and critical dimension technology, applied in the direction of material analysis by measuring secondary emission, material analysis using wave/particle radiation, instruments, etc., can solve the problems of poor correlation between the electron microscope (cd sem), the image or waveform acquired by scanning focused sem beams, and the inability to accurately determine the critical dimension of the workpi

Inactive Publication Date: 2002-10-29
IBM CORP
View PDF7 Cites 66 Cited by
  • Summary
  • Abstract
  • Description
  • Claims
  • Application Information

AI Technical Summary

Problems solved by technology

An occasional problem with a conventional automated Critical Dimension Scanning Electron Microscope (CD SEM) measurement is poor correlation thereof with subsequent electrical measurements.
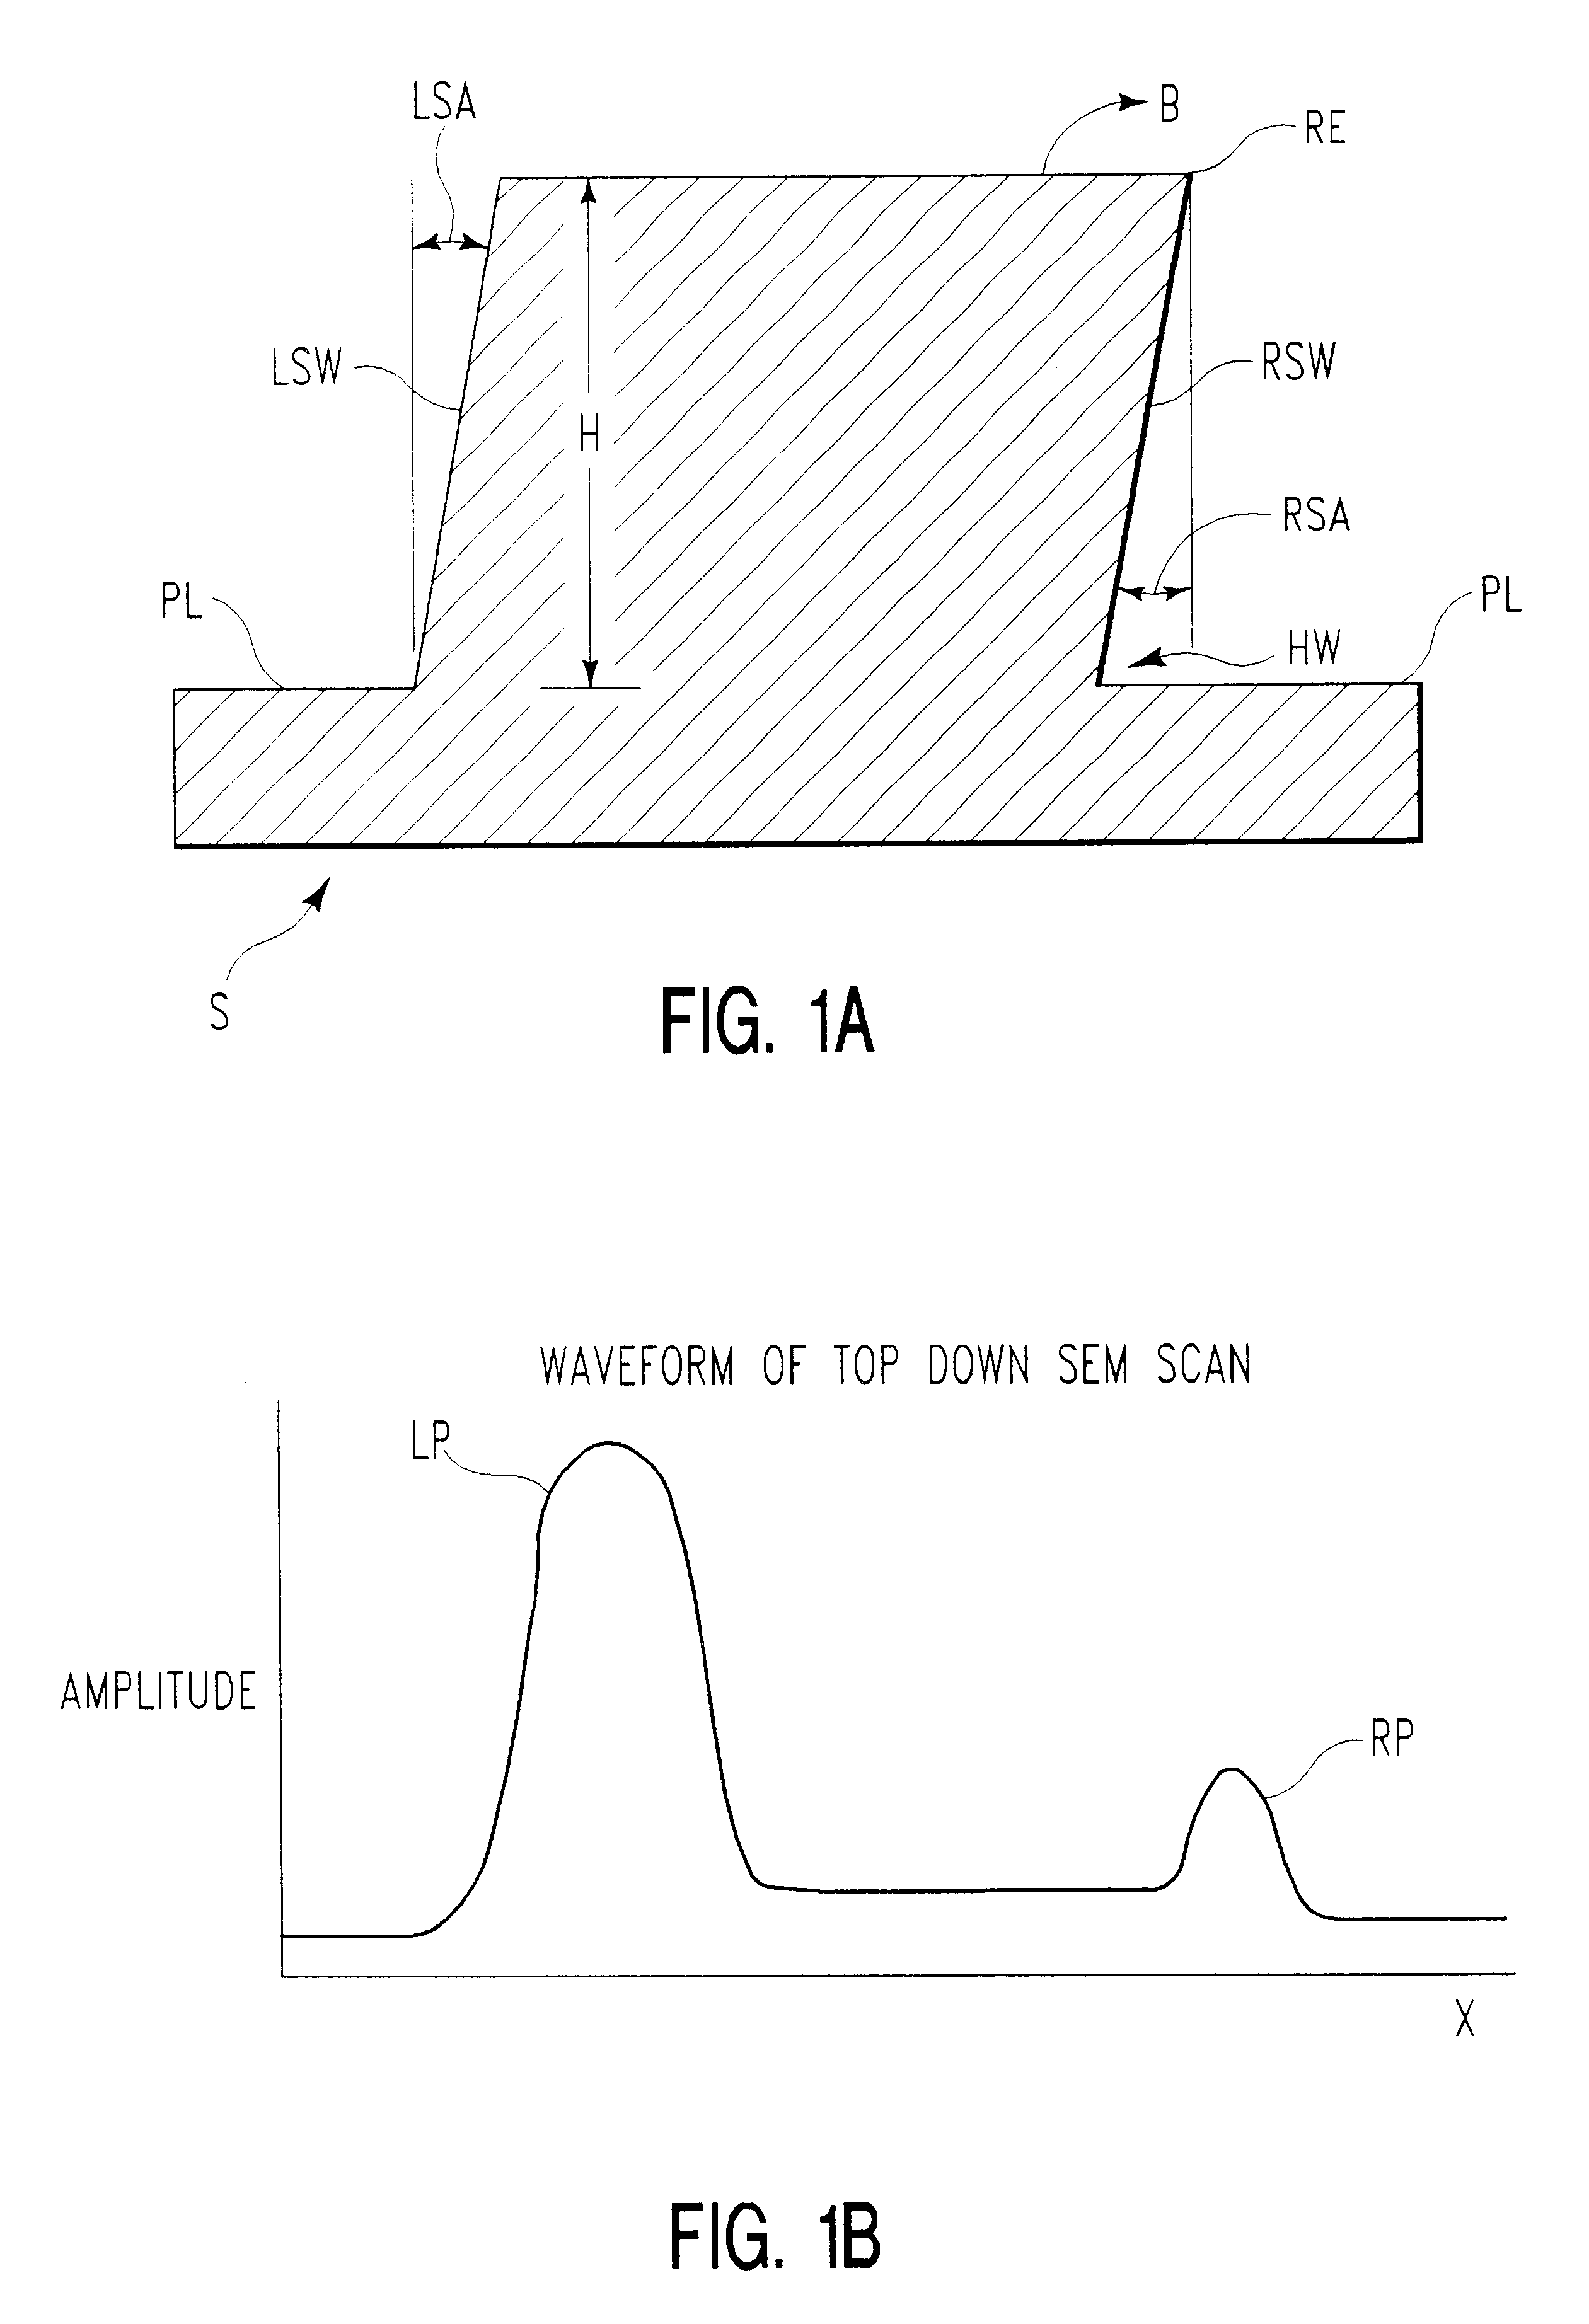
This problem can be due to feature positions to be measured, for example, the foot of a photoresist line being obscured by an overhanging structure.
Unfortunately, on the scale of interest for CD metrology (nanometers) and for the primary structures of interest (straight lines or spaces), there are few dependable identifiable features.
None of these methods deals with images or waveforms acquired by scanning focused SEM-beams or the very different interaction physics of an SEM-beam with matter.
However, the overhead in calculation resources is significant and the accuracy of the modeling, especially in the presence of sample charging, is highly questionable.
Today, it is not possible to acquire multiple SEM images or waveforms on the nanometer scale, after stage movement, with blind navigation.
Manifestly, the acute angle overhang of the right sidewall RSW makes it difficult for a conventional vertical SEM scan to detect the surface of the sample S at the bottom of hollow HW.
Since the size of the interaction volume depends on both the beam landing energy and the composition of the structure, it is usually not a useful metrology marker.
On the other hand, the height of the structure under investigation may not be well known.
With only one measurement significantly greater than the others, there is not enough information available to determine the sidewall angle and the structure height H.
Even though there are now five measured data points, this case has insufficient information to determine both the sidewall angle and the structure height.
This is because of the finite beam size and other resolution limiting effects.
However, perhaps because of practical limitations in the equipment this is not possible.
Unfortunately, this too has failed to produce a DESL value above threshold.

Method used


Image

  • Automated method for determining several critical dimension properties from scanning electron microscope by using several tilted beam or sample scans
  • Automated method for determining several critical dimension properties from scanning electron microscope by using several tilted beam or sample scans
  • Automated method for determining several critical dimension properties from scanning electron microscope by using several tilted beam or sample scans

Examples


Embodiment Construction

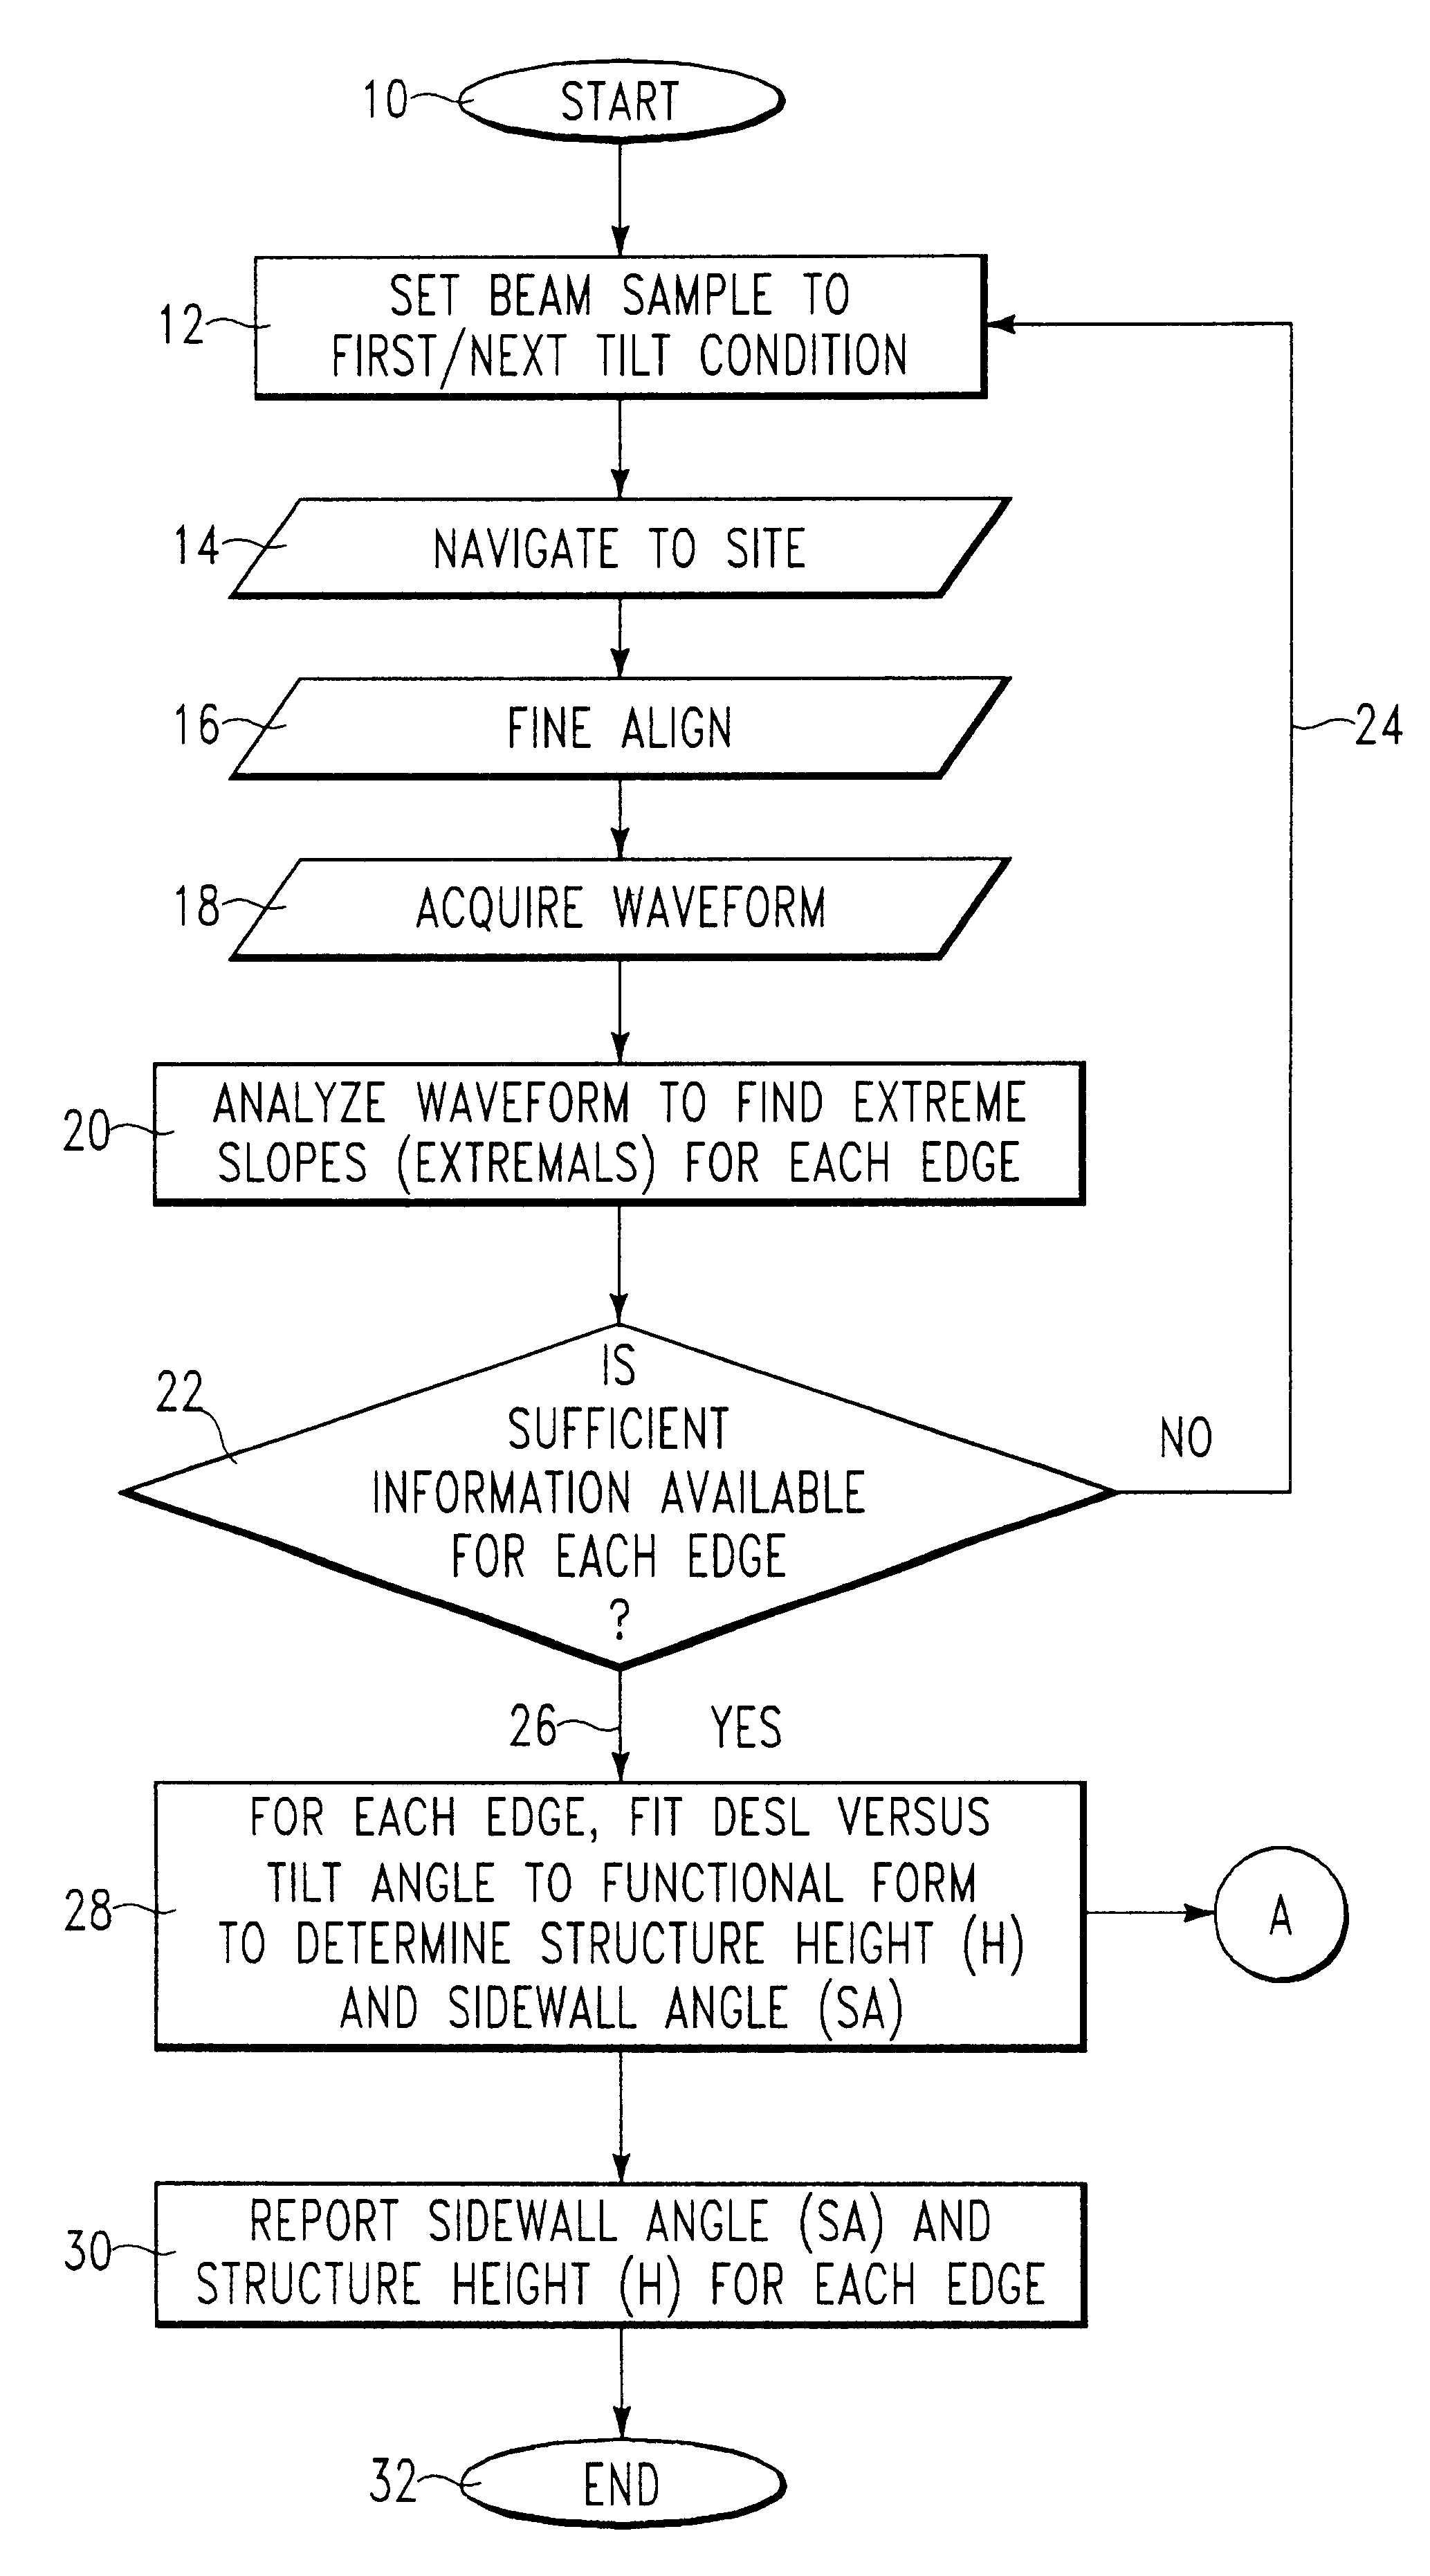
Consider a system where during calibration it was determined that K.sub.0 =6 nm, K=2 nm and the threshold was chosen to be 16 nm. The system first acquires a waveform with a vertical electron beam (0 degrees of tilt) and the DESL determined for an edge of interest is 8 nm. Next the system sets up a tilted beam of 2 degrees and determines for that condition the DESL is 8 nm. Neither DESL value determined so far is above the threshold, so the system sets up a new tilt of 4 degrees; the resulting DESL is determined to be 20 nm. There is now one DESL value above the threshold but the system needs at least two values above the threshold, so a new tilt angle is set: 6 degrees. The resulting DESL is 35 nm. There are now two DESL values above threshold and the system can now proceed to determine the structure height and sidewall angle. The data collected are listed in the following table:

These data are plotted in the graph shown in FIG. 12.

The two DESL values above threshold determine a str...


PUM

PropertyMeasurementUnit
tan θaaaaaaaaaa
angle RSAaaaaaaaaaa
spot sizeaaaaaaaaaa

Abstract

To obtain data pertaining to the surface characteristics of a sample, a control method adjusts a tilted rastered E-beam to in SEM to a first / next tilt condition and navigates the SEM-beam to a sample site. The system performs a fine alignment step. Then the system scans a region of a sample to acquire a waveform. The system analyzes the waveform to determine the DESL value for each edge of interest. The system tests whether there is sufficient information available for each structural edge. If NO, the system repeats the above steps starting by changing the value of the tilt angle to acquire another waveform. If YES, the system determines the height and sidewall angles for each structural edge. Then the system reports the sidewall angle and the structure height for each edge of the structure under test. The system then corrects the critical dimension measurement determined from 0 degrees tilt scanning.

Description

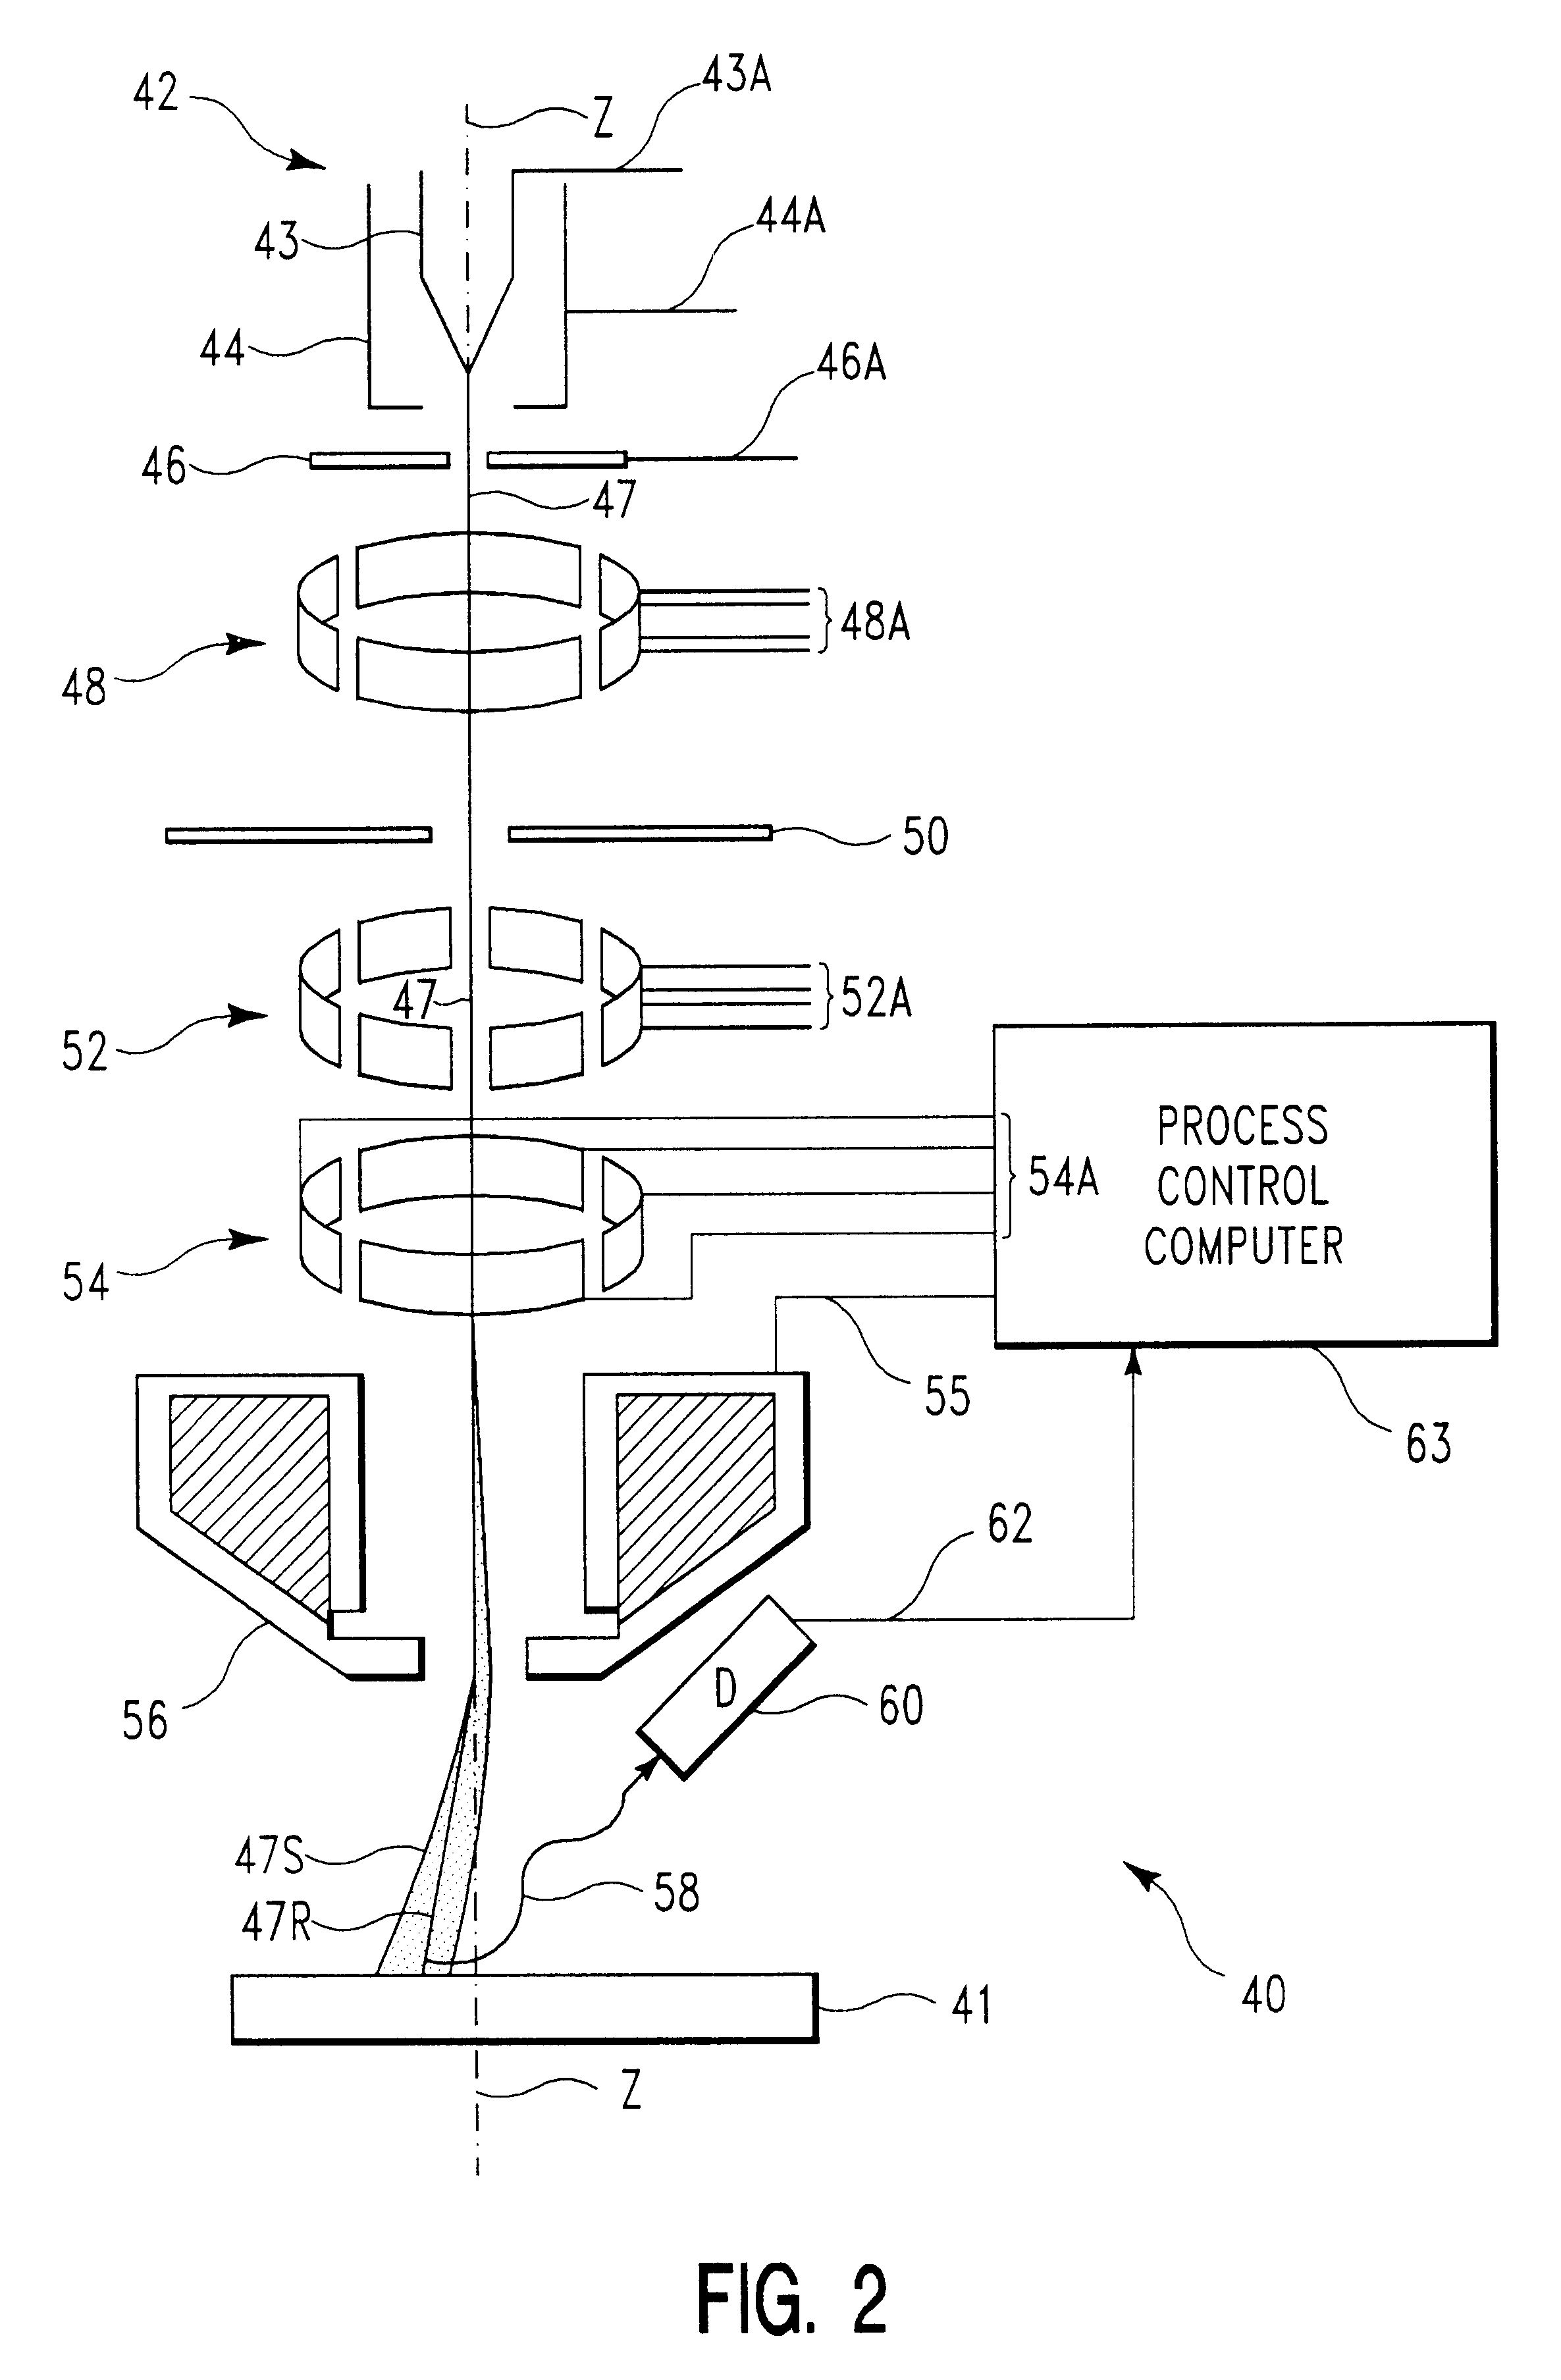
1. Field of the InventionThis invention relates to methods and apparatus for determining the critical dimension of workpieces. 2. Description of Related ArtAn occasional problem with a conventional automated Critical Dimension Scanning Electron Microscope (CD SEM) measurement is poor correlation thereof with subsequent electrical measurements. This problem can be due to feature positions to be measured, for example, the foot of a photoresist line being obscured by an overhanging structure. Other examples are T-topping, undercutting, and negative angle or recursive sidewall.Currently available standard top / down CD SEM systems prevent the SEM electron beam (SEM-beam) from tilting relative to the sample for several reasons. However, at least one CD SEM provider is developing a system that can quickly and automatically tilt the beam by several degrees and acquire secondary electron waveforms or images from scanning the same structure at various tilt angles.Such technology can advance th...

Claims


Application Information

Patent Timeline
Patent Type & Authority Patents(United States)
IPC IPC(8): G01N23/225G01N23/22
CPCG01N23/225
Inventor ARCHIE, CHARLES NEILL
Owner IBM CORP
Learn More