Methods for transmitting a waveform having a controllable attenuation and propagation velocity
a waveform and propagation velocity technology, applied in the field of signal transmission, can solve the problems of poor lossy tof measurement accuracy, subject to delay and distortion, and difficult to determine the delay or propagation time of typical signals used to generate inputs to transmission lines,
- Summary
- Abstract
- Description
- Claims
- Application Information
AI Technical Summary
Problems solved by technology
Method used
Image
Examples
example 1
Method for Determining SD Waveform Parameters, ASD and vSD
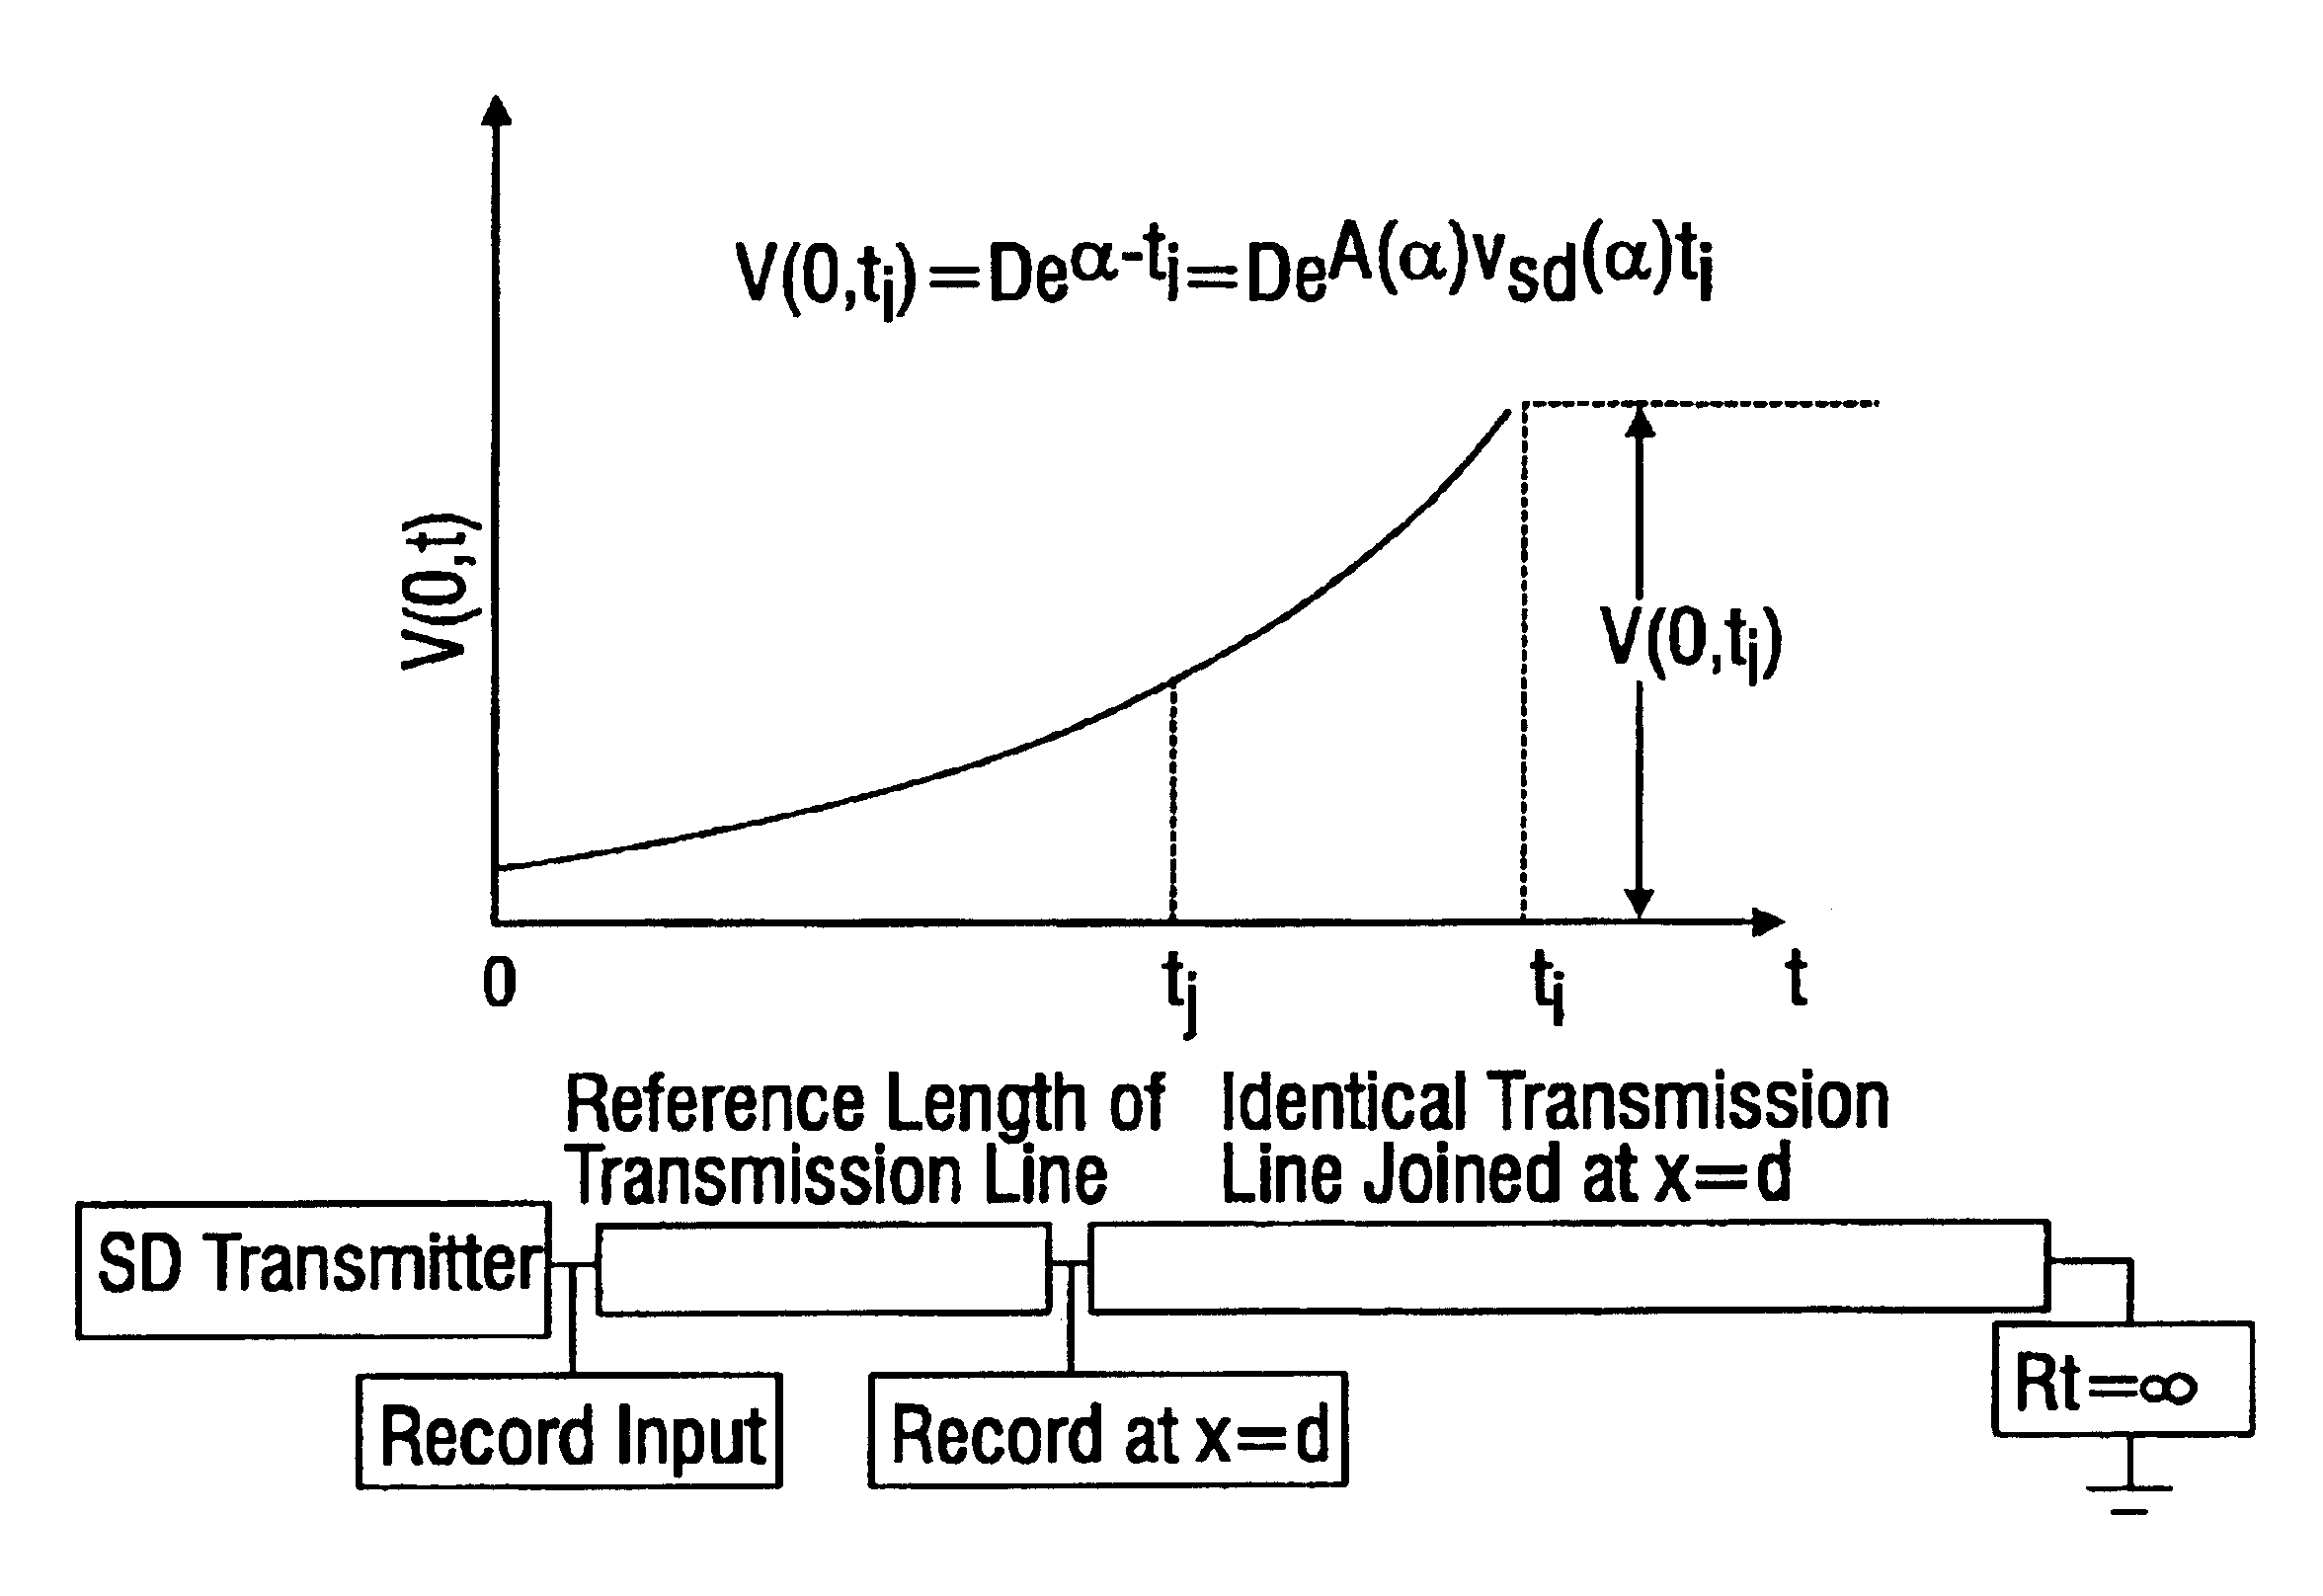
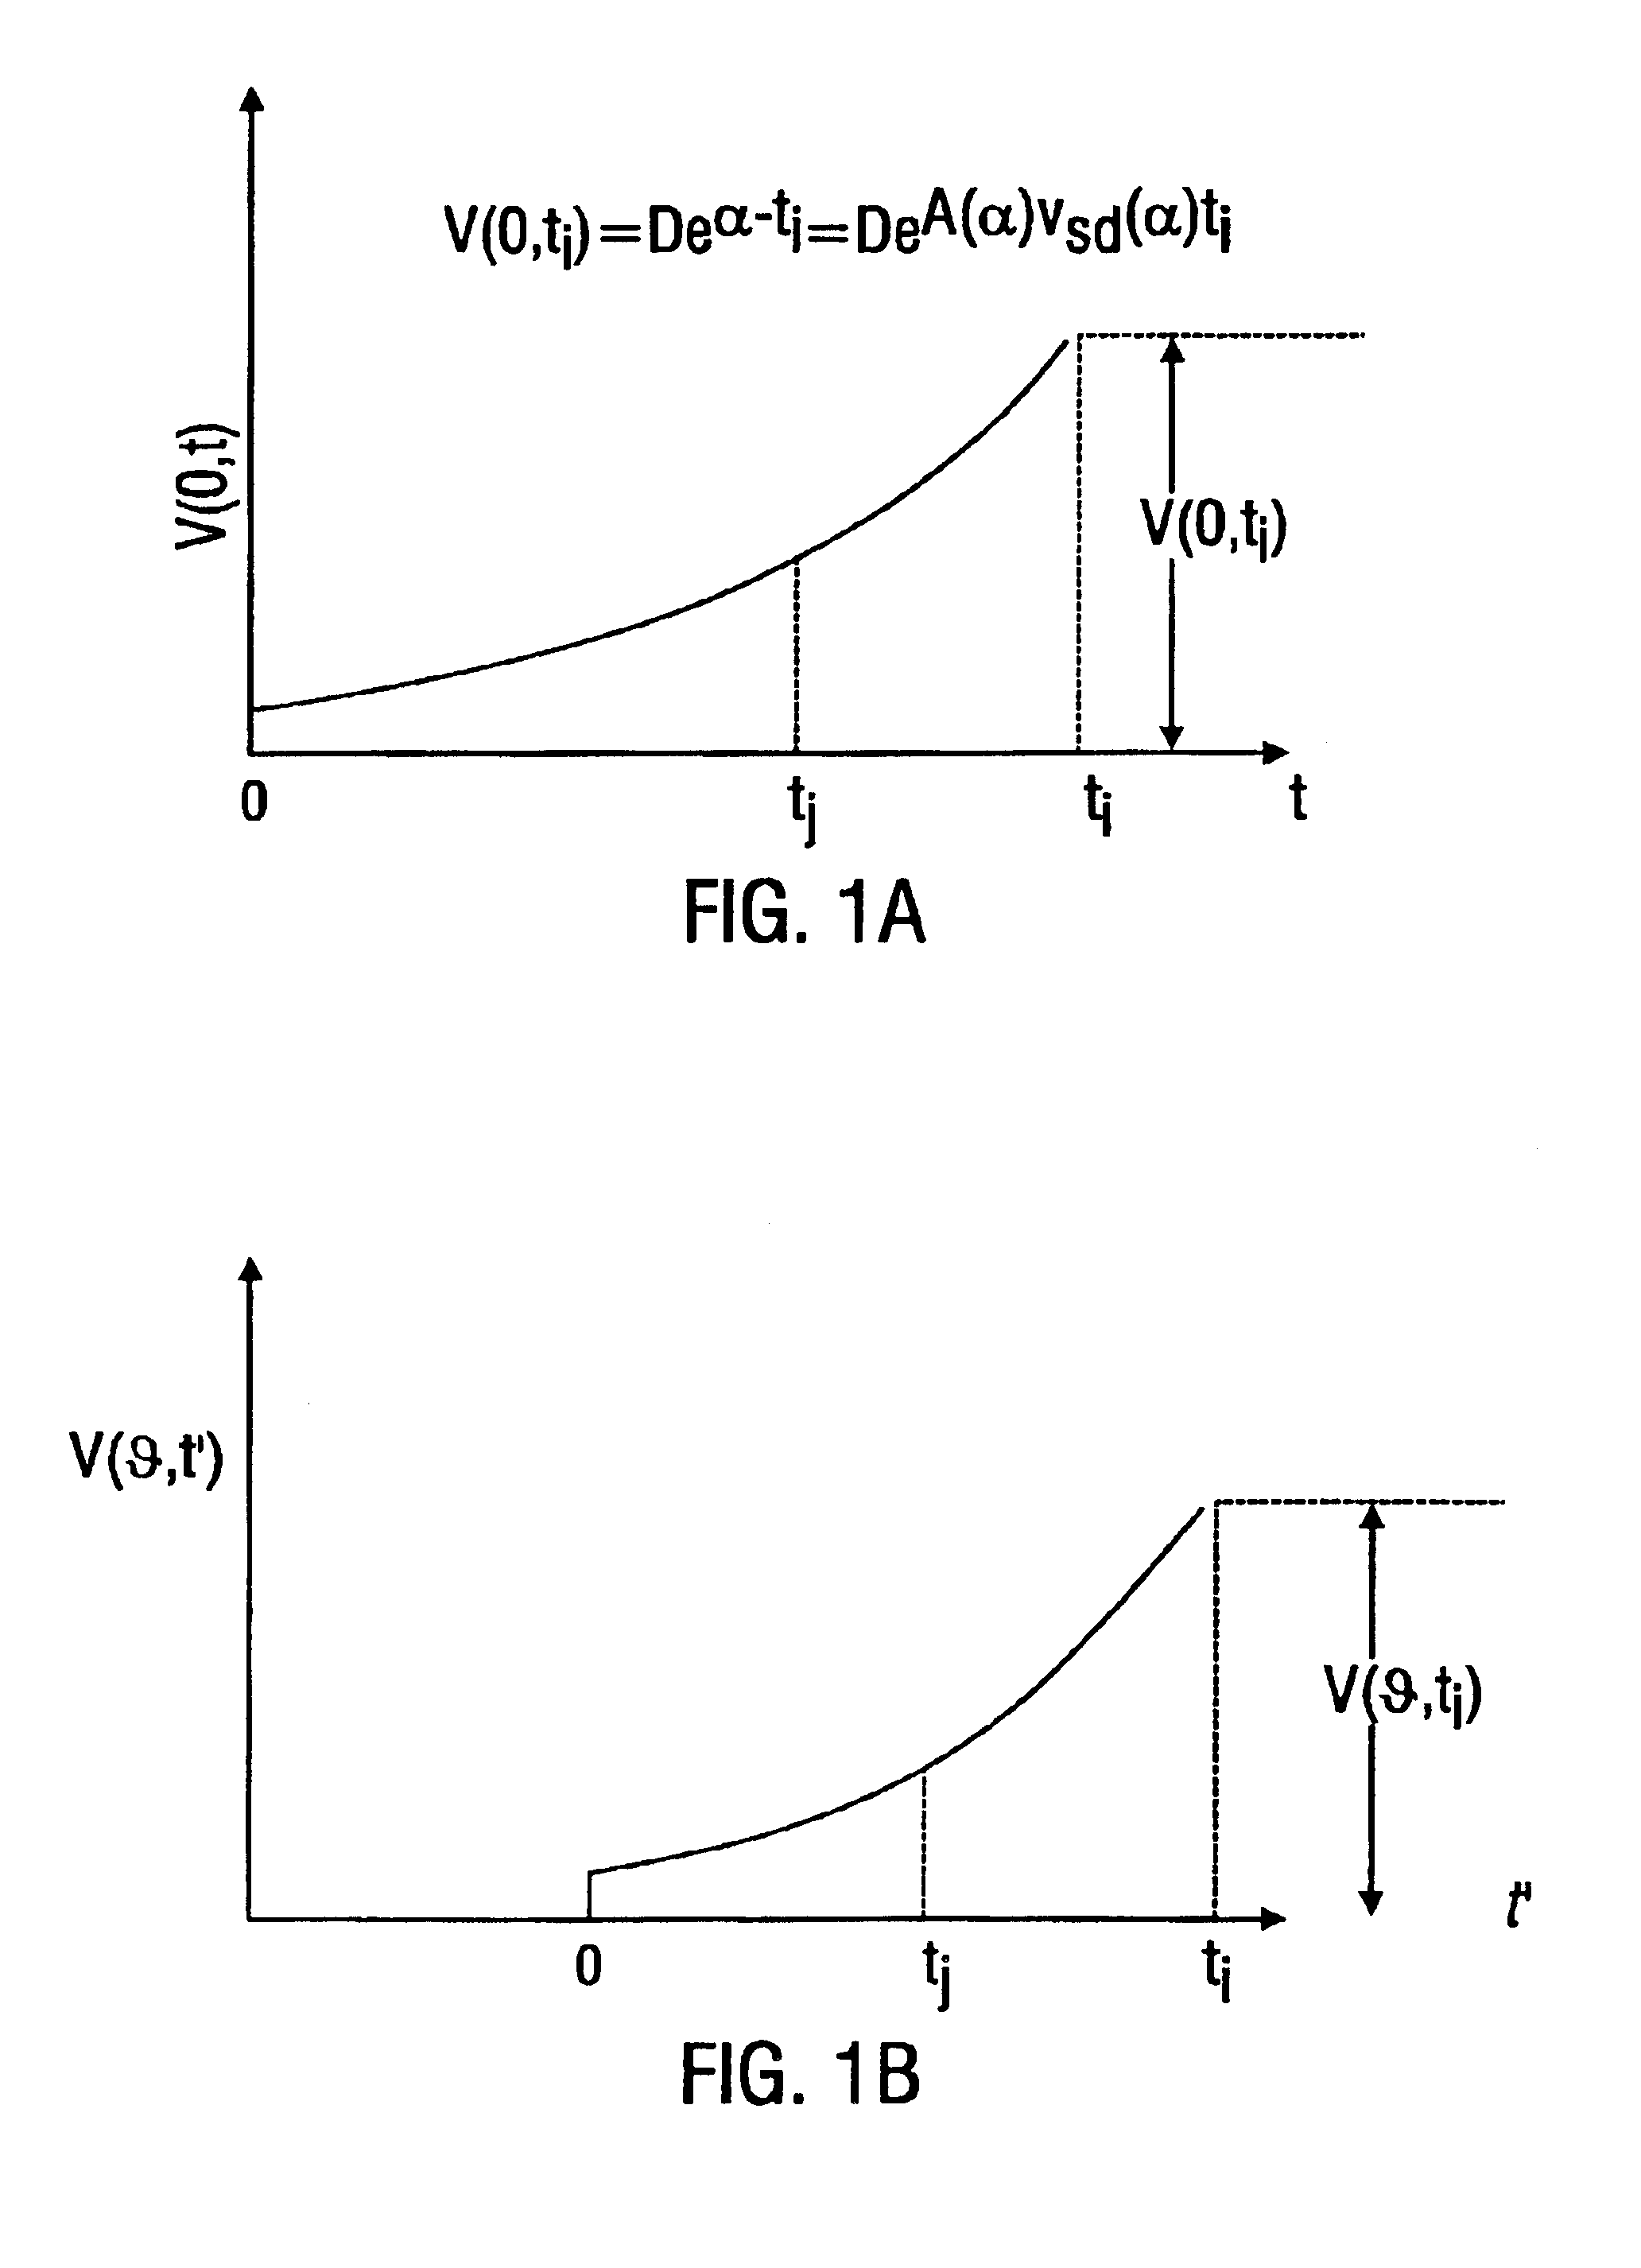
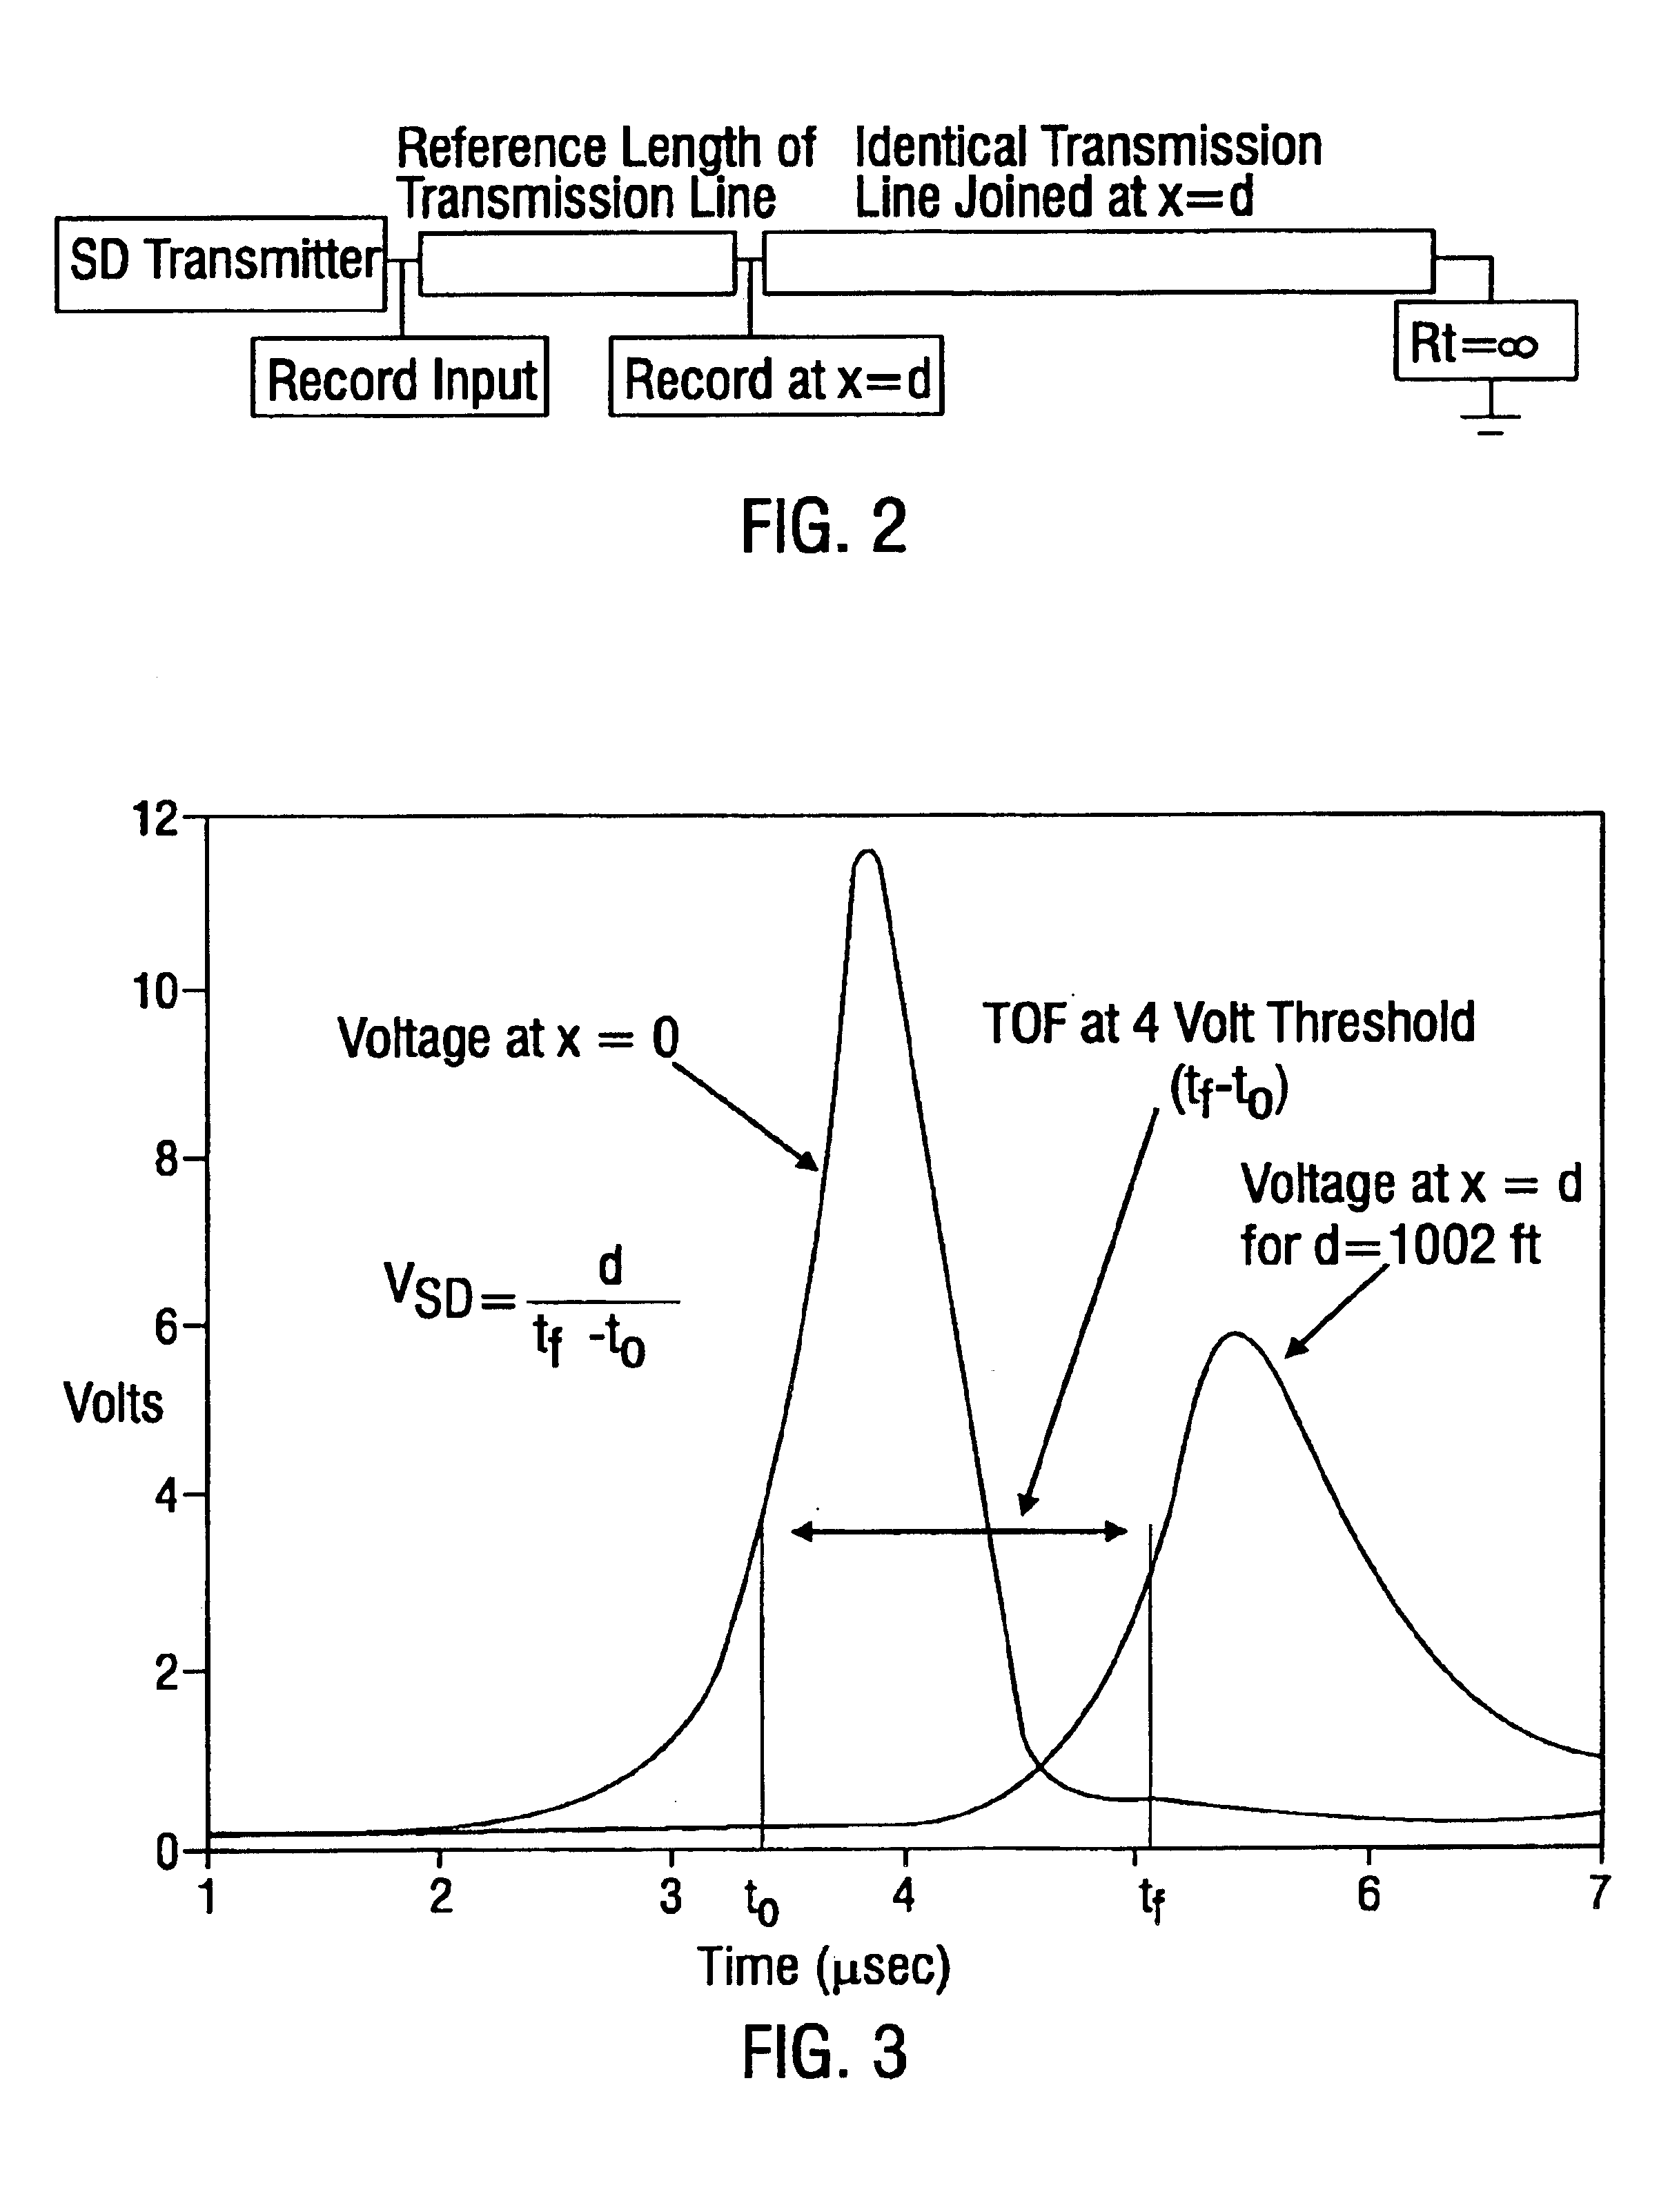
This example teaches how SD test pulses may be used to obtain empirical estimates of the transmission line parameters, ASD and vSD, that describe the propagation of SD waveforms in lossy, dispersive lines, including those with frequency dependent parameters. The numerical values of ASD and vSD as a function of a can be determined empirically.
Referring to FIG. 2, an experimental set up that may be used to determine these parameters for a copper, twisted wire pair transmission line is depicted. The test length of the transmission line, d, and the value of a for the applied SD input signal are measured. An additional length of transmission line that is identical to the line under test is attached as shown and terminated with an open circuit. In this example the cables are two 24 AWG, individually shielded, twisted wire pairs in a 1002 ft coil of T1 cable.
The values of D, α and the duration of the SD signal were chosen to preven...
example 2
Extracting SD Parameters From Empirical Transfer Function
The method described in example 1 can be limiting in that it should be experimentally repeated for each exponential coefficient α. This may require a lengthy laboratory calibration time for each cable type. Simulation can be included in the calibration process to significantly reduce the experimental measurements needed to determine the values of ASD and vSD. The use of simulation in this process requires a transfer function that describes the response of the specific type of cable. The α's analyzed for the T1 cable range from 1×10⁵ sect to 1×10⁷ sec−1. This range of α's corresponds to the frequency band of 16 kHz to 1.6 MHz, so the transfer function must be accurate for this range. The transfer function of the cable may available from the manufacturer or can be determined empirically by applying a known pulse and measuring the applied cable input waveform and the response waveform at a known (calibration) distance along the c...
example 3
Measurement of SD Transmission Line Impedance
The SD line impedance, ZSD (α), is a real number which may be determined for the α's of interest. If the Laplace transform of the frequency dependent transmission line parameters {overscore (R)}(s), {overscore (L)}(s), C(s), and {overscore (G)}(s), are known, then ZSD(α) may be computed from ZS D=α L_(α)+R_(α)α C_(α)+G_(α).
The SD line impedance, ZSD(α), may also be experimentally determined for a test transmission line by measuring the SD portion of the voltage waveform across various known termination impedances and computing the value ZSD(α) from the measurements. The measured SD waveform at a termination, VSD(Rt), consists of the sum of the incident SD waveform, VSD+, and a reflected SD wave. The reflected wave is the product of the SD reflection coefficient, Γ, and the incident wave. The measured SD signal at the termination will be VS D(Rt)=(1+Γt)·VS D+=2·RtRt+ZS D·VS D+.
Note that all lumped and distributed impedan...
PUM
 Abstract
Description
Claims
Application Information
 - R&D
- Intellectual Property
- Life Sciences
- Materials
- Tech Scout
- Unparalleled Data Quality
- Higher Quality Content
- 60% Fewer Hallucinations
Browse by: Latest US Patents, China's latest patents, Technical Efficacy Thesaurus, Application Domain, Technology Topic, Popular Technical Reports.
© 2025 PatSnap. All rights reserved.Legal|Privacy policy|Modern Slavery Act Transparency Statement|Sitemap|About US| Contact US: help@patsnap.com


