Method and apparatus for mapping uncertainty and generating a map or a cube based on conditional simulation of random variables

a technology of random variables and mapping methods, applied in the field of methods and apparatus for mapping uncertainty and generating maps or cubes based on random variable conditional simulation, can solve the problems of long and costly procedures

Inactive Publication Date: 2005-06-28
SCHLUMBERGER TECH CORP
View PDF8 Cites 22 Cited by
  • Summary
  • Abstract
  • Description
  • Claims
  • Application Information

AI Technical Summary

Problems solved by technology

This is a lengthy and costly procedure.

Method used


Image

  • Method and apparatus for mapping uncertainty and generating a map or a cube based on conditional simulation of random variables
  • Method and apparatus for mapping uncertainty and generating a map or a cube based on conditional simulation of random variables
  • Method and apparatus for mapping uncertainty and generating a map or a cube based on conditional simulation of random variables

Examples


Embodiment Construction

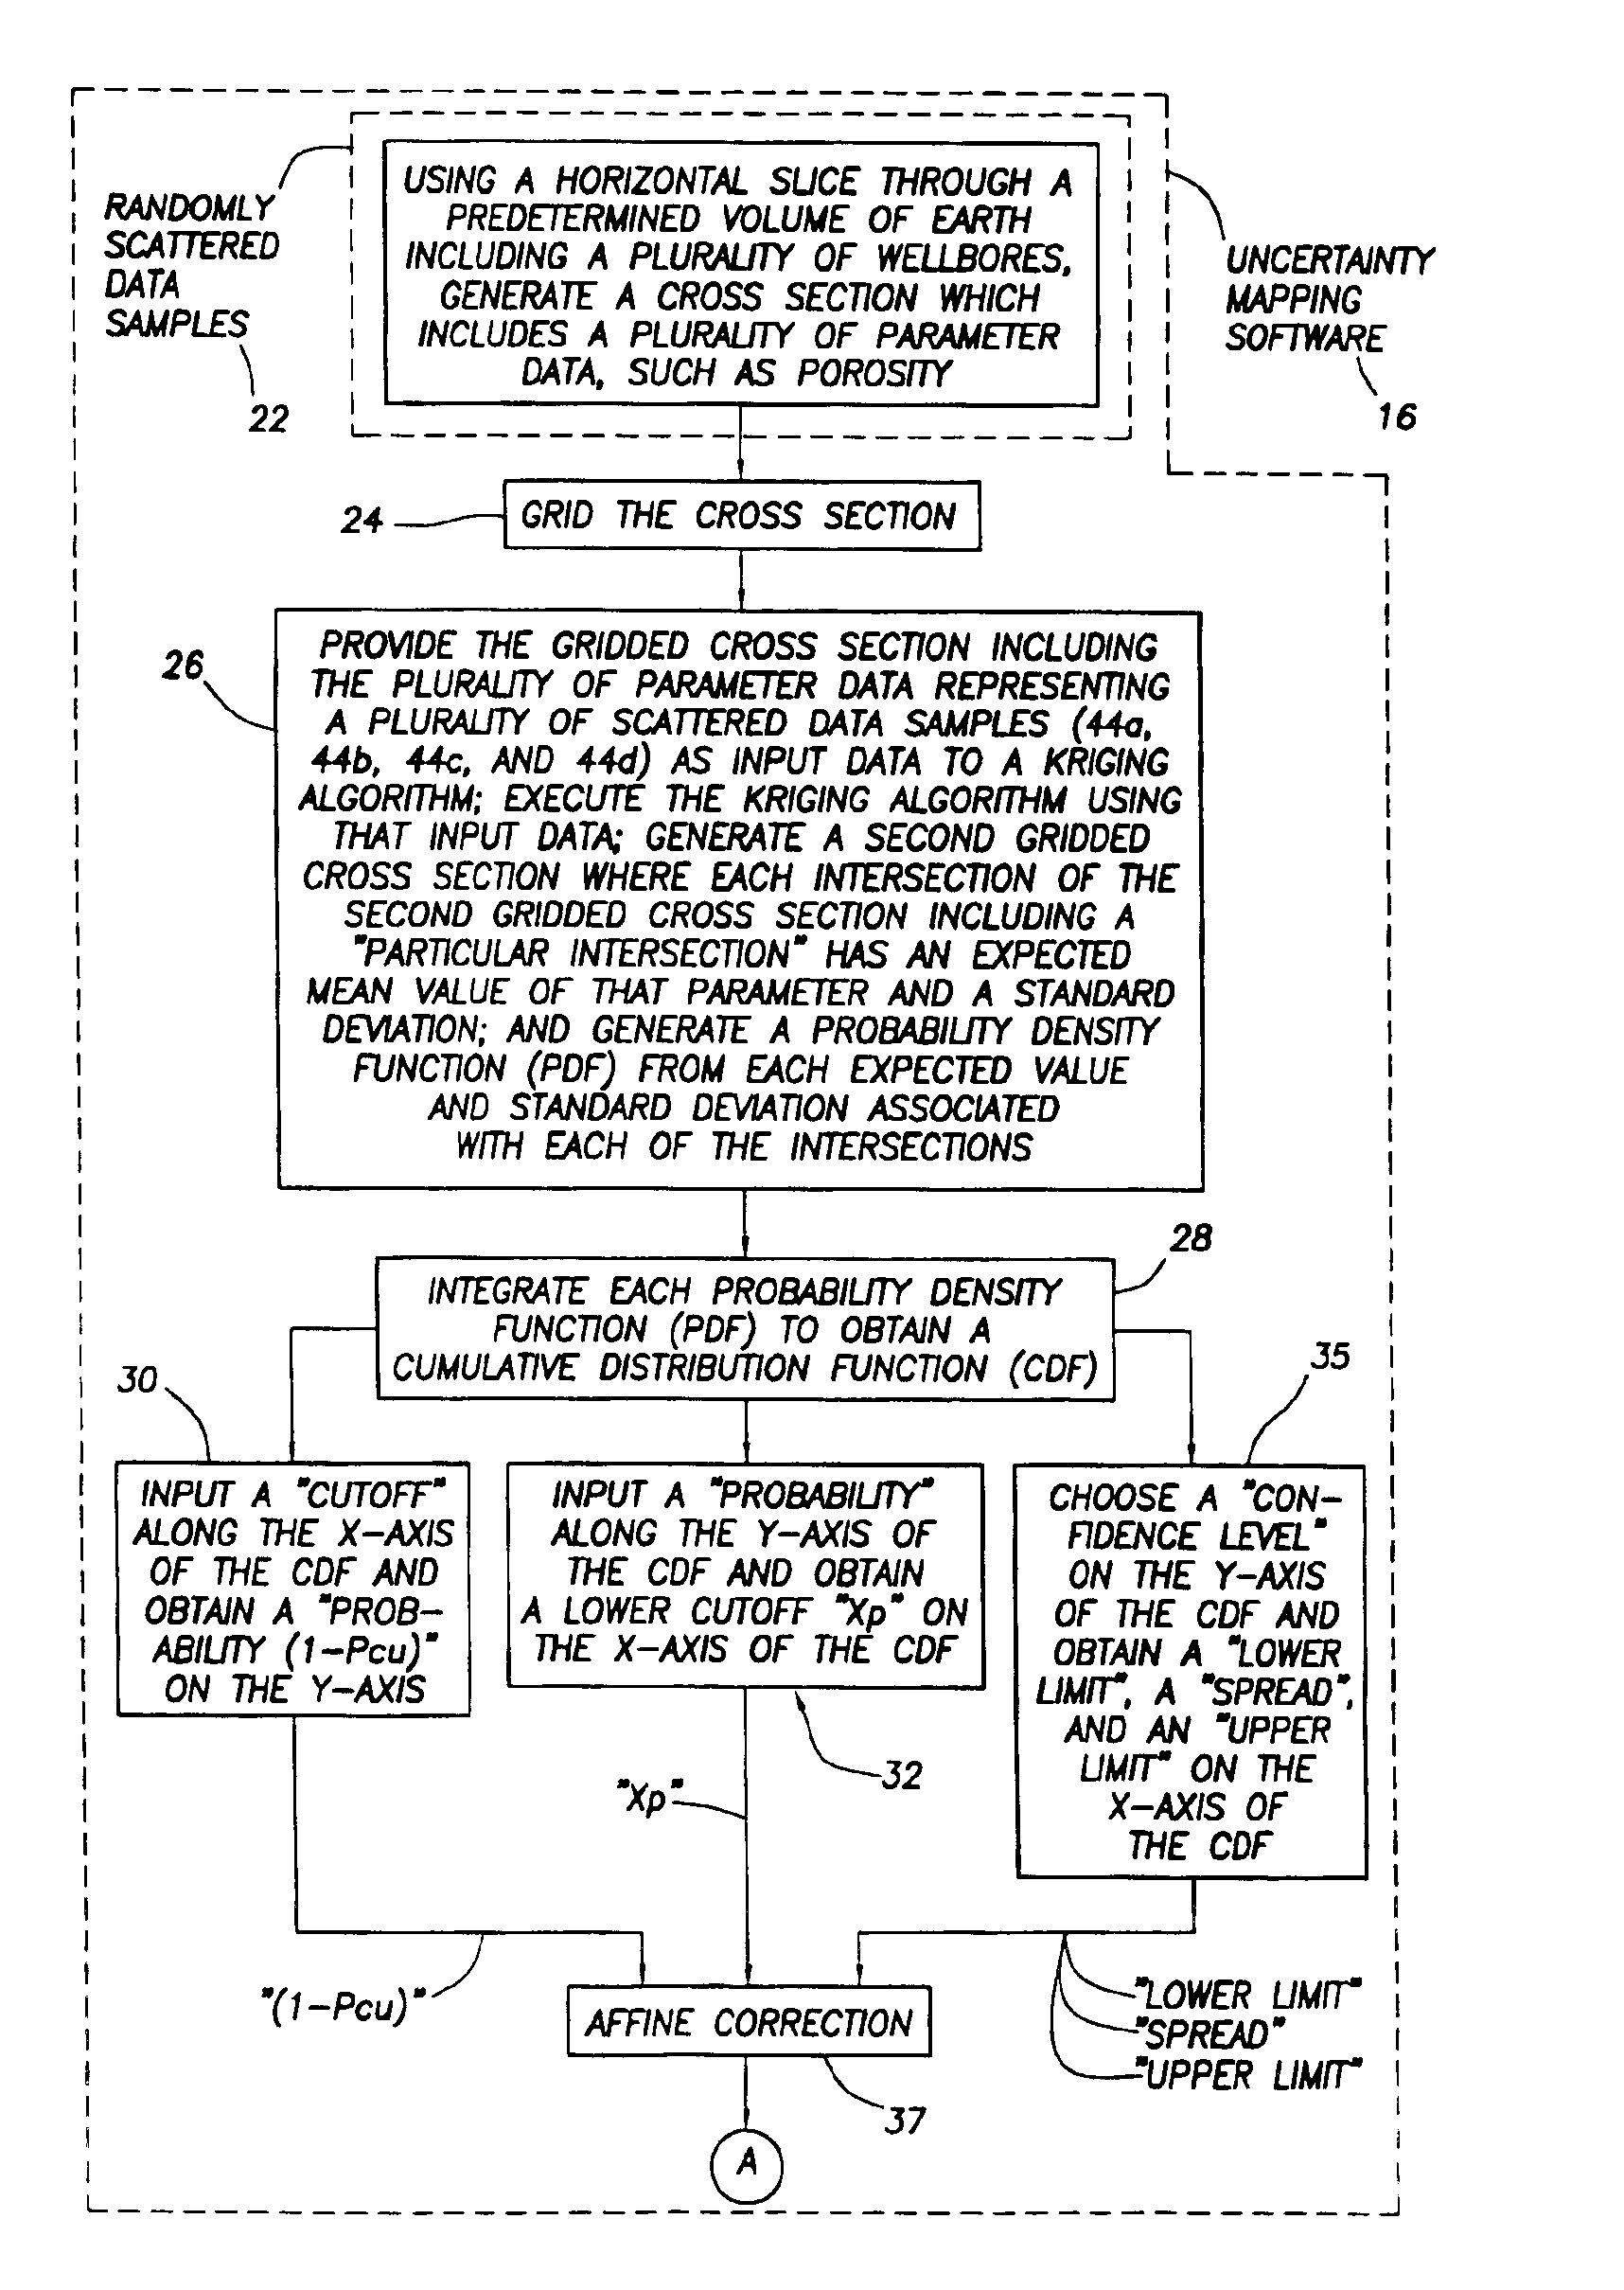
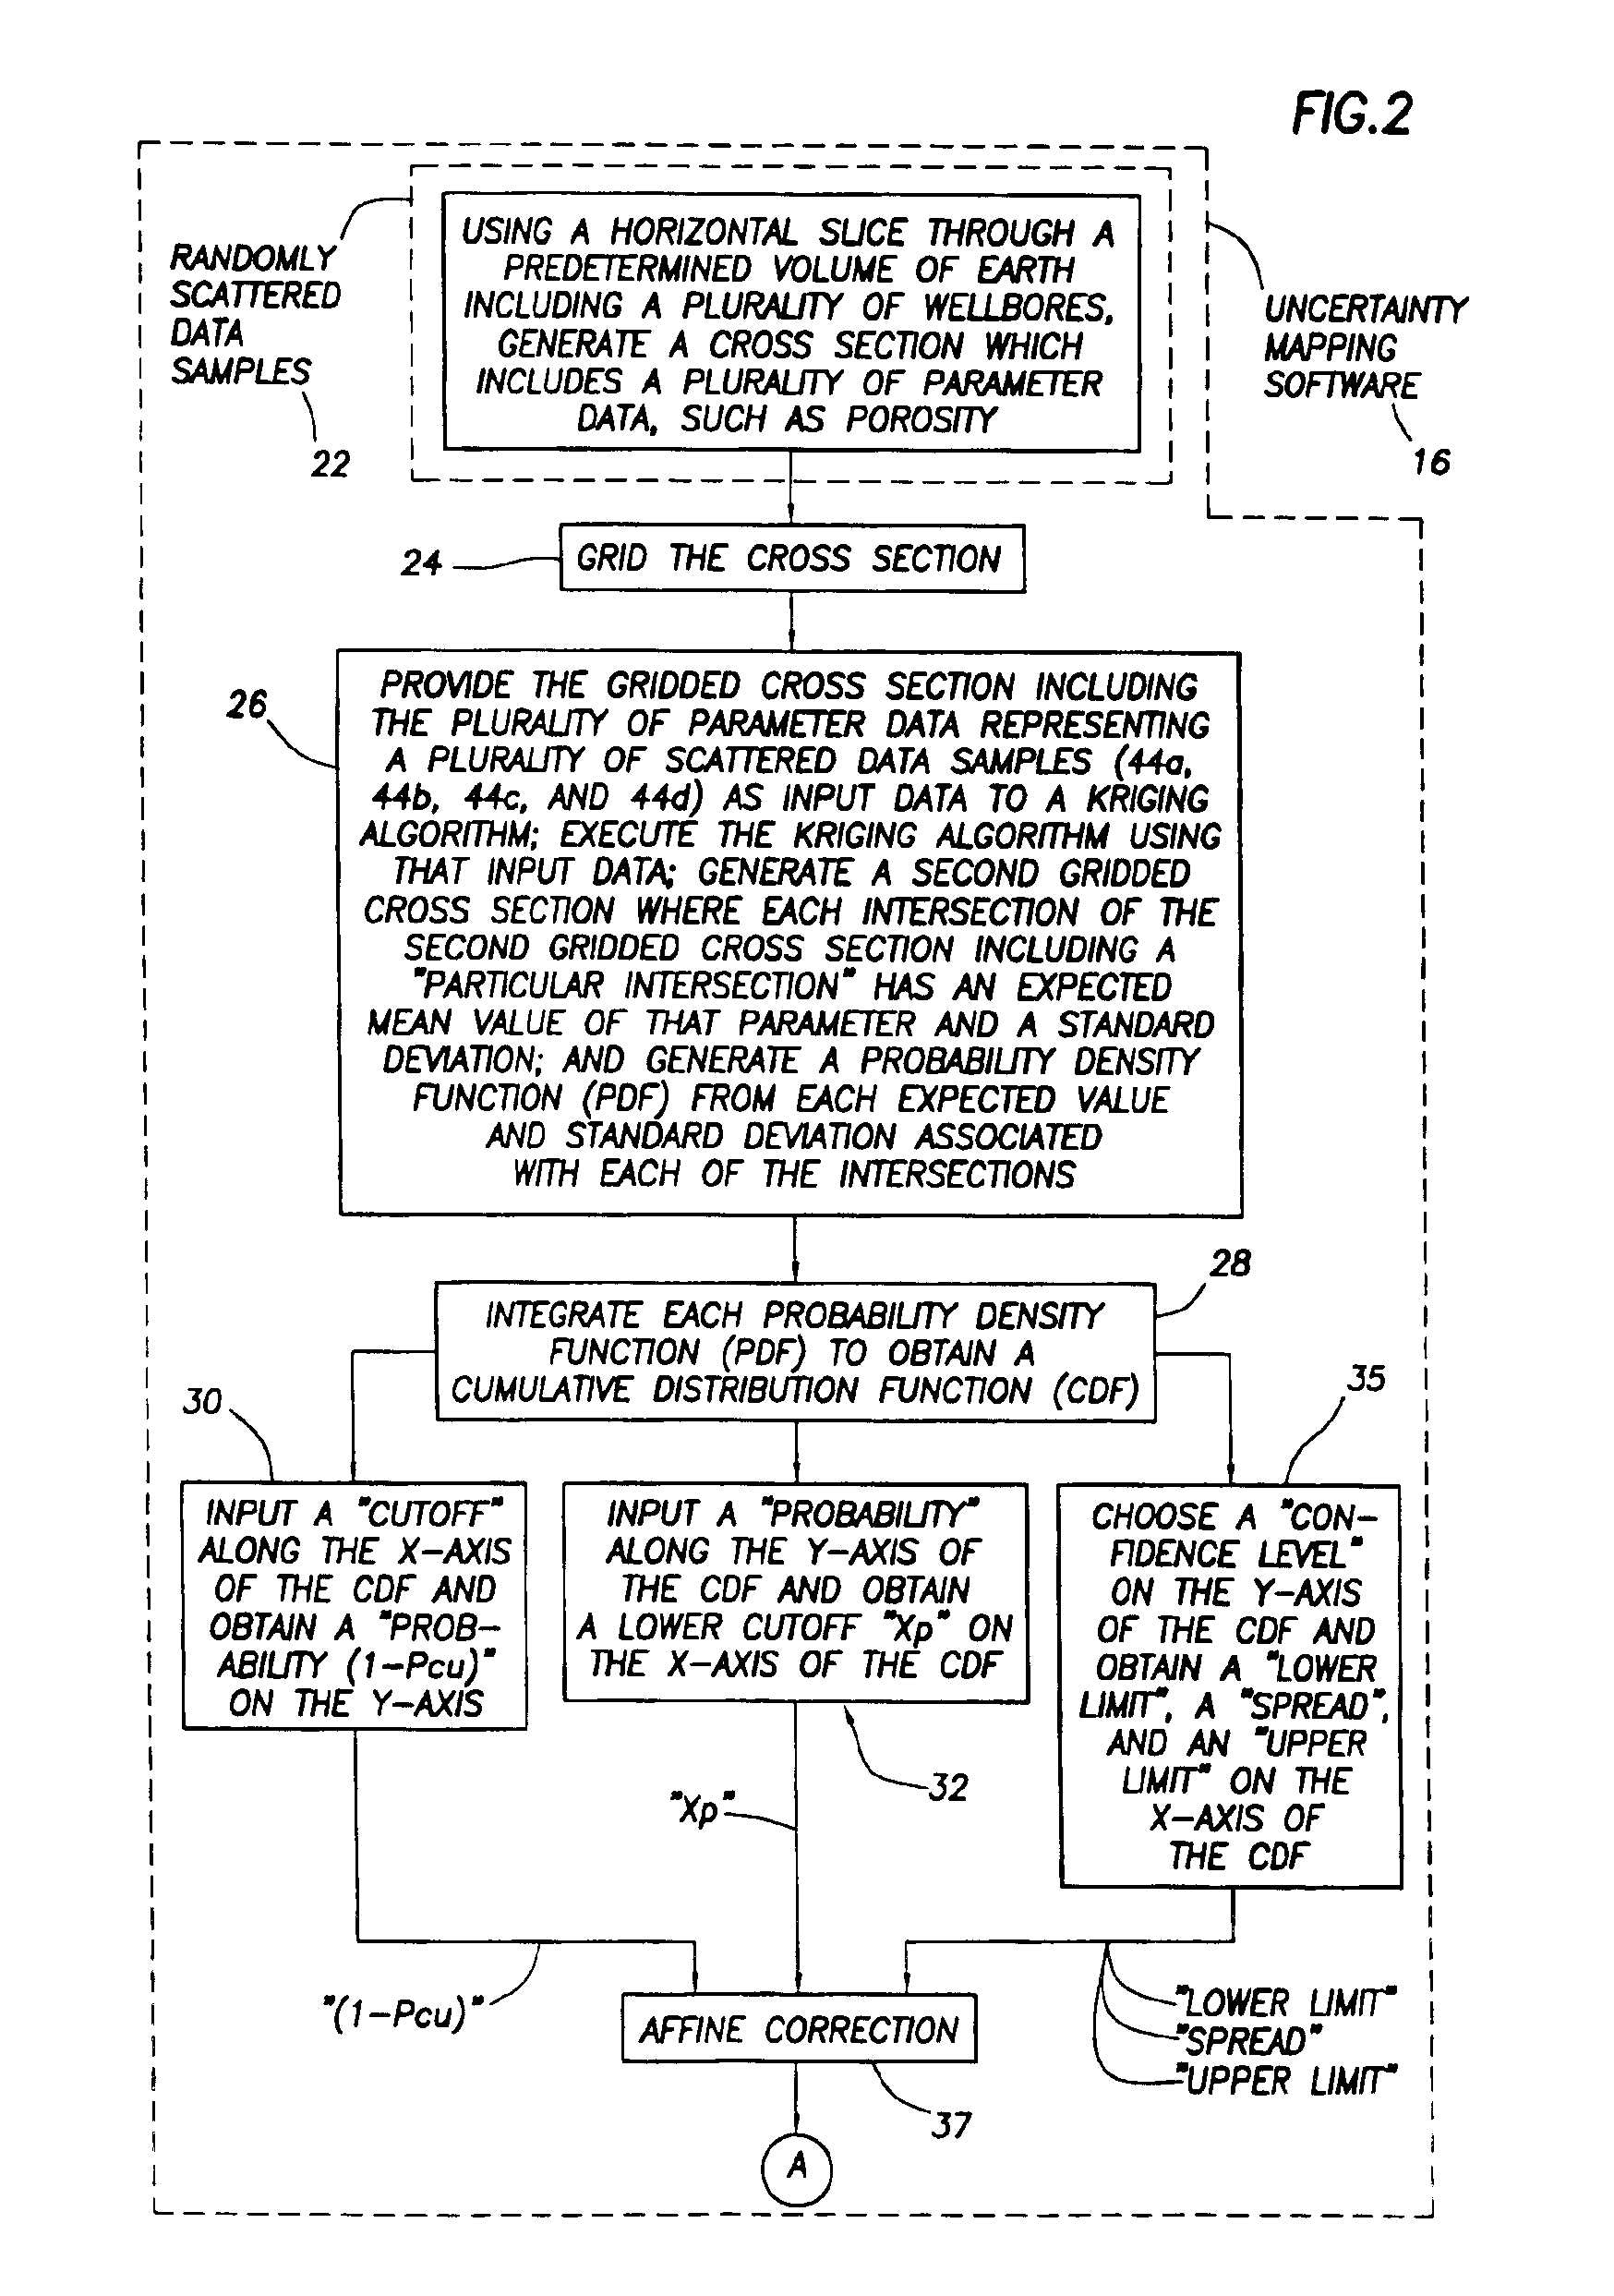
[0038]In the prior art involving Conditional Simulation, the estimation at any spatial location (x,y,z) of the value of a gaussian random variable from a set of scattered data samples is accomplished by a method known as “Kriging” [as previously mentioned, refer to either: (1) Journel, A. G. “Fundamentals of Geostatistics in Five Lessons”, Short course in Geology, vol 8, 44 pp, AGU, Washington, D.C. 1989, or (2) Deutsch, Clayton V. and Andre Journel, “GSLIB Geostatistical Software Library and User's Guide second edition”, Oxford University Press, New York, Oxford, 1998]. The result of estimating this value at a regular grid results in a smooth surface of the expected value generally following the data. If the principle of exactitude is applied, this surface will actually go through the data if the data falls on a grid location. The error variance is also calculated at each grid location. At the data locations, this error variance equals zero unless the observation error variance is ...


PUM


Abstract

A new method is presented for generating a probability map, a cutoff map, and a confidence limit map in one single operation. In addition, the new method can also generate a cube representing a cubic volume of earth formation by using the same method for generating the aforementioned maps. This is accomplished by:(a) gridding a cross section, (b) Kriging the gridded cross section thereby producing a plurality of expected values and a corresponding plurality of standard deviations associated, respectively, with the plurality of intersections on the gridded cross section, (c) generating a plurality of probability density functions which correspond, respectively, to the plurality of expected values / standard deviations of the plurality of intersections, (d) integrating each of the probability density functions thereby generating a plurality of cumulative distribution functions which correspond, respectively, to the plurality of probability density functions, (e) choosing a value from each of the cumulative distribution functions associated with each of the intersections of the gridded cross section, and (f) assigning such value to its associated intersection of the gridded cross section and assigning a unique color to each such value, thereby generating a map illustrating the characteristics of the cross section through the earth formation. Since a cube includes a plurality of gridded cross sections, by generating a map for each cross section, the new method will generate the cube.

Description

CROSS REFERENCE TO RELATED APPLICATIONS[0002]This application is a Utility application of prior pending provisional application Ser. No. 60 / 135,904, filed May 25, 1999, and entitled “Uncertainty Mapping”.BACKGROUND OF THE INVENTION[0003]The subject matter of the present invention relates to a software based method and associated apparatus for mapping uncertainty by producing one or more “maps”, such as a probability map or a cutoff map or a confidence limit map, and or one or more cubes, based on the conditional simulation of a set of random variables.[0004]The estimation at any spatial location (x, y, z) of the value of a parameter (i.e., a random variable), such as porosity or permeability, from a set of scattered observations of data representing such a parameter may be achieved by a method known as “Kriging”. For a reference which describes “Kriging”, refer to either of the following two references: (1) Journe, A. G. “Fundamentals of Geostatistics in Five Lessons”, Short course ...

Claims


Application Information

Patent Timeline
Patent Type & Authority Patents(United States)
IPC IPC(8): G06F17/18
CPCG06F17/18
Inventor VAN BEMMEL, PETER P.
Owner SCHLUMBERGER TECH CORP
Why Eureka
Try Eureka