

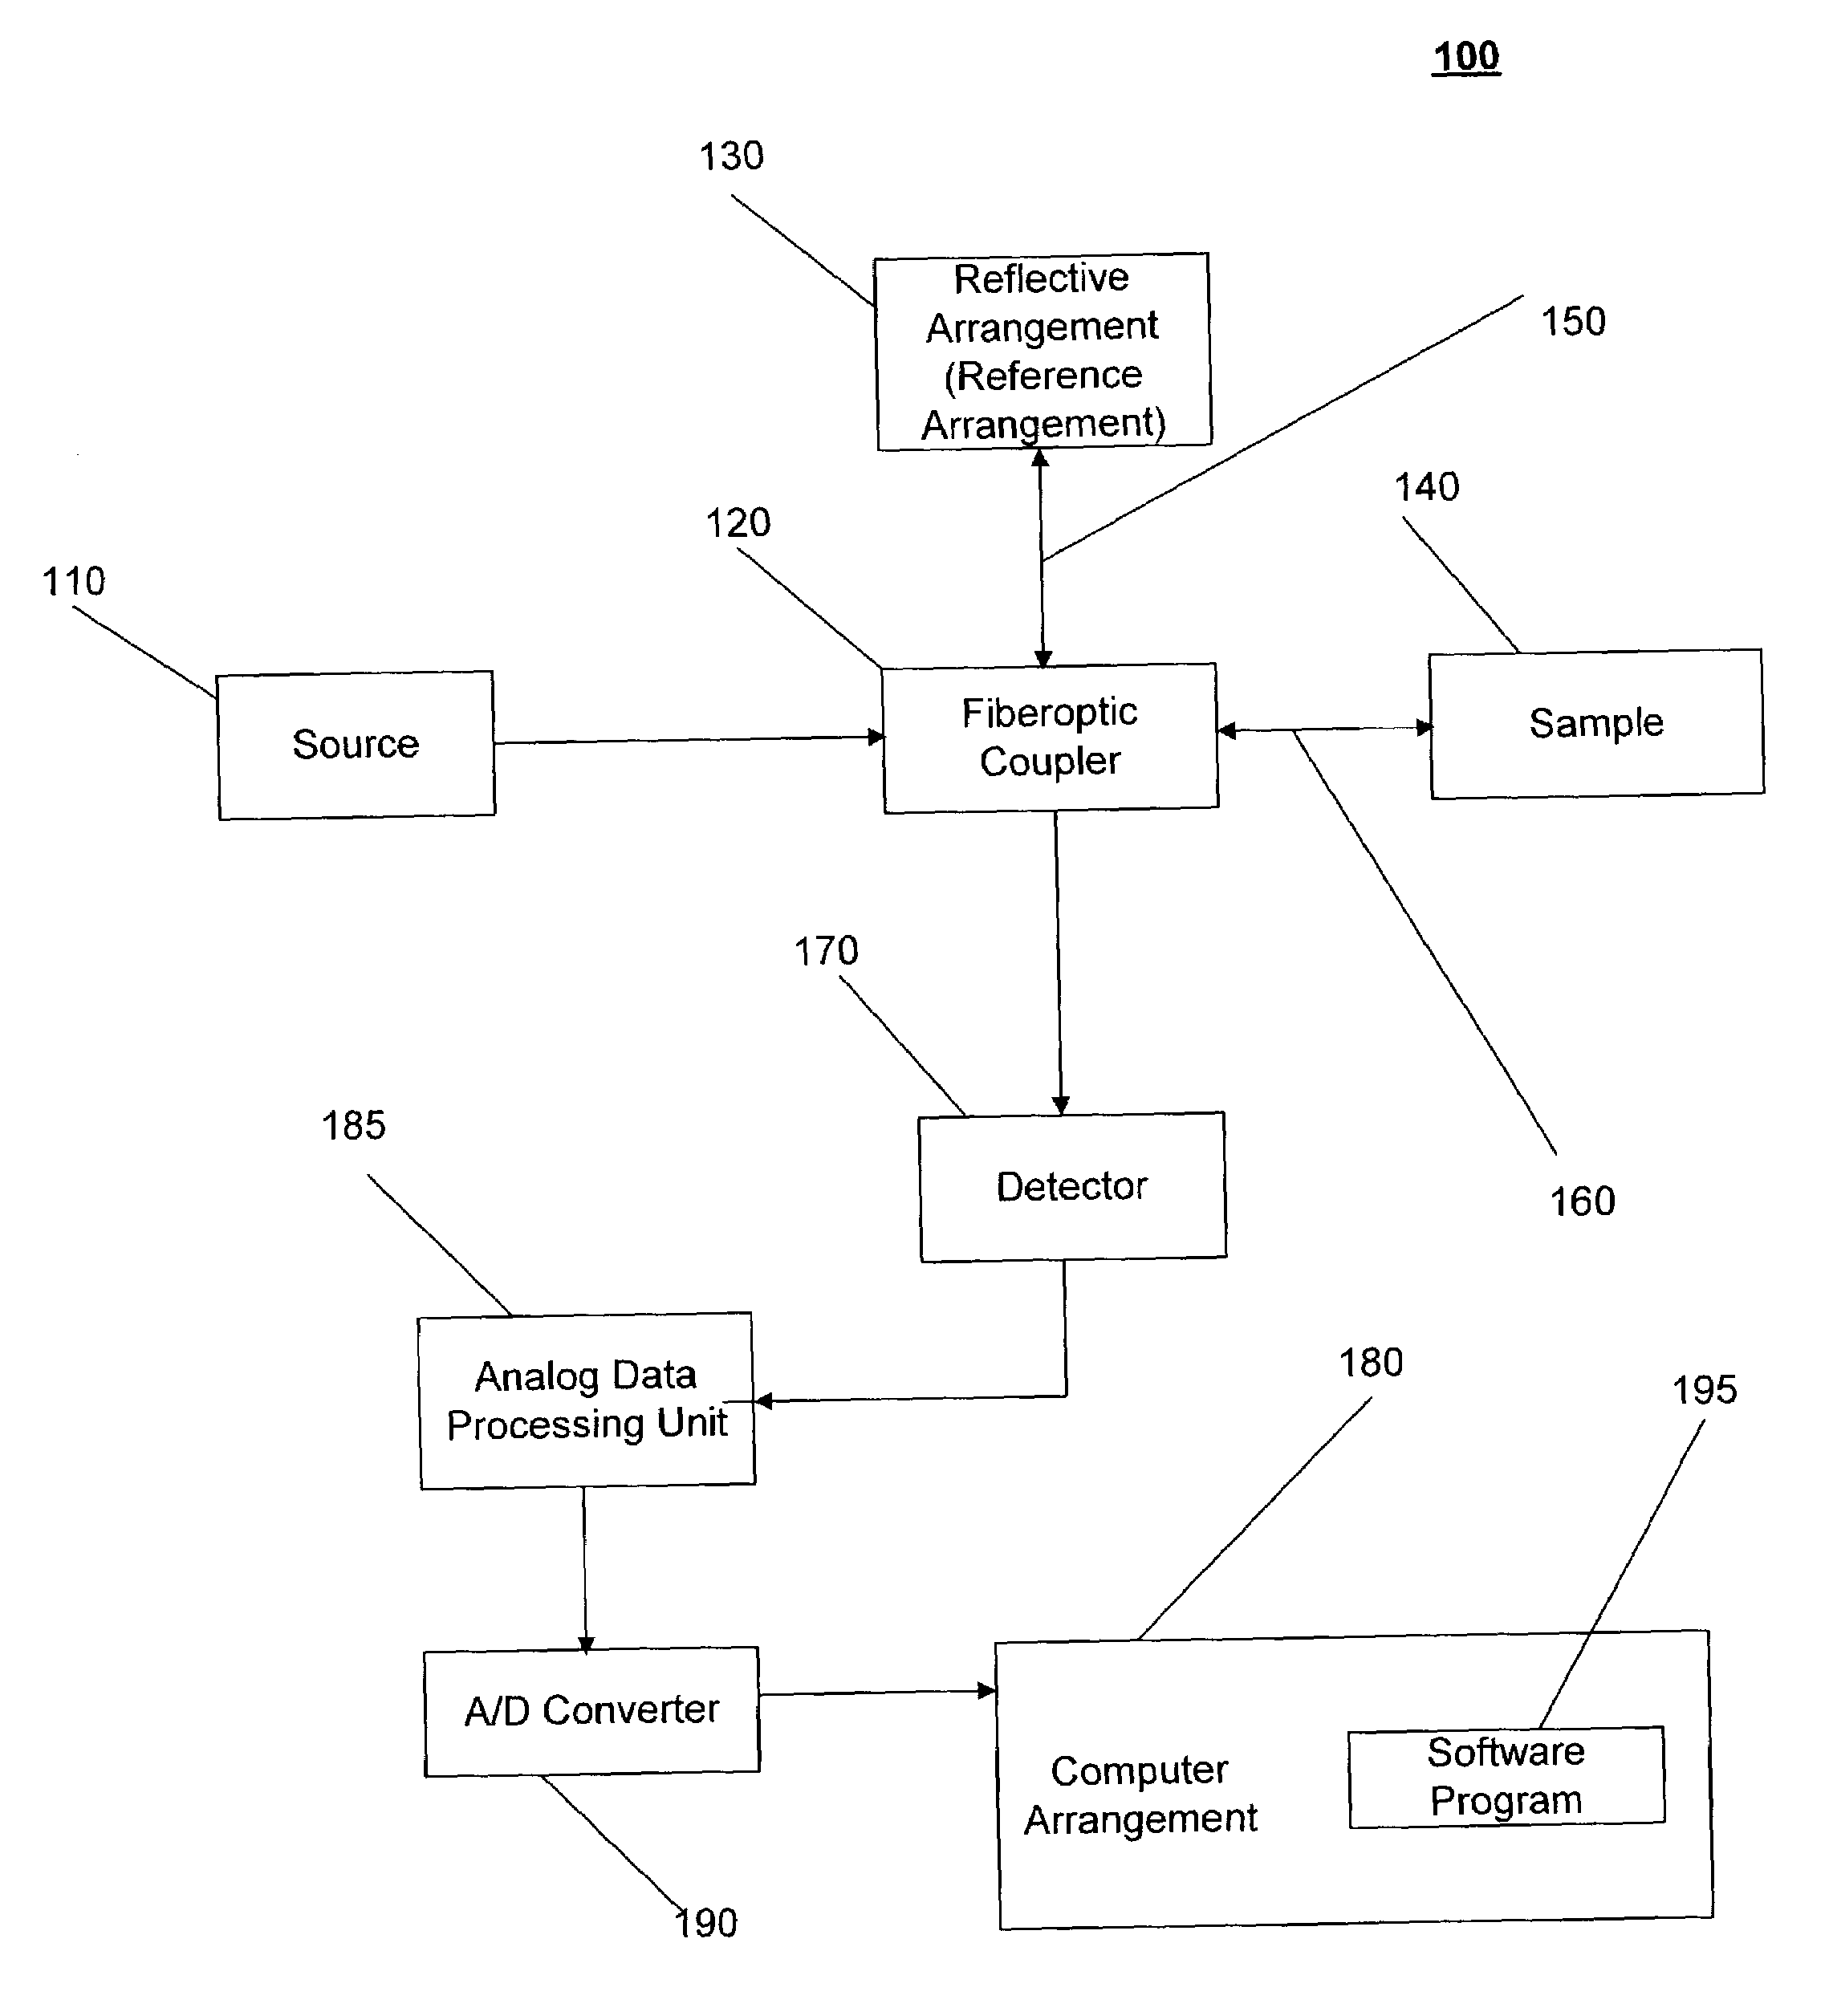
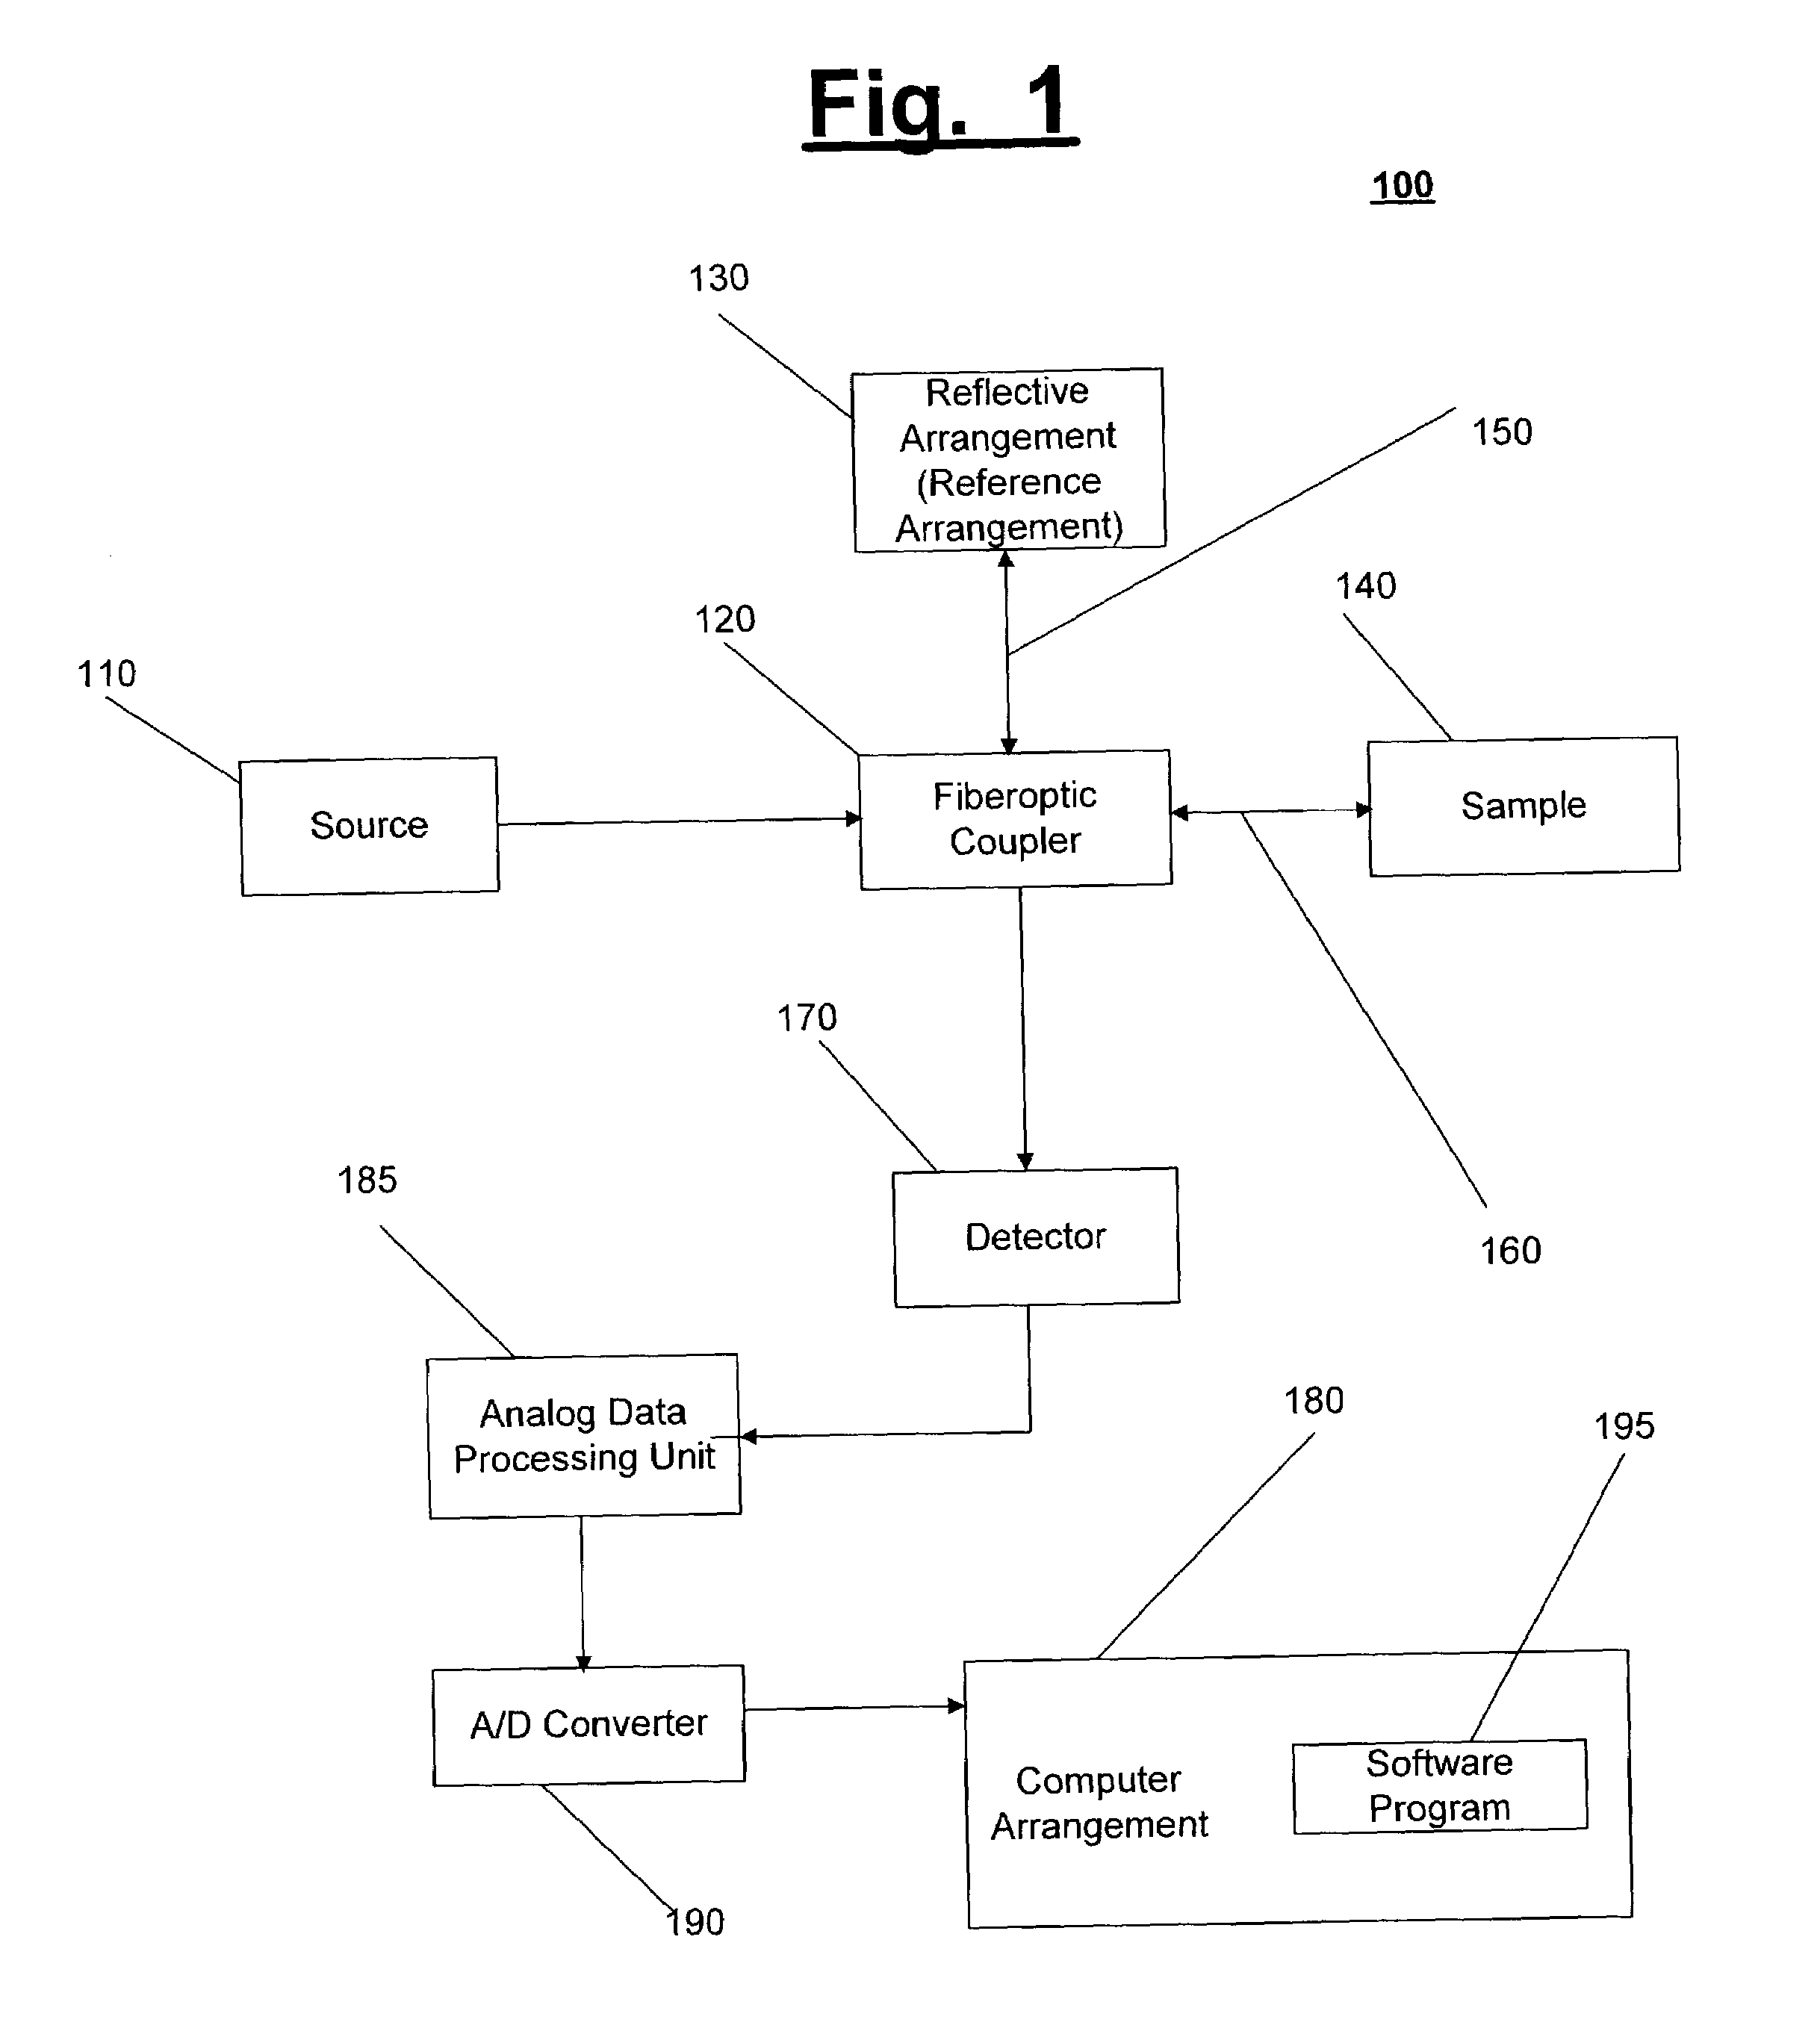
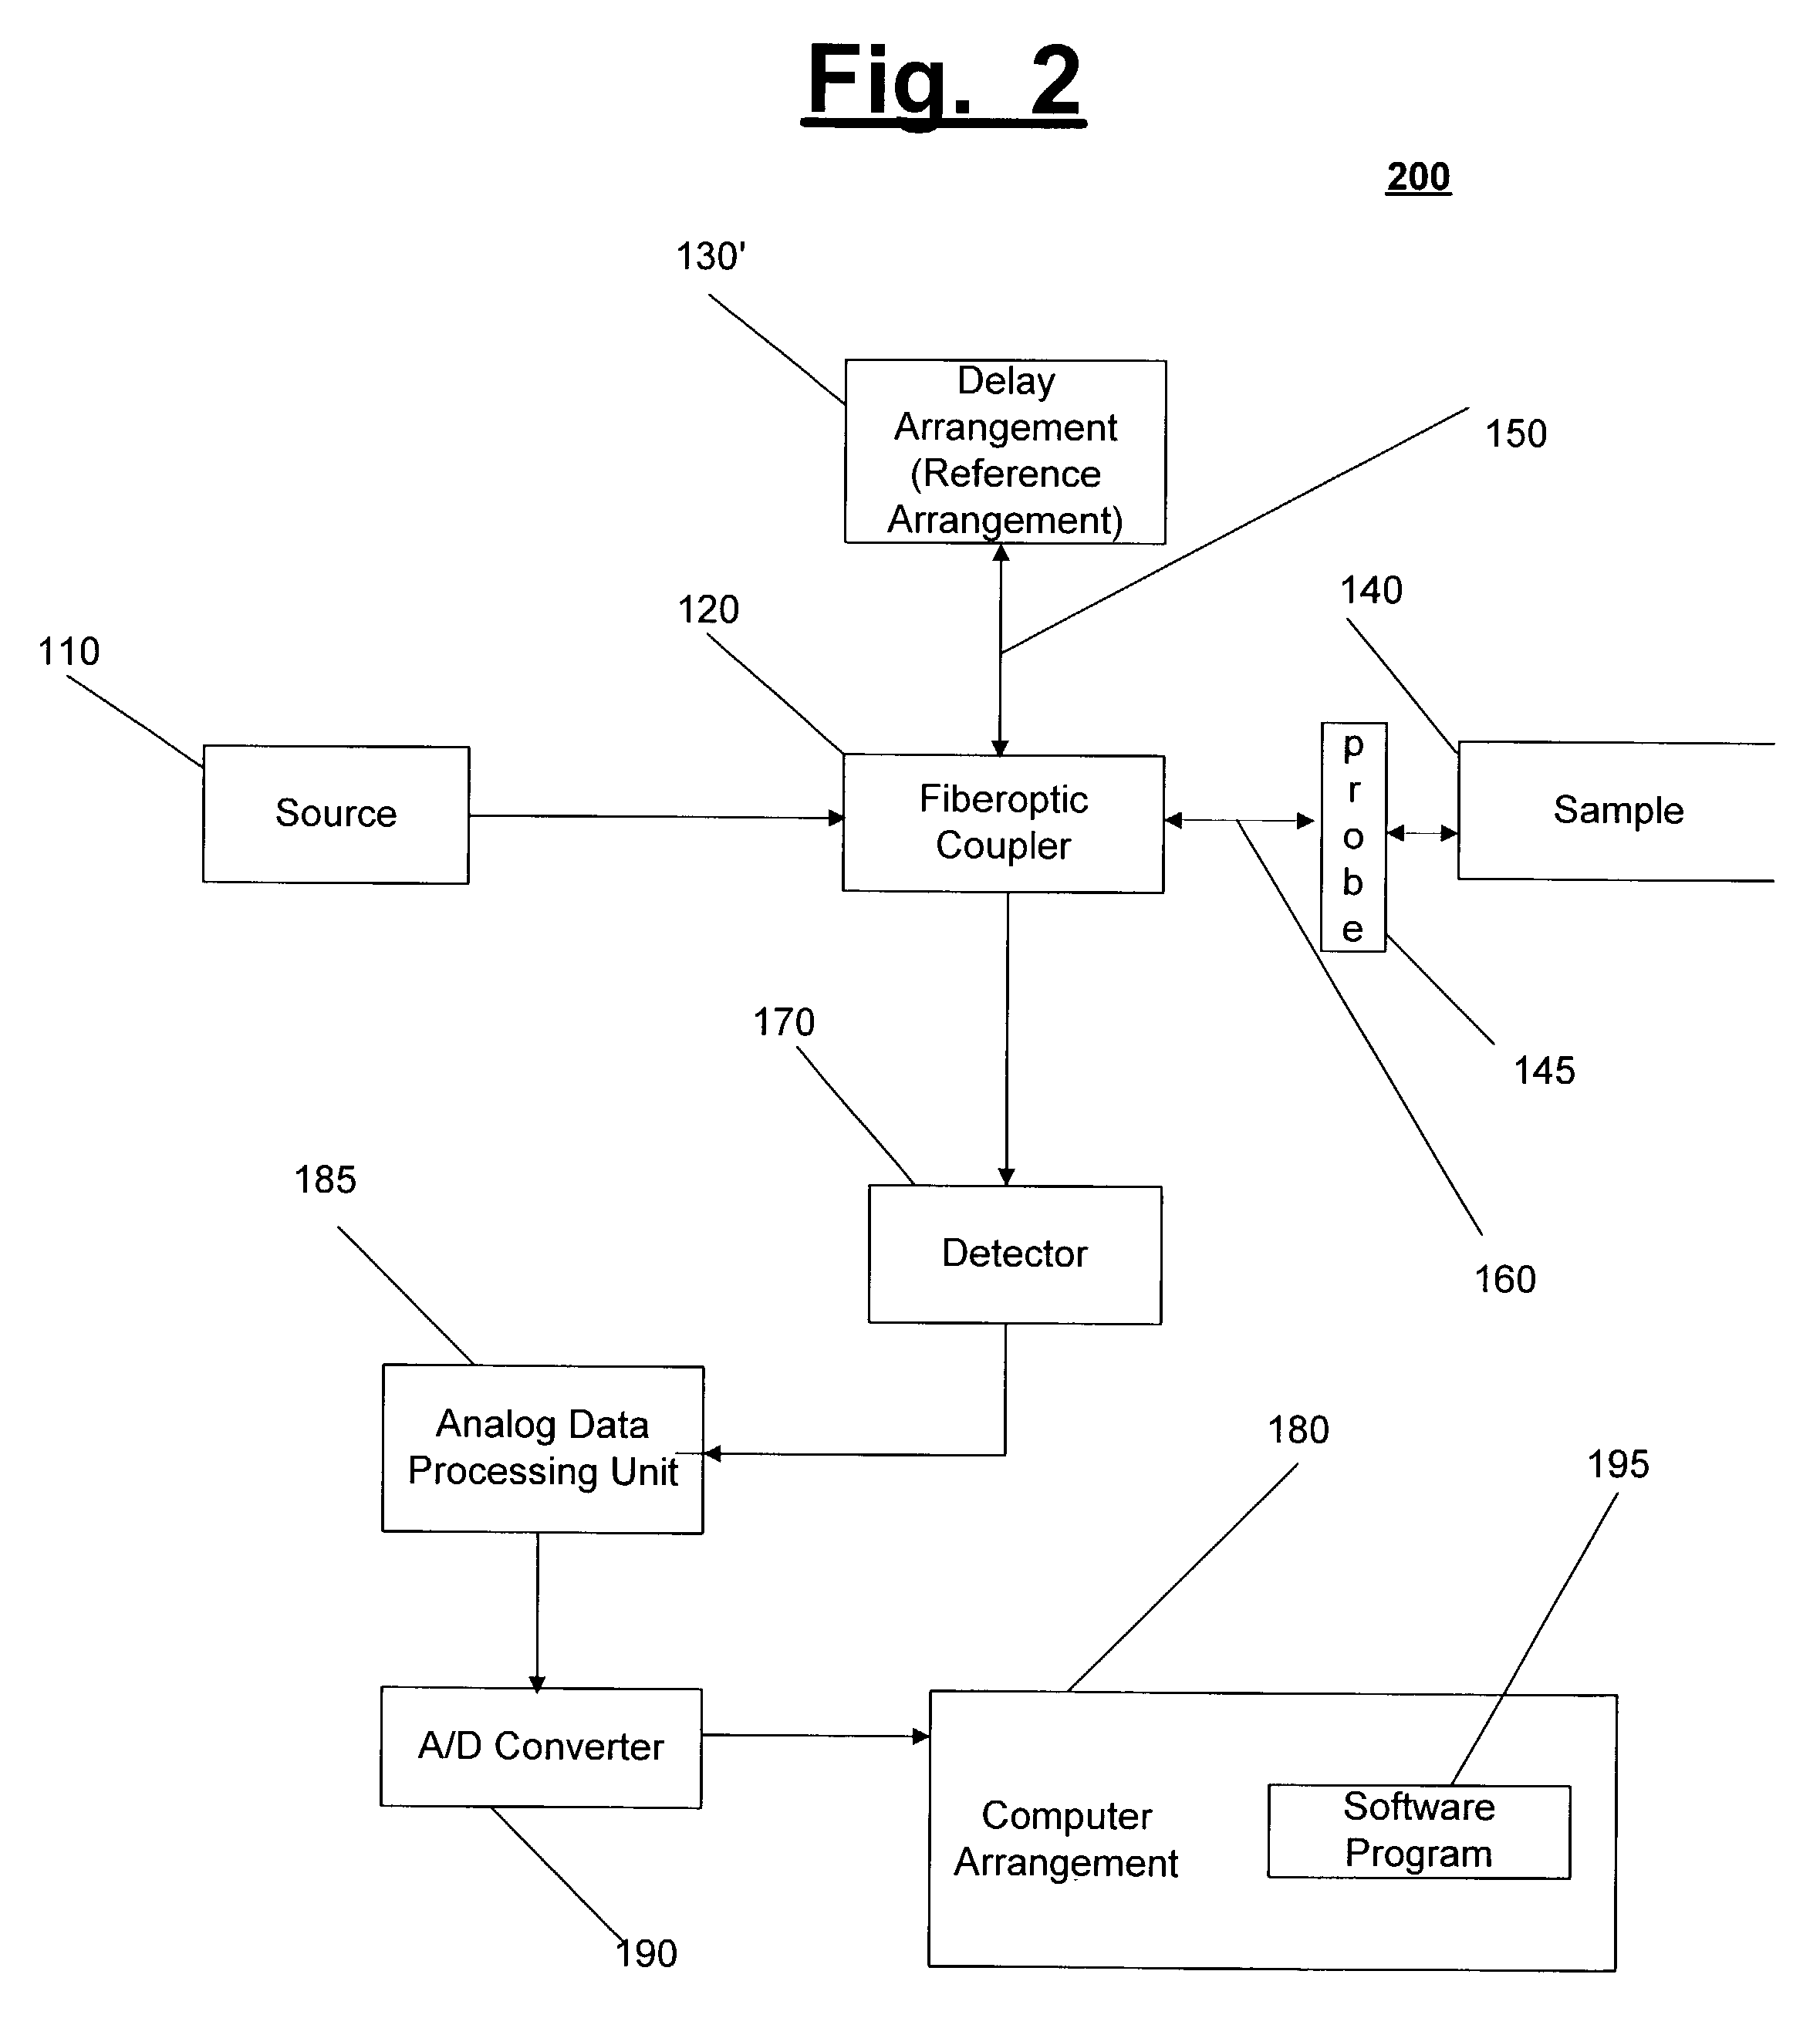
Systems and methods for imaging a sample
a sample and system technology, applied in the field of systems and methods for imaging samples, can solve the problems of gaussian structure generation, gaussian structure, and difficult manufacture of sources, and achieve the effect of modifying the distance between the fiberoptic coupler and the reference arrangement, and facilitating the manufacture of sources
- Summary
- Abstract
- Description
- Claims
- Application Information
AI Technical Summary
Benefits of technology
Problems solved by technology
Method used
Image

Examples
first embodiment
[0062]a. First Embodiment for Fast Data Processing
[0063]In an OCT system, the coherence function is preferably proportional to the real part of the Fourier transform of the source spectrum S(k),
R(Δz)∝Re∫exp(i2kΔz)S(k)dk,
with k=2π / λ being the free space wave number, and Δz=z−zi being the path length difference between reference and sample waves, respectively, for a scattering object located at zi. R(z) is the interference part of the signal detected at the photo detectors. The intensity I(z) back-scattered from the sample arm can be proportional to the square of R(z), I(z)∝R2 (z). For a Gaussian source with spectral full width at half maximum (FWHM) Δλ centered at λ0, the FWHM of the coherence envelope is given by 1c=2λ02ln2πΔλ.
[0064]For a series of scattering objects positioned at the location zi, the coherence function is given by; R(z)∝∑iRe∫exp(i2k(z-zi))S(k)ⅆk,
where R(z) is the measured interference part of the OCT signal. For the Gaussian source spectrum, the sign...
second embodiment
[0073]b. Second Embodiment for Fast Data Processing
[0074]As described above, the equations for signals R(z)sin(2k0z) and R(z)cos(2k0z) can be averaged over an interval Δz=πk0, or fractions or fractional multiples thereof. These signals can be obtained in a fast manner by multiplying the real fringe pattern R(z) by R(z)exp(i2k0z), and averaging the signal over an interval that corresponds to the desired pass band for the signal. The real and imaginary parts of the averaged signal preferably correspond to the cosine and sin terms, respectively, with the averaged signal being the desired signal. Due to the averaging process, the data can be reduced in size by summing the data over the averaging interval into a single point. Thus, the data would likely be reduced in size by a factor equal or proportional to the length of the averaging interval. A variety of weight functions could be chosen for the averaging process. Since this convolution with the weight function in the real domain corr...
PUM
 Abstract
Description
Claims
Application Information