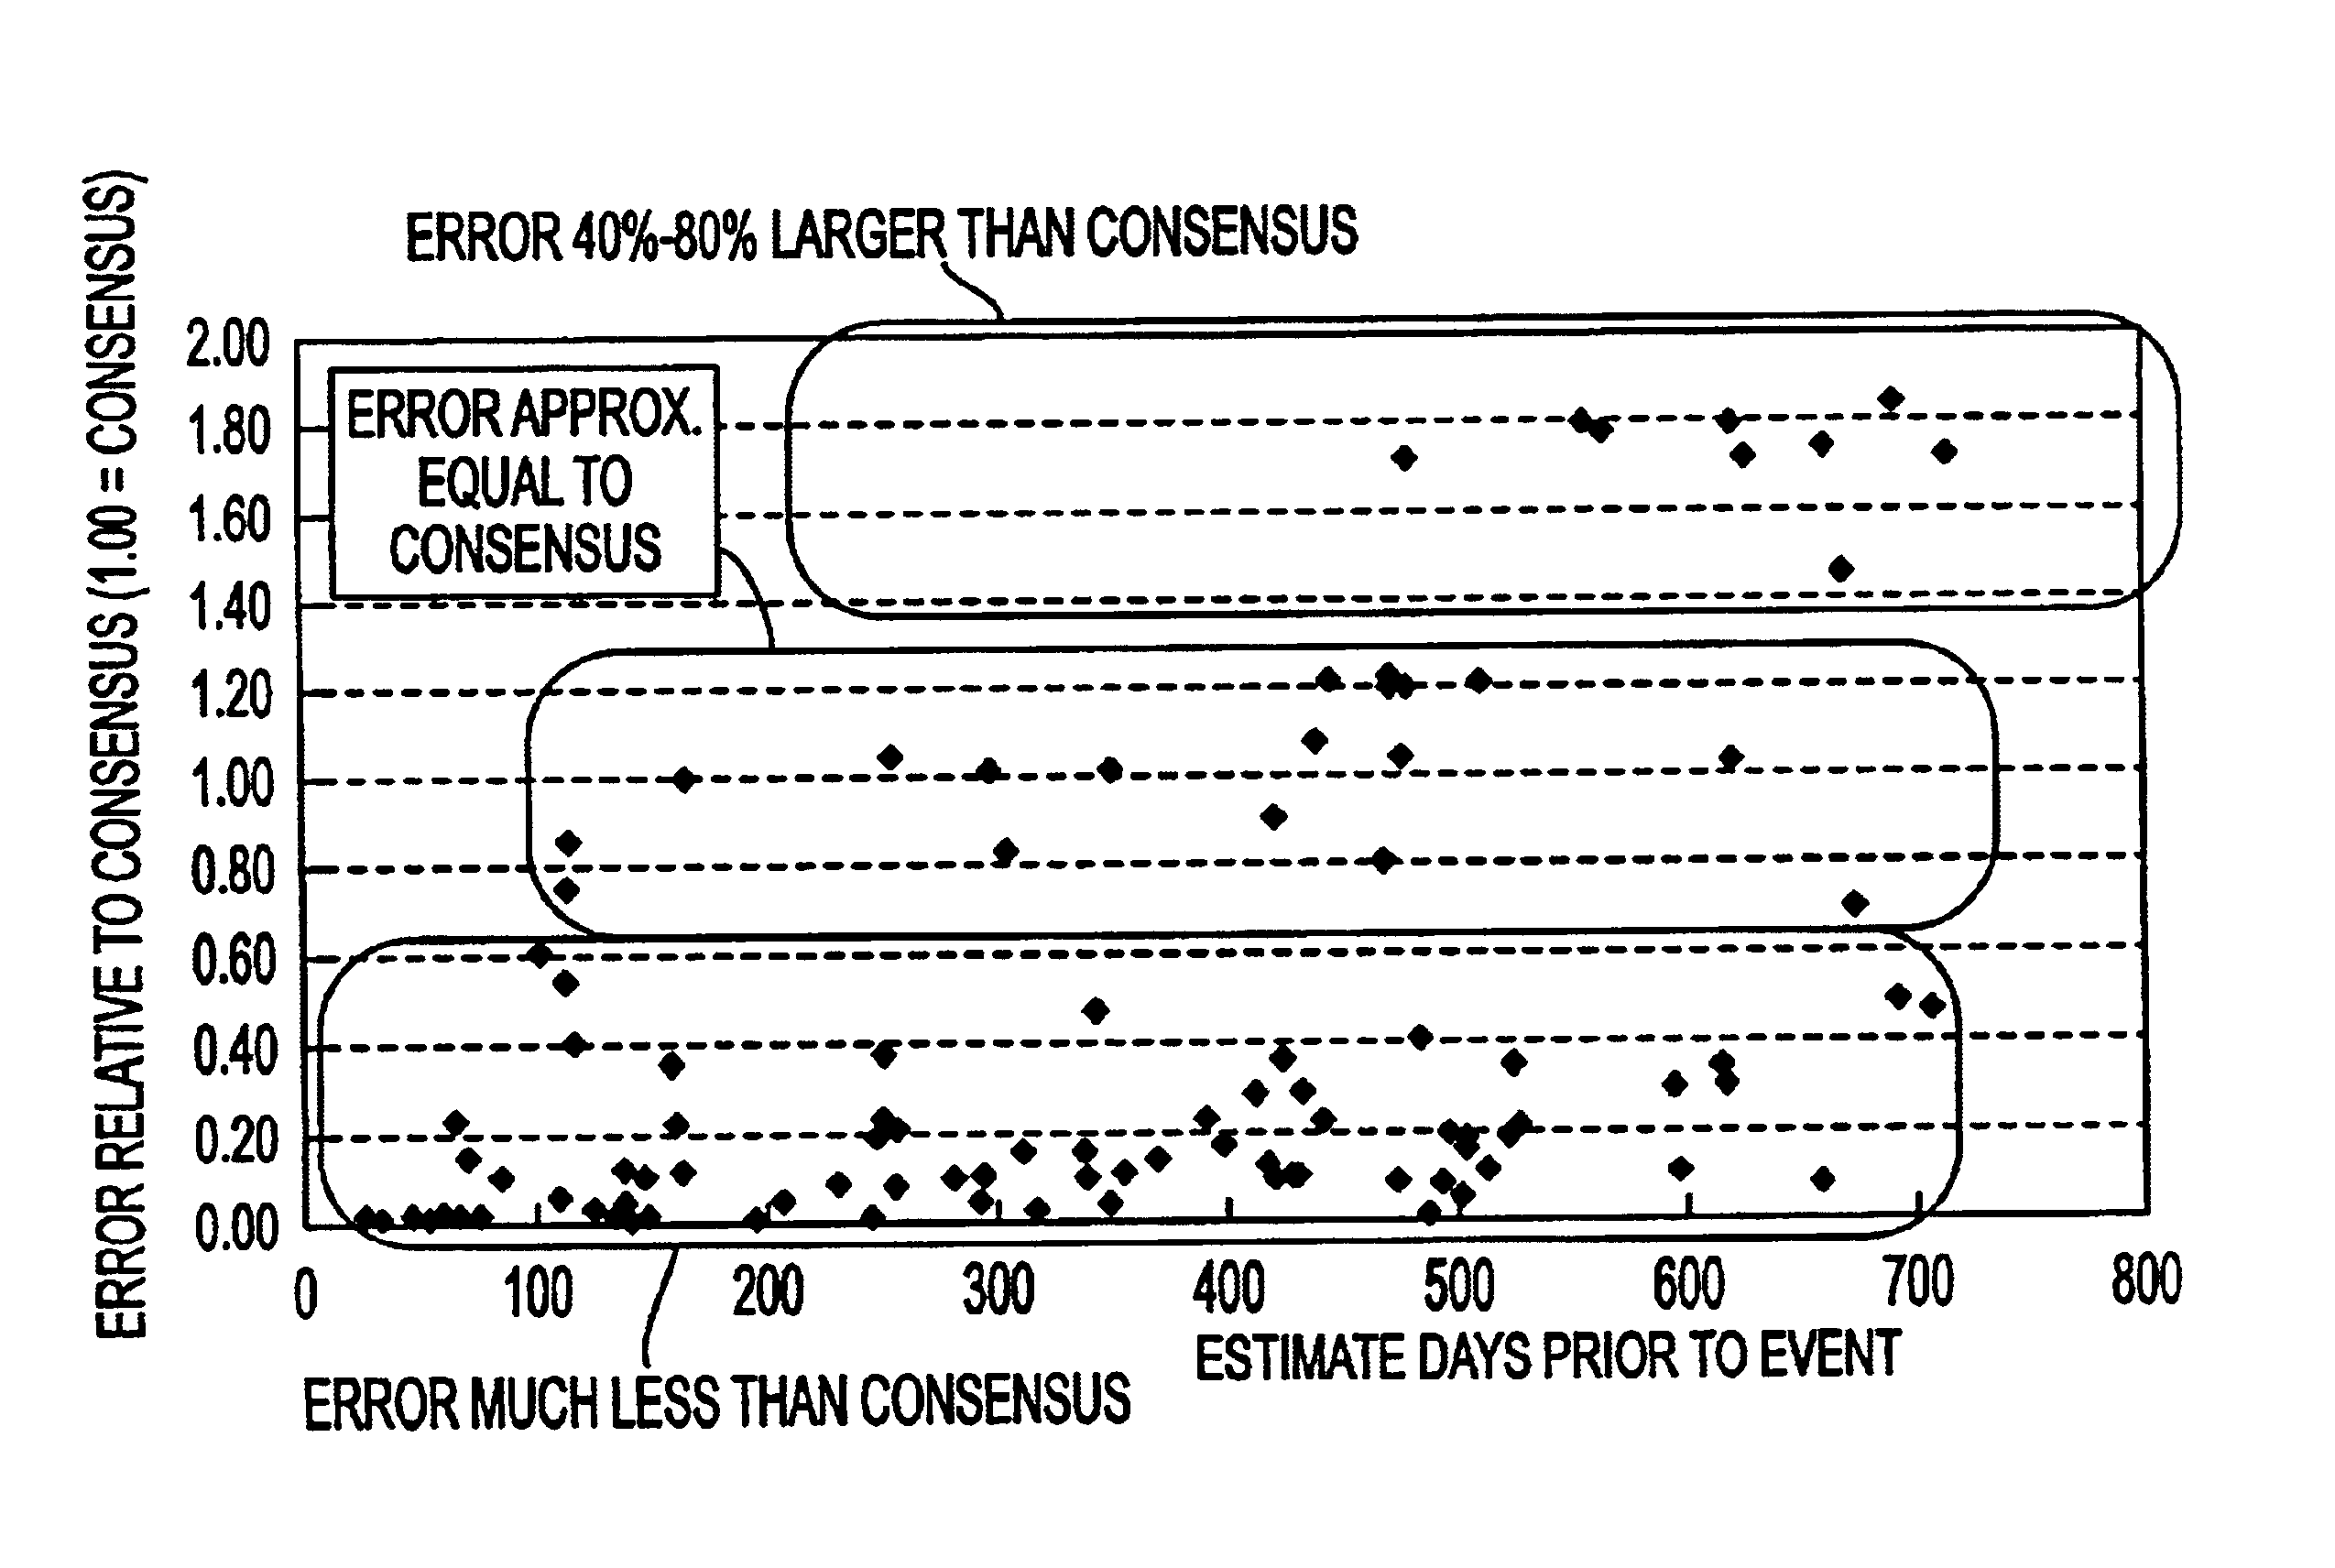
[0011]Another object of the invention is to measure and use the historical performance of an analyst's past estimates or recommendations to better predict future earnings or effectively use analysts' recommendations.
[0036]According to one embodiment, the invention allows for the rapid
visualization and analysis of analysts' estimates or recommendations by creating and maintaining indices for predetermined data relationships, pre-calculating and storing predetermined analyst performance
metrics, and calculating, compressing and storing
time series estimates and summary measures of those estimates.
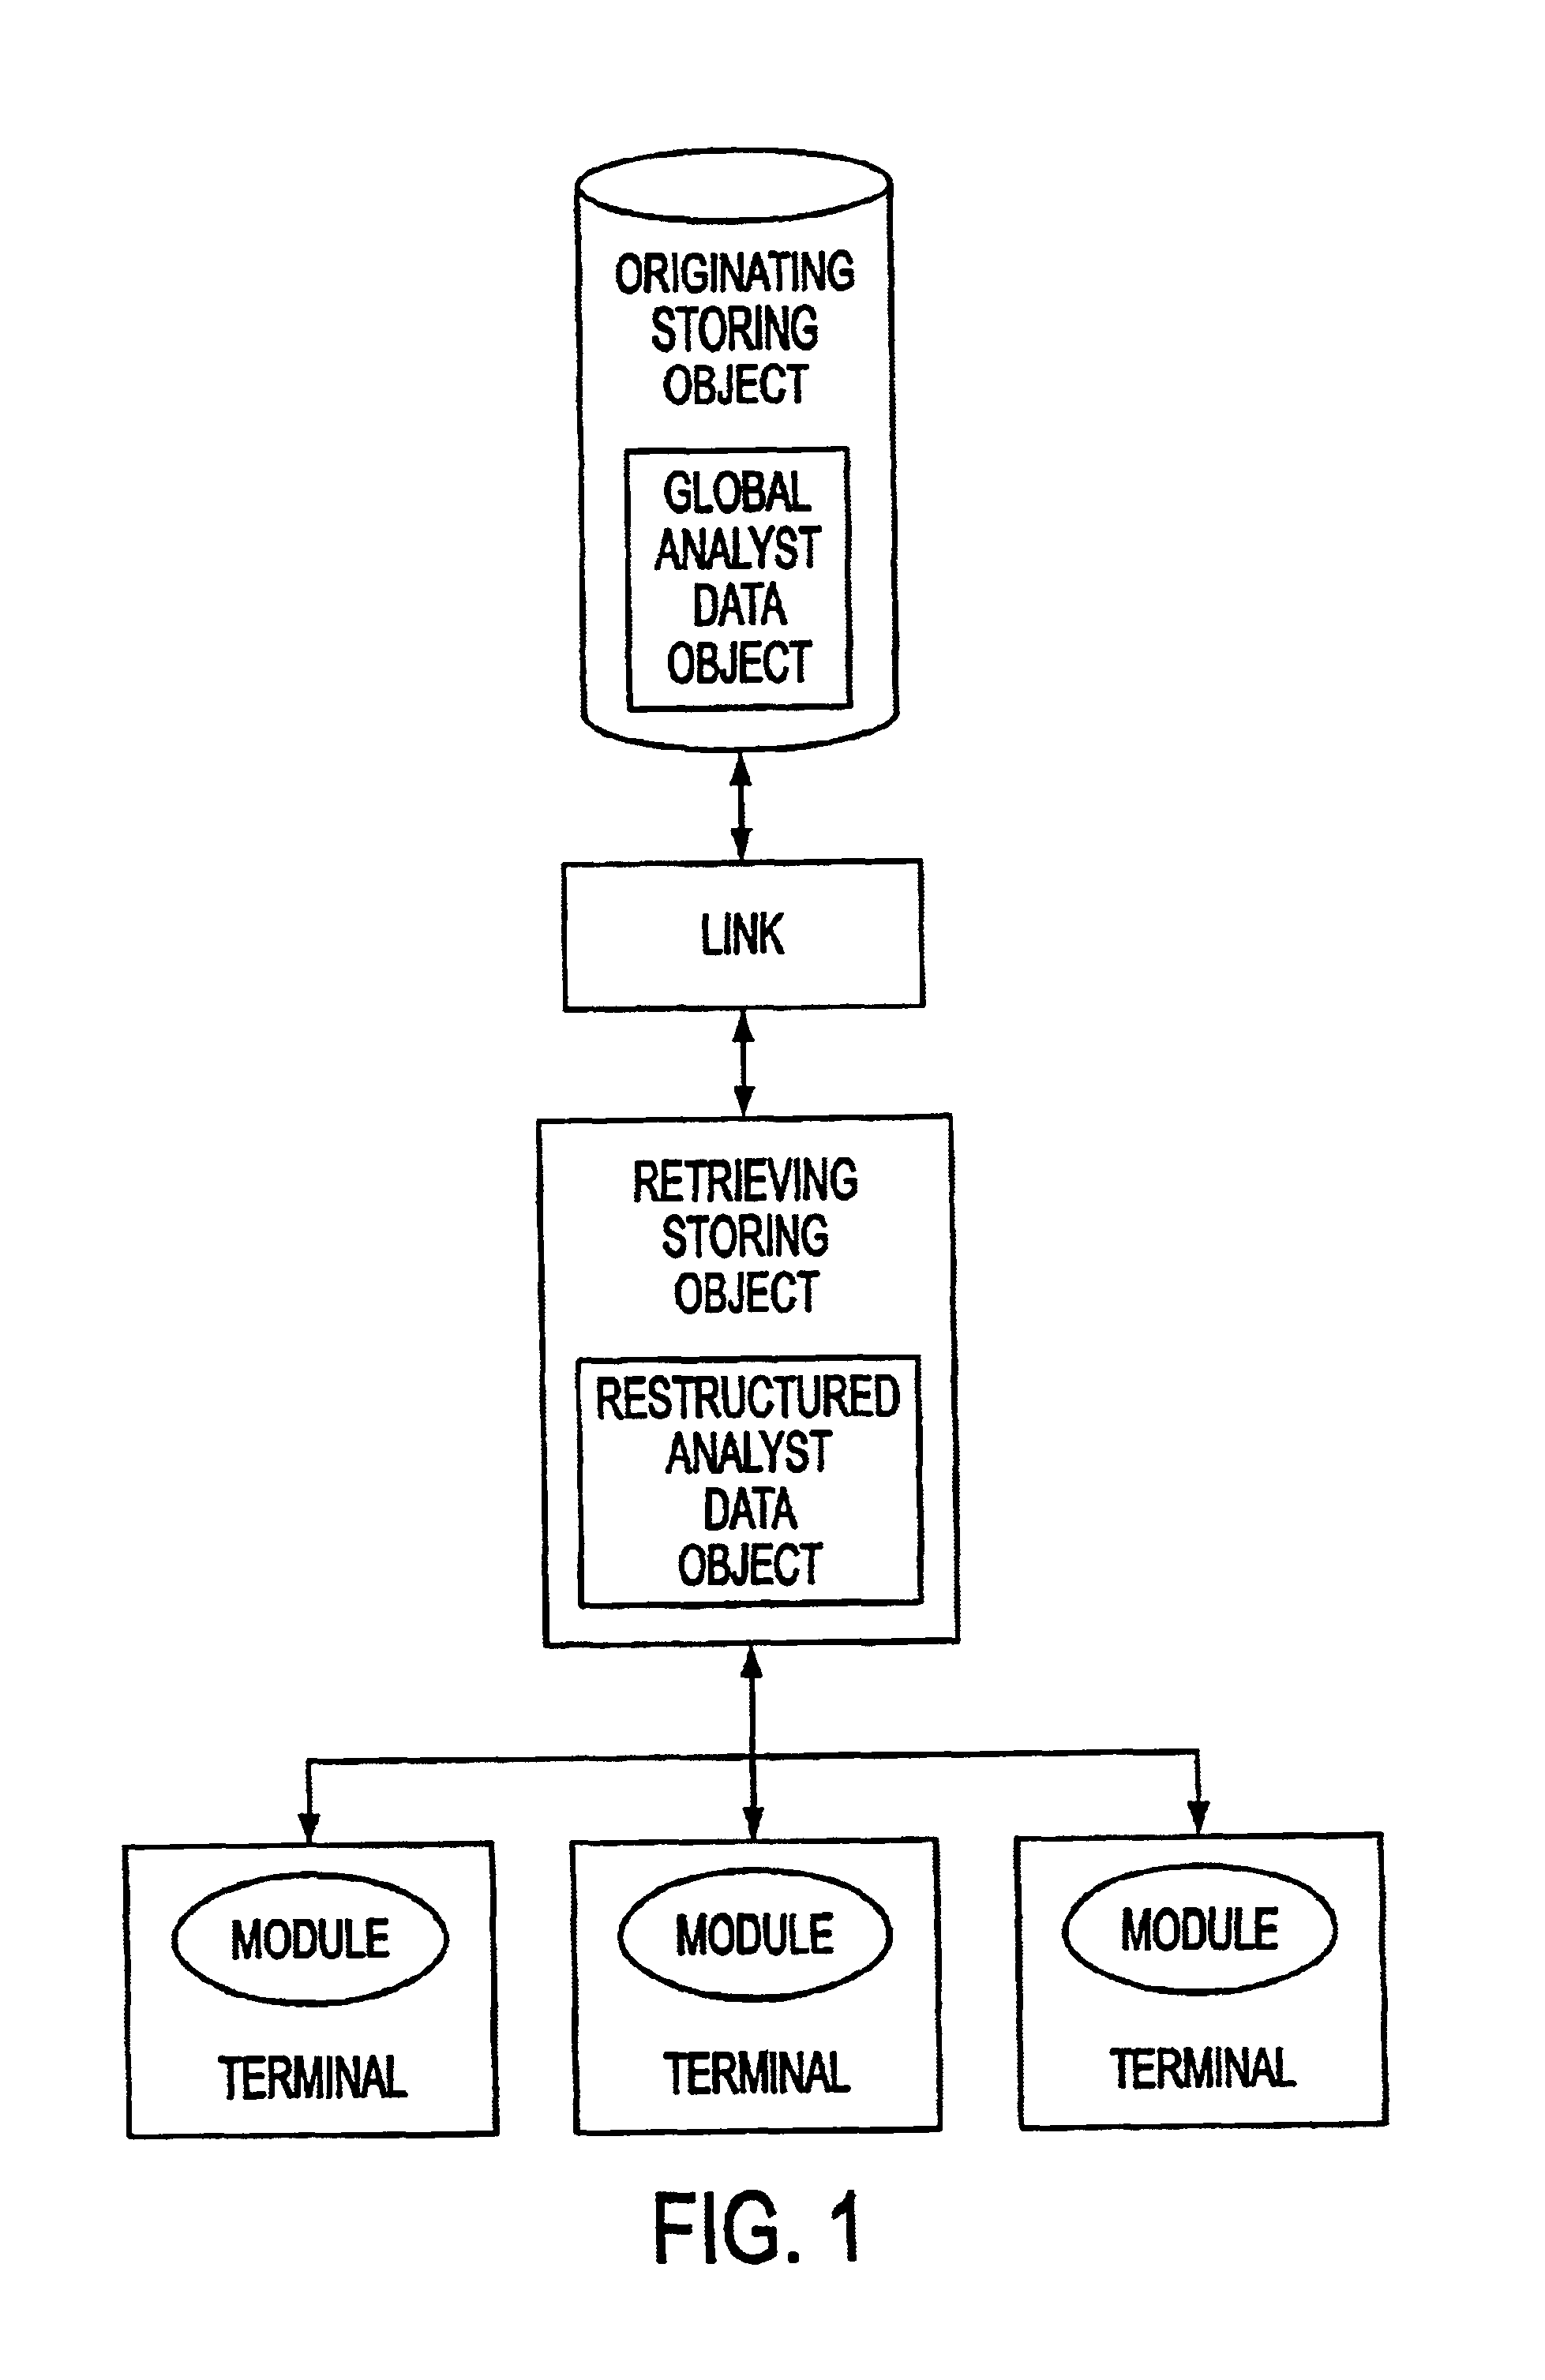
[0037]According to another aspect of the invention, a front-end
graphical user interface (GUI) is provided to facilitate analysis of analysts' prior performance for one or more securities. Preferably, the prior estimates are stored in a
database that includes, but is not limited to, fields corresponding to a security identifier for each security; a plurality of earnings events, such as, for example, the issuance of a company's actual quarterly or yearly earnings reports; earnings event dates; an analyst and broker identifier; and predetermined periods of times preceding an earnings event. Other fields and types of data also may be included. The front-end GUI will allow a user to select easily a security, earnings event, event date, Earliness Time Bin, and Contributors for analysis. The retrieved analysis information may be viewed as either
raw data or, by using a
data visualization technique, as a chart or graph.
[0039]Other levels of control may be provided including displays of derived
time series such as high estimates, mean estimates, low estimates, and / or Composite estimates with or without a simultaneous display of actual earnings. To further facilitate the viewing of such data, each estimate, whether reflecting the determination of an individual analyst or a derived estimate, may be assigned a unique color. A legend box may also be displayed simultaneously with a chart or graph that indicates which color is assigned to which estimate. Selecting an analyst or derived estimate series in the legend highlights (emboldens) the corresponding
time series in the chart. The user may show or hide individual estimate series by means of on / off controls in the legend. The user may sort the legend by analyst name, broker name, or other criteria. Advanced navigation techniques include selecting an analyst from the legend and issuing a command (e.g., from a right-click pop-up menu) to jump to a detailed display of historical performance for the selected analyst. The user has the ability to arbitrarily change the scale of viewing and can
zoom in to fill the screen with two days of information or
zoom out to see five years of information. Optionally, a chart of the selected securities prices can be displayed on a chart below the estimates chart. The horizontal (time) axes of the two chart are synchronized so that zooming one chart zooms. This technique is valuable for understanding the
impact on changes of estimates (or derived estimates) on changes in security price. Viewing historical estimates in this fashion may provide context and thus aid in the understanding of an analyst's performance track
record and estimate revision patterns. This information can be used valuably when deciding how to appraise changes in an analyst's current estimates. This information can also be used valuably in building understanding of estimate and recommendation changes in general and therefore help the user create more valuable autoweight models.
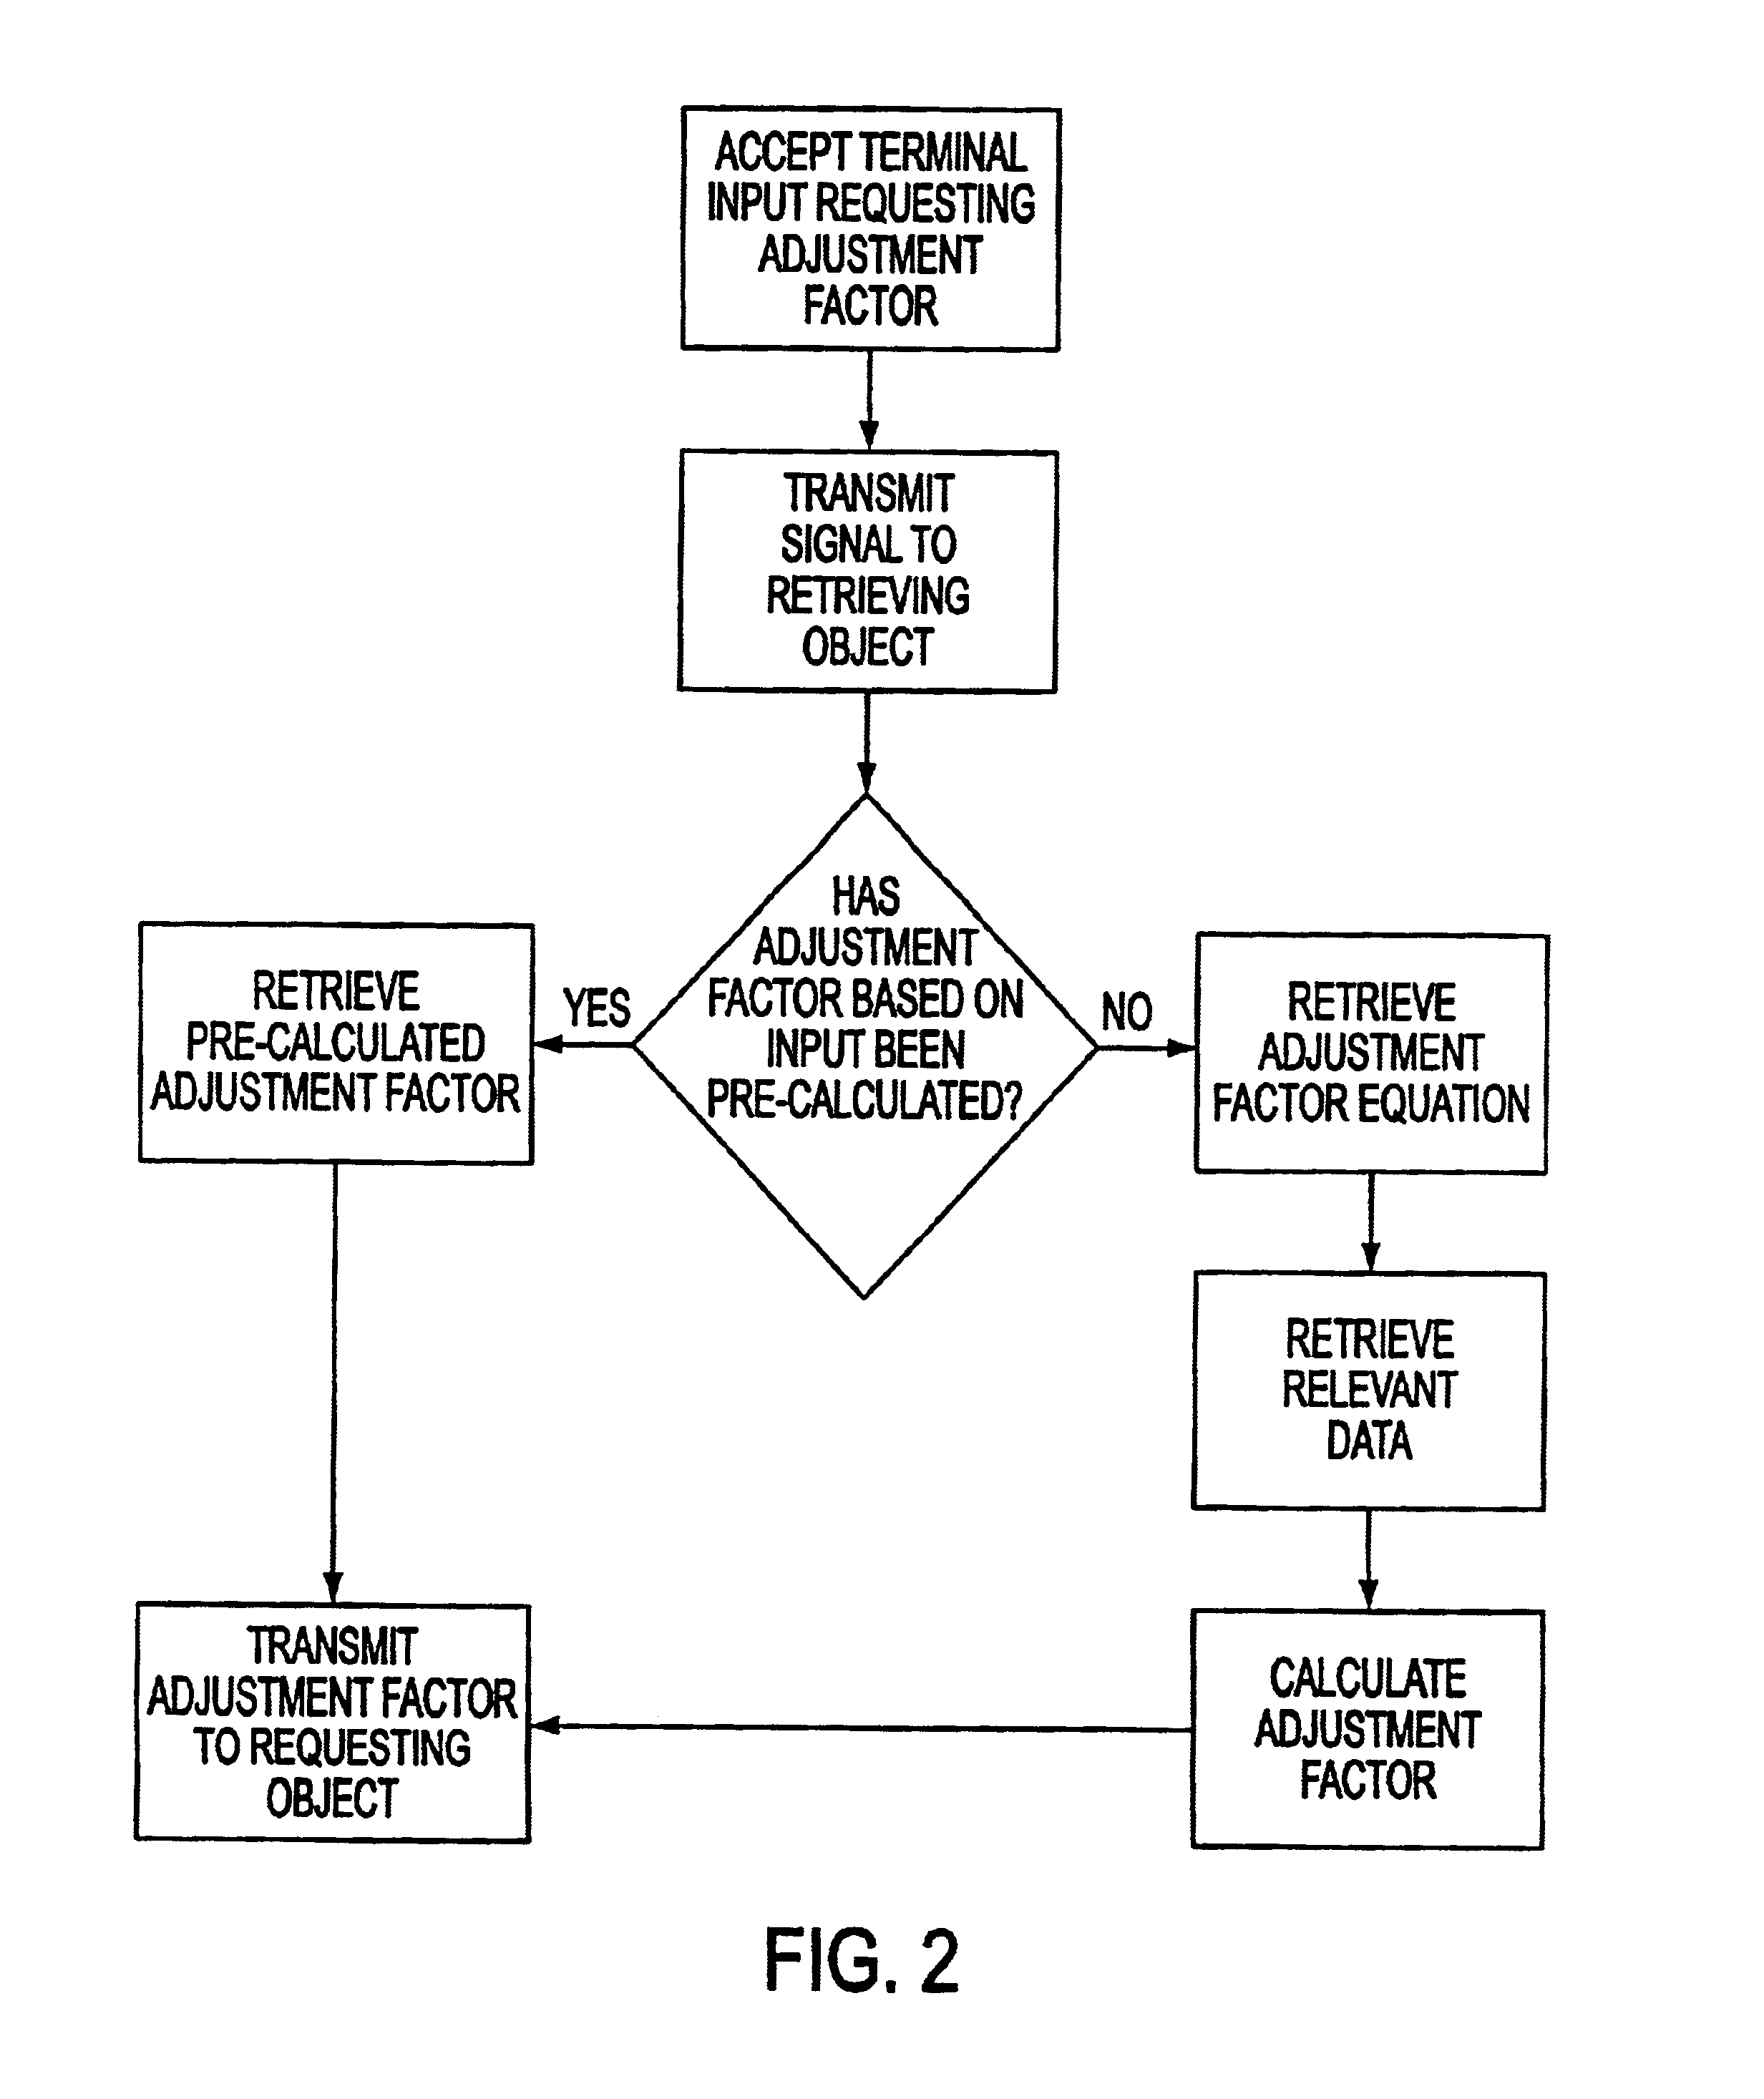
[0040]According to another embodiment of the invention, a user may rank, measure, and analyze the profitability of analysts' recommendations regarding the advisability of
purchasing, selling, or holding a particular security at any given time. More specifically, the system allows a user to control, manipulate, and otherwise refine the normalization and translation of the recommendation descriptions of individual analysts to the scales published by FISPs such as First Call or IBES, which are used generally in the financial and business communities. In addition, weighting factors, similar to the ones described above relating to earnings estimates, and / or adjustment factors may be calculated for analysts' recommendations. Therefore, the system enables a user to view an analyst's “corrected” estimate through the use of the adjustment and weighting factor. The system also enables a user to compare and chart the profitability of following the recommendation of one analyst versus that of another analyst or the average recommendation. In addition, users may create portfolio-creation rules to determine when and how much of a security to buy or sell and, furthermore, to track the value and test the profitability of having carried out such rules for a single or plurality of analysts over any given time period.

