Method and device for measuring plasticity of materials such as ceramic raw materials and masses

US7062951B2Inactive Publication Date: 2006-06-20BRABENDER GMBH
6 Cites 2 Cited by

Patent Information

Authority / Receiving Office
US · United States
Current Assignee / Owner
Publication Date
2006-06-20
Estimated Expiration
Not applicable · inactive patent

Smart Images

  • Figure 1
    Figure 1
  • Figure 2
    Figure 2
  • Figure 3
    Figure 3
Patent Text Reader

Abstract

A method for measuring the plasticity of materials such as ceramic raw materials and masses. A weight acts on a sample body and a path signal that reproduces the deformation of the sample body is measured. During the deformation process, the time progression of a reaction force applied by the sample body is measured. Path and force measurement values are passed to a computer for processing and evaluation. Devices for measuring the plasticity of a material according to the method are also disclosed.
Need to check novelty before this filing date? Find Prior Art

Description

CROSS REFERENCE TO RELATED APPLICATIONS

[0001] Applicant claims priority under 35 U.S.C. §119 of GERMAN Application Nos. 103 20 578.0 filed on May 7, 2003 and 103 25 958.9 filed on Jun. 7, 2003.BACKGROUND OF THE INVENTION

[0002] 1. Field of the Invention

[0003] The invention relates to methods for measuring the plasticity of materials such as ceramic raw materials and masses. Furthermore, the invention relates to a device for implementing such methods.

[0004] 2. The Prior Art

[0005] The term plasticity of a ceramic raw material or a ceramic mass is understood to mean the capacity of the ceramic raw material or mass to deform under the effect of external forces, without losing the cohesiveness of its particles. Another characteristic of plasticity is that irreversible deformation occurs only if the external force has exceeded a minimum value, known as the yield value. Forces below the yield value cause only elastic, reversible deformation.

[0006] In the case of clay / water mixtures, plastic defor...

Examples

Embodiment Construction

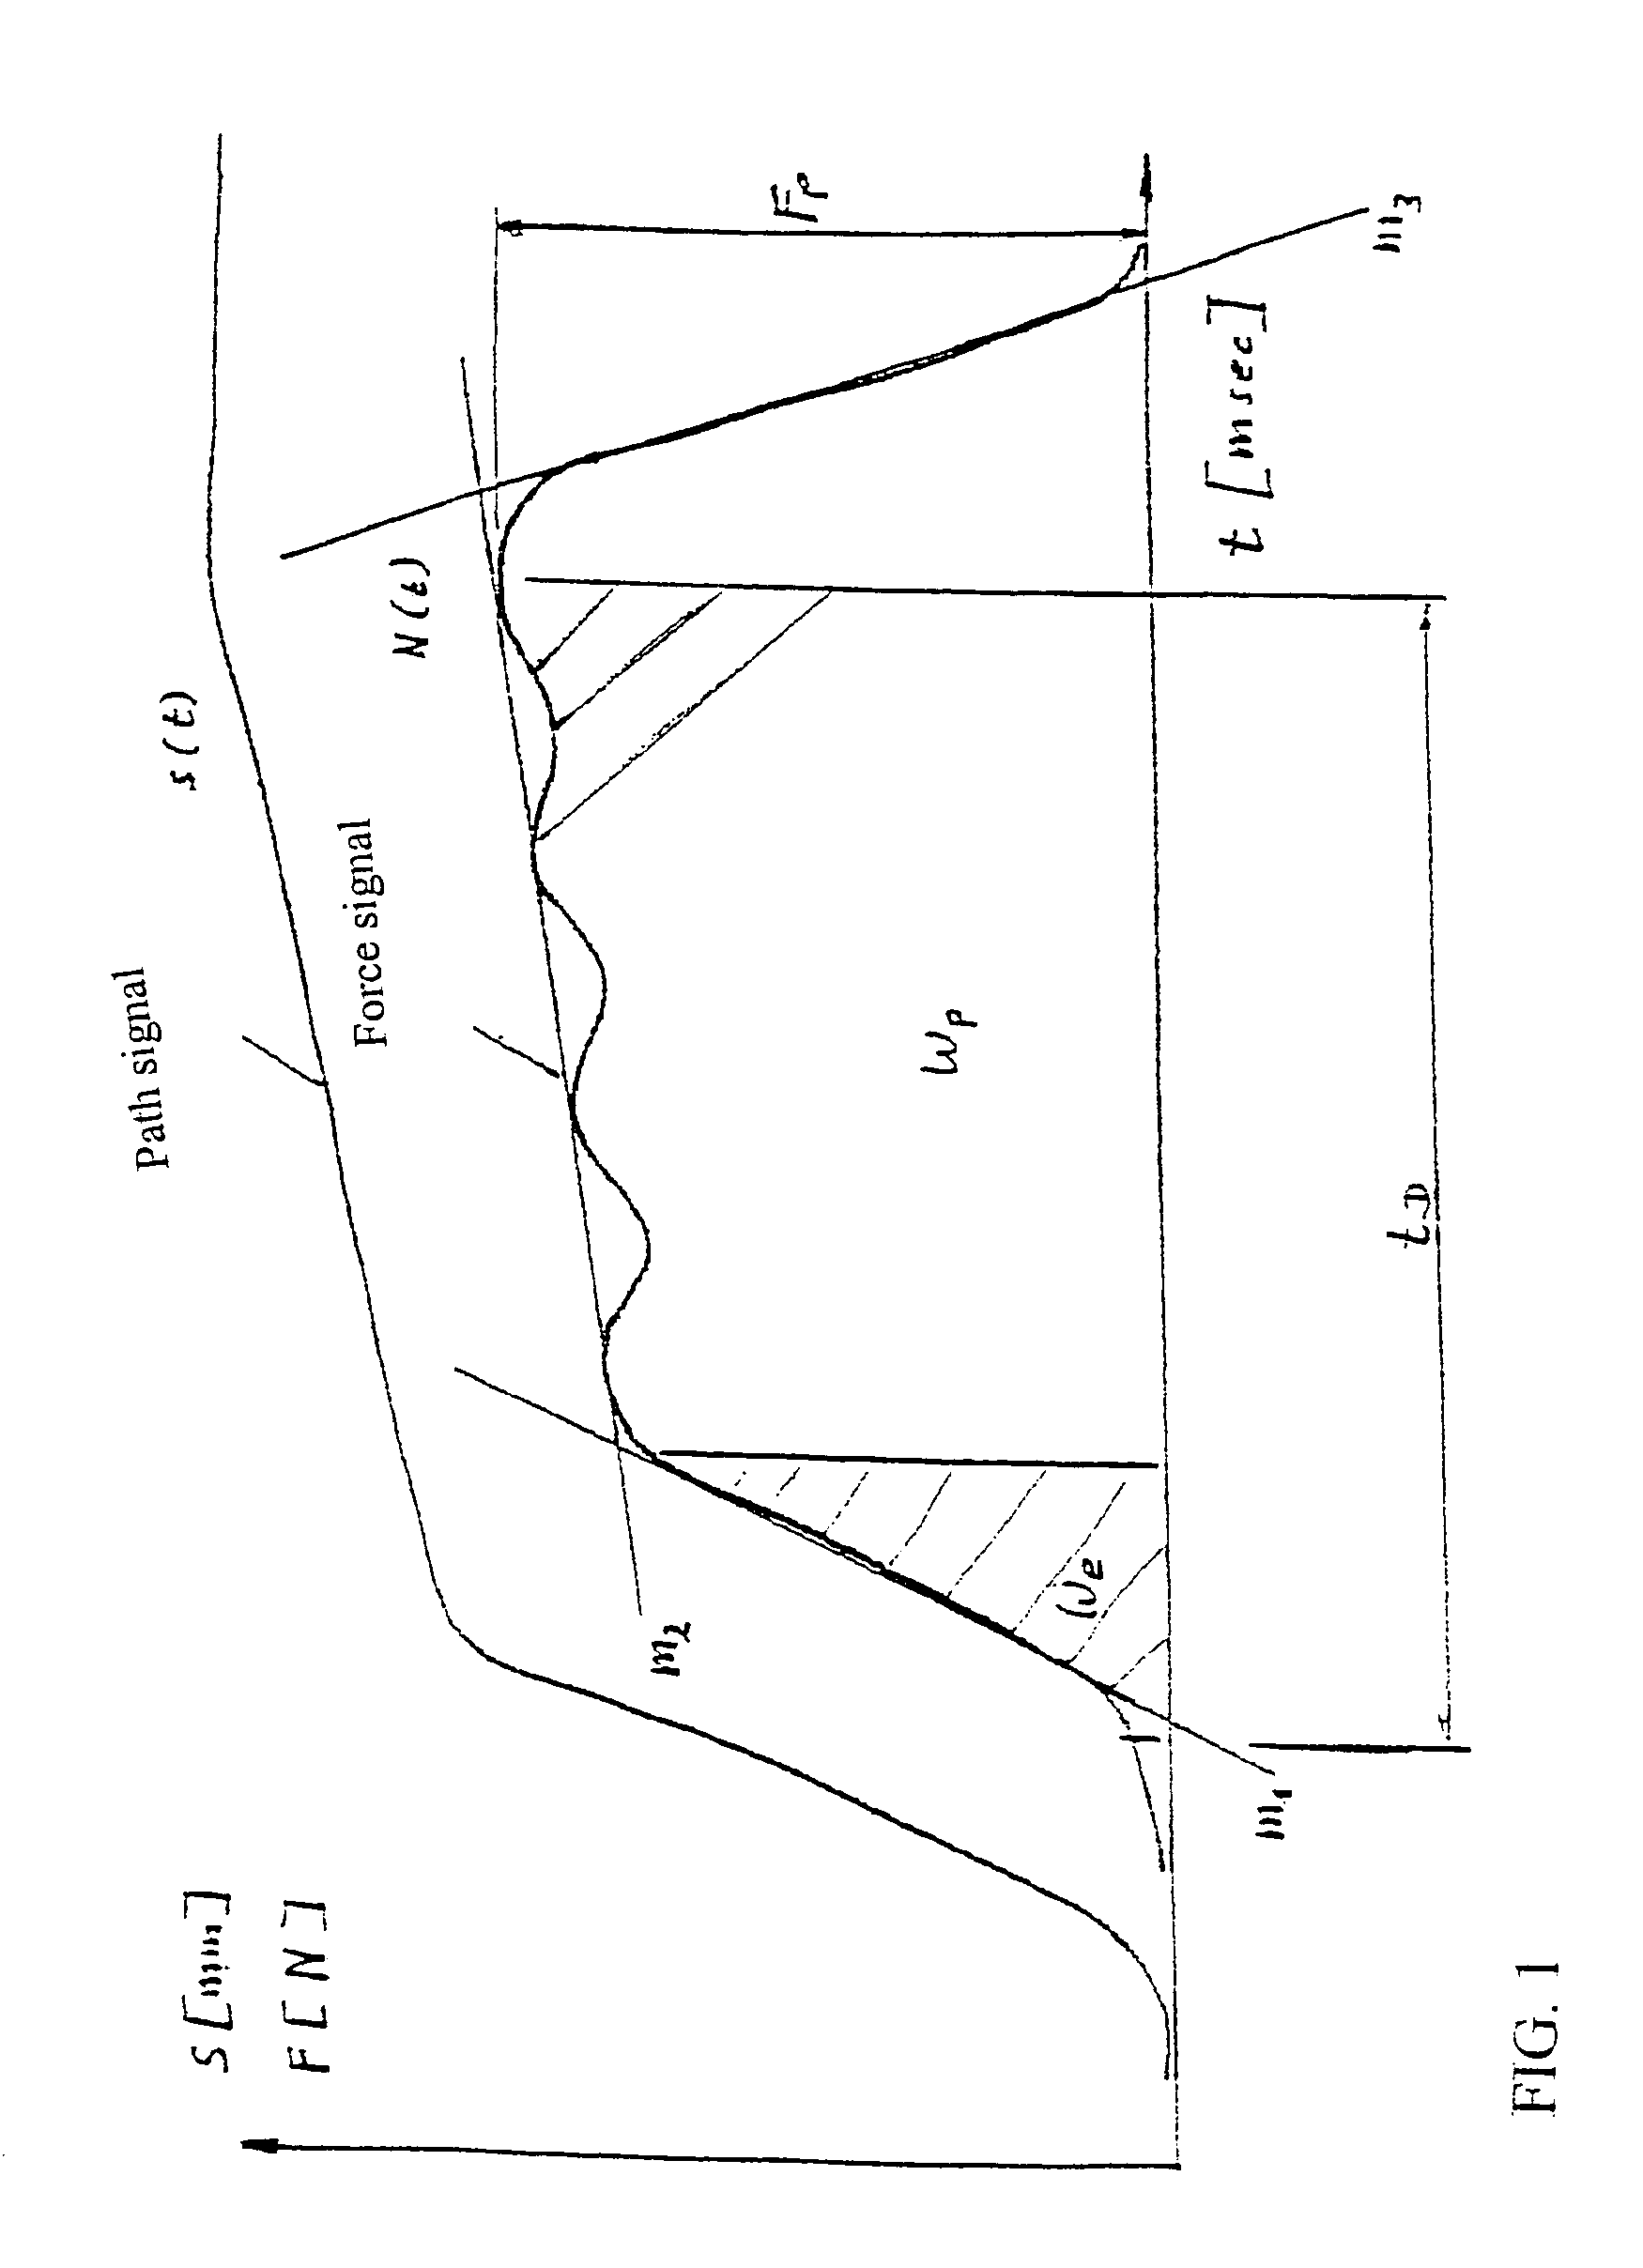
[0039]FIG. 1 shows a typical progression of measurement values, for one thing that of the path measurement, and for another that of the force measurement.

In this diagram, the symbols mean:

[0040]tD deformation time (ms)[0041]Fp peak / force signal (N)[0042]s deformation (mm)[0043]We elastic deformation energy (Nmm)[0044]Wp plastic deformation energy (Nmm)[0045]m1 increase in force (elastic)(N / ms)[0046]m2 increase in force (plastic)(N / ms)[0047]m3 drop in force signal (N / ms)

[0048]As is evident from this diagram, an initial deformation has a high speed and then makes a transition into a deformation having a lower speed, and finally ends at a final deformation (horizontal region).

[0049]The force measurement shows, initially, as a function of the yield value of the sample, a more or less great increase in force, which causes the elastic deformation. The force signal progression makes a transition into a more or less wave-shaped increase with a slight incline after an approximately linear in...