
Hyperbolic tree space display of computer system monitoring and analysis data

a computer system and tree space technology, applied in the field of runtime monitoring in a distributed computer system, can solve the problems of system debugging and understanding, multi-threaded programming model, and existing debugging and profiling tools are not suited to this distributed, and source code has to be written with logging in mind

Inactive Publication Date: 2006-11-28
HEWLETT PACKARD DEV CO LP
View PDF13 Cites 163 Cited by
  • Summary
  • Abstract
  • Description
  • Claims
  • Application Information

AI Technical Summary

Benefits of technology

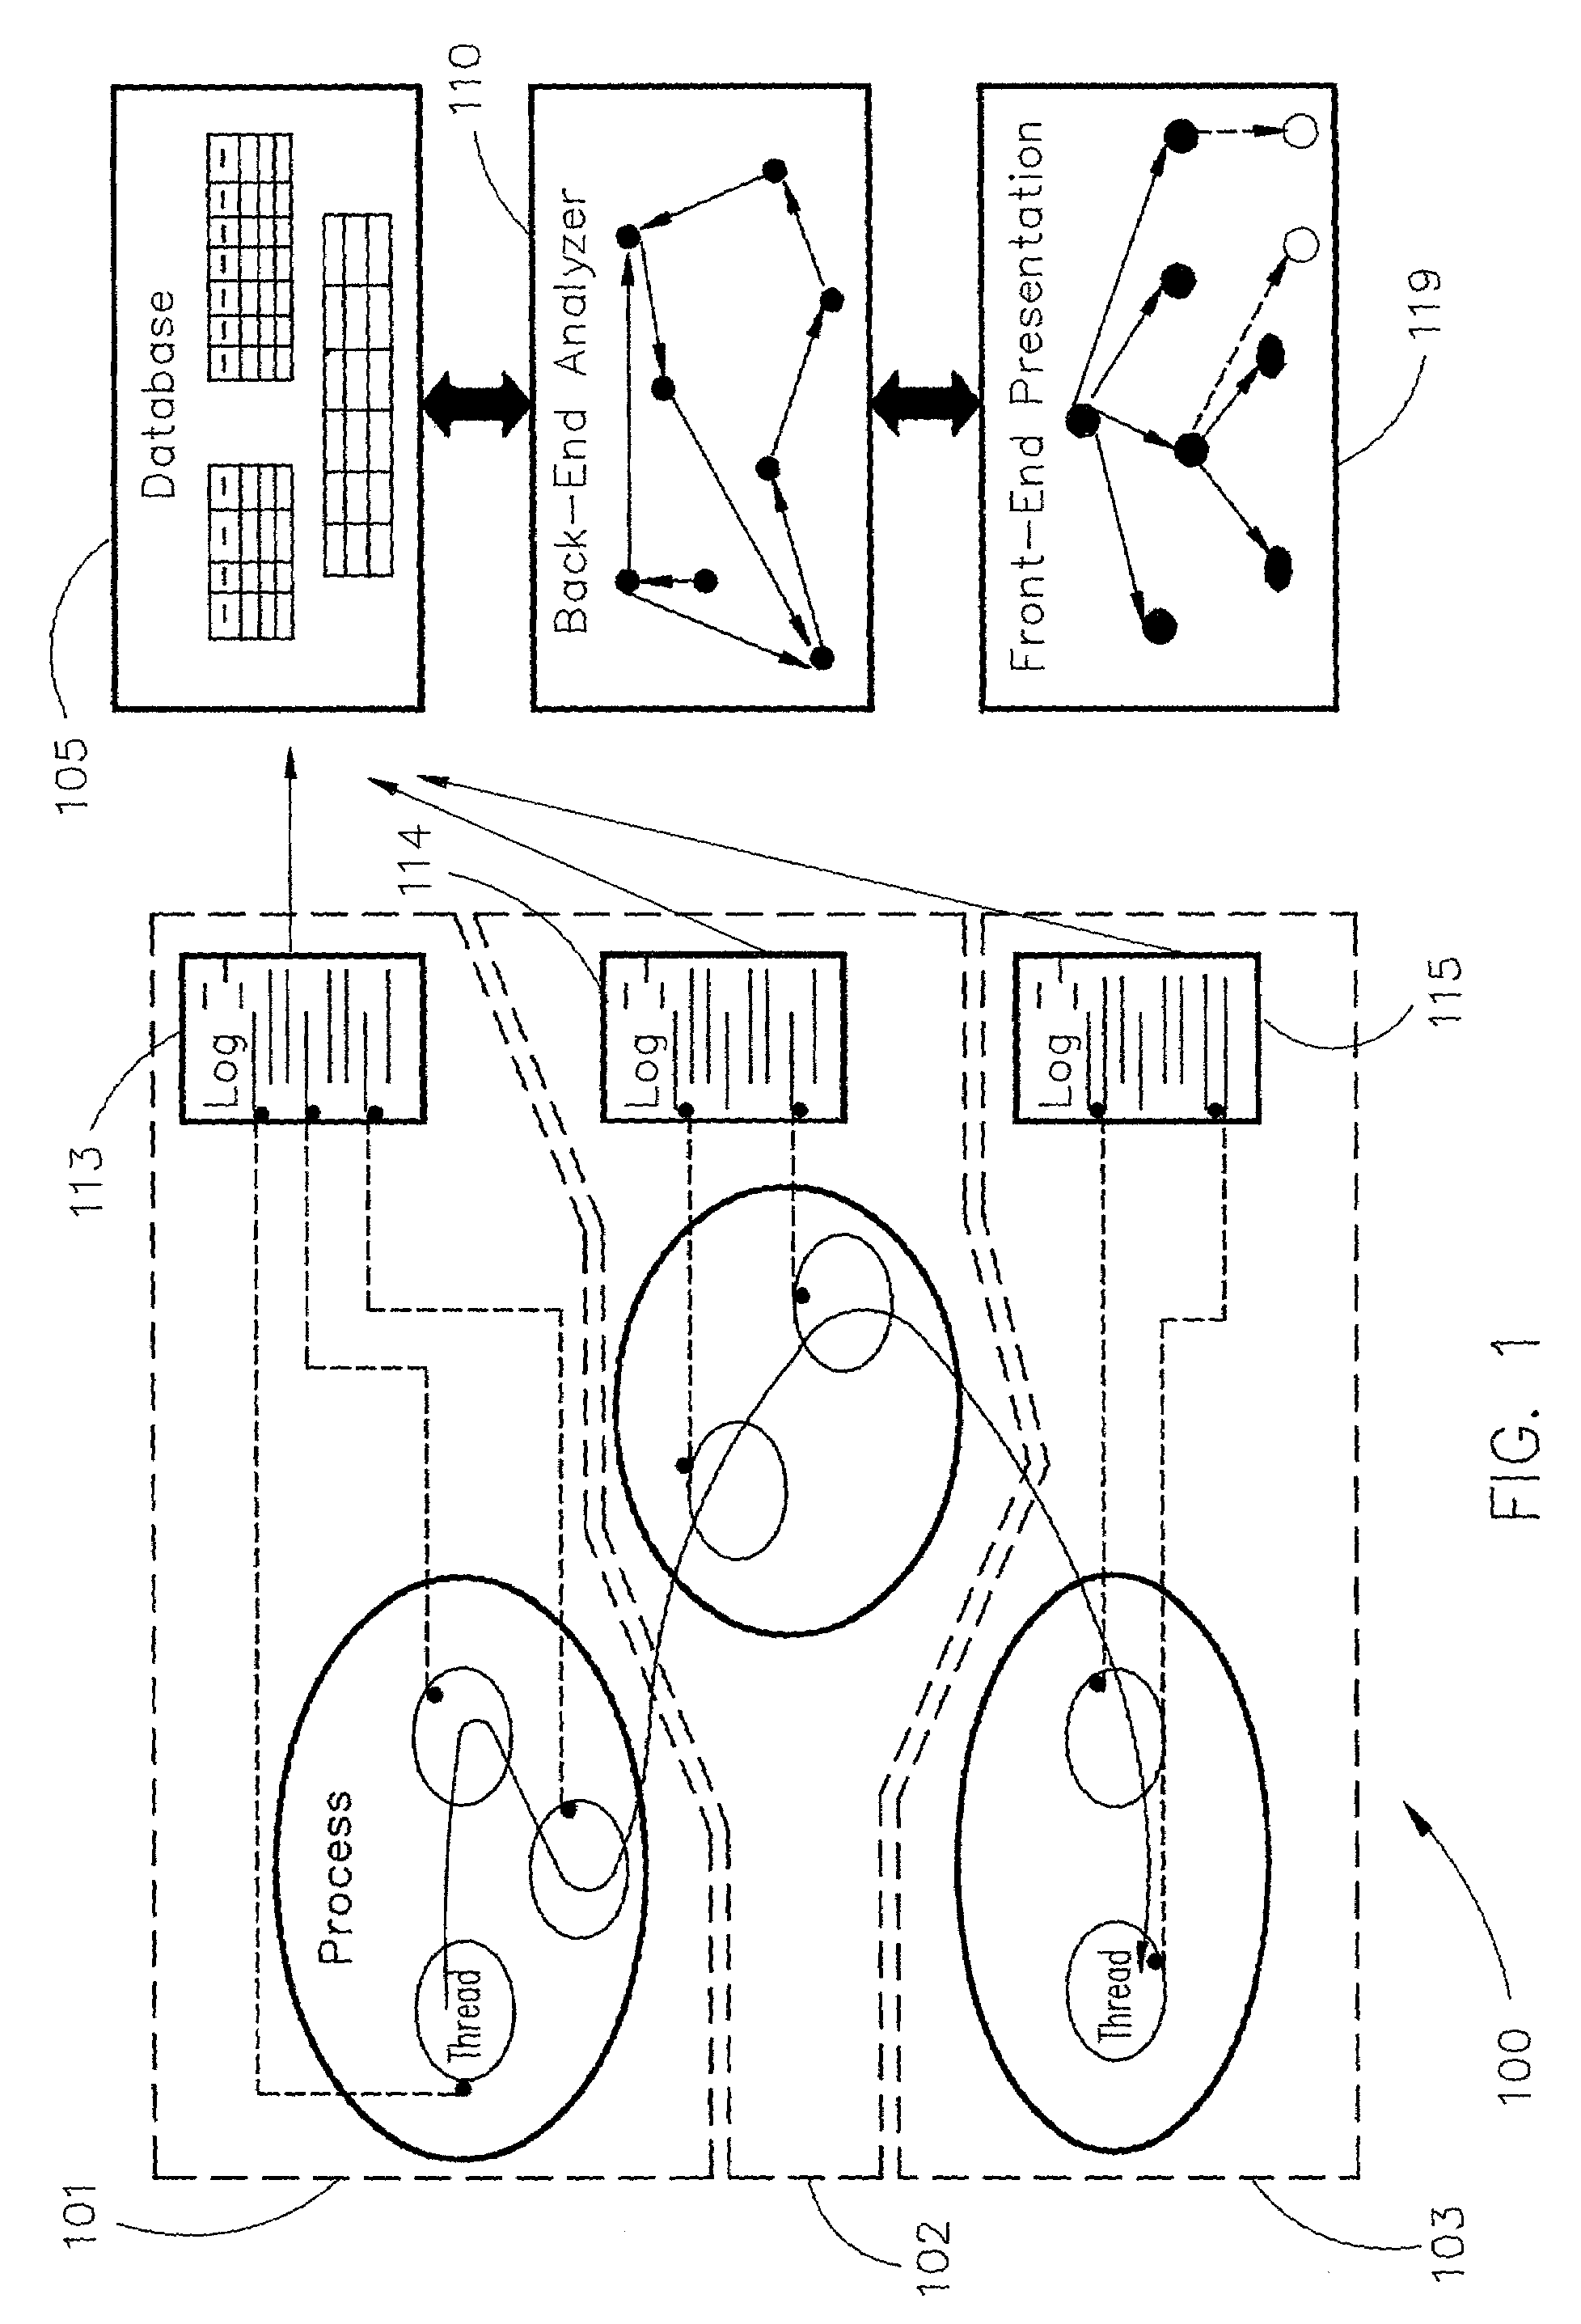
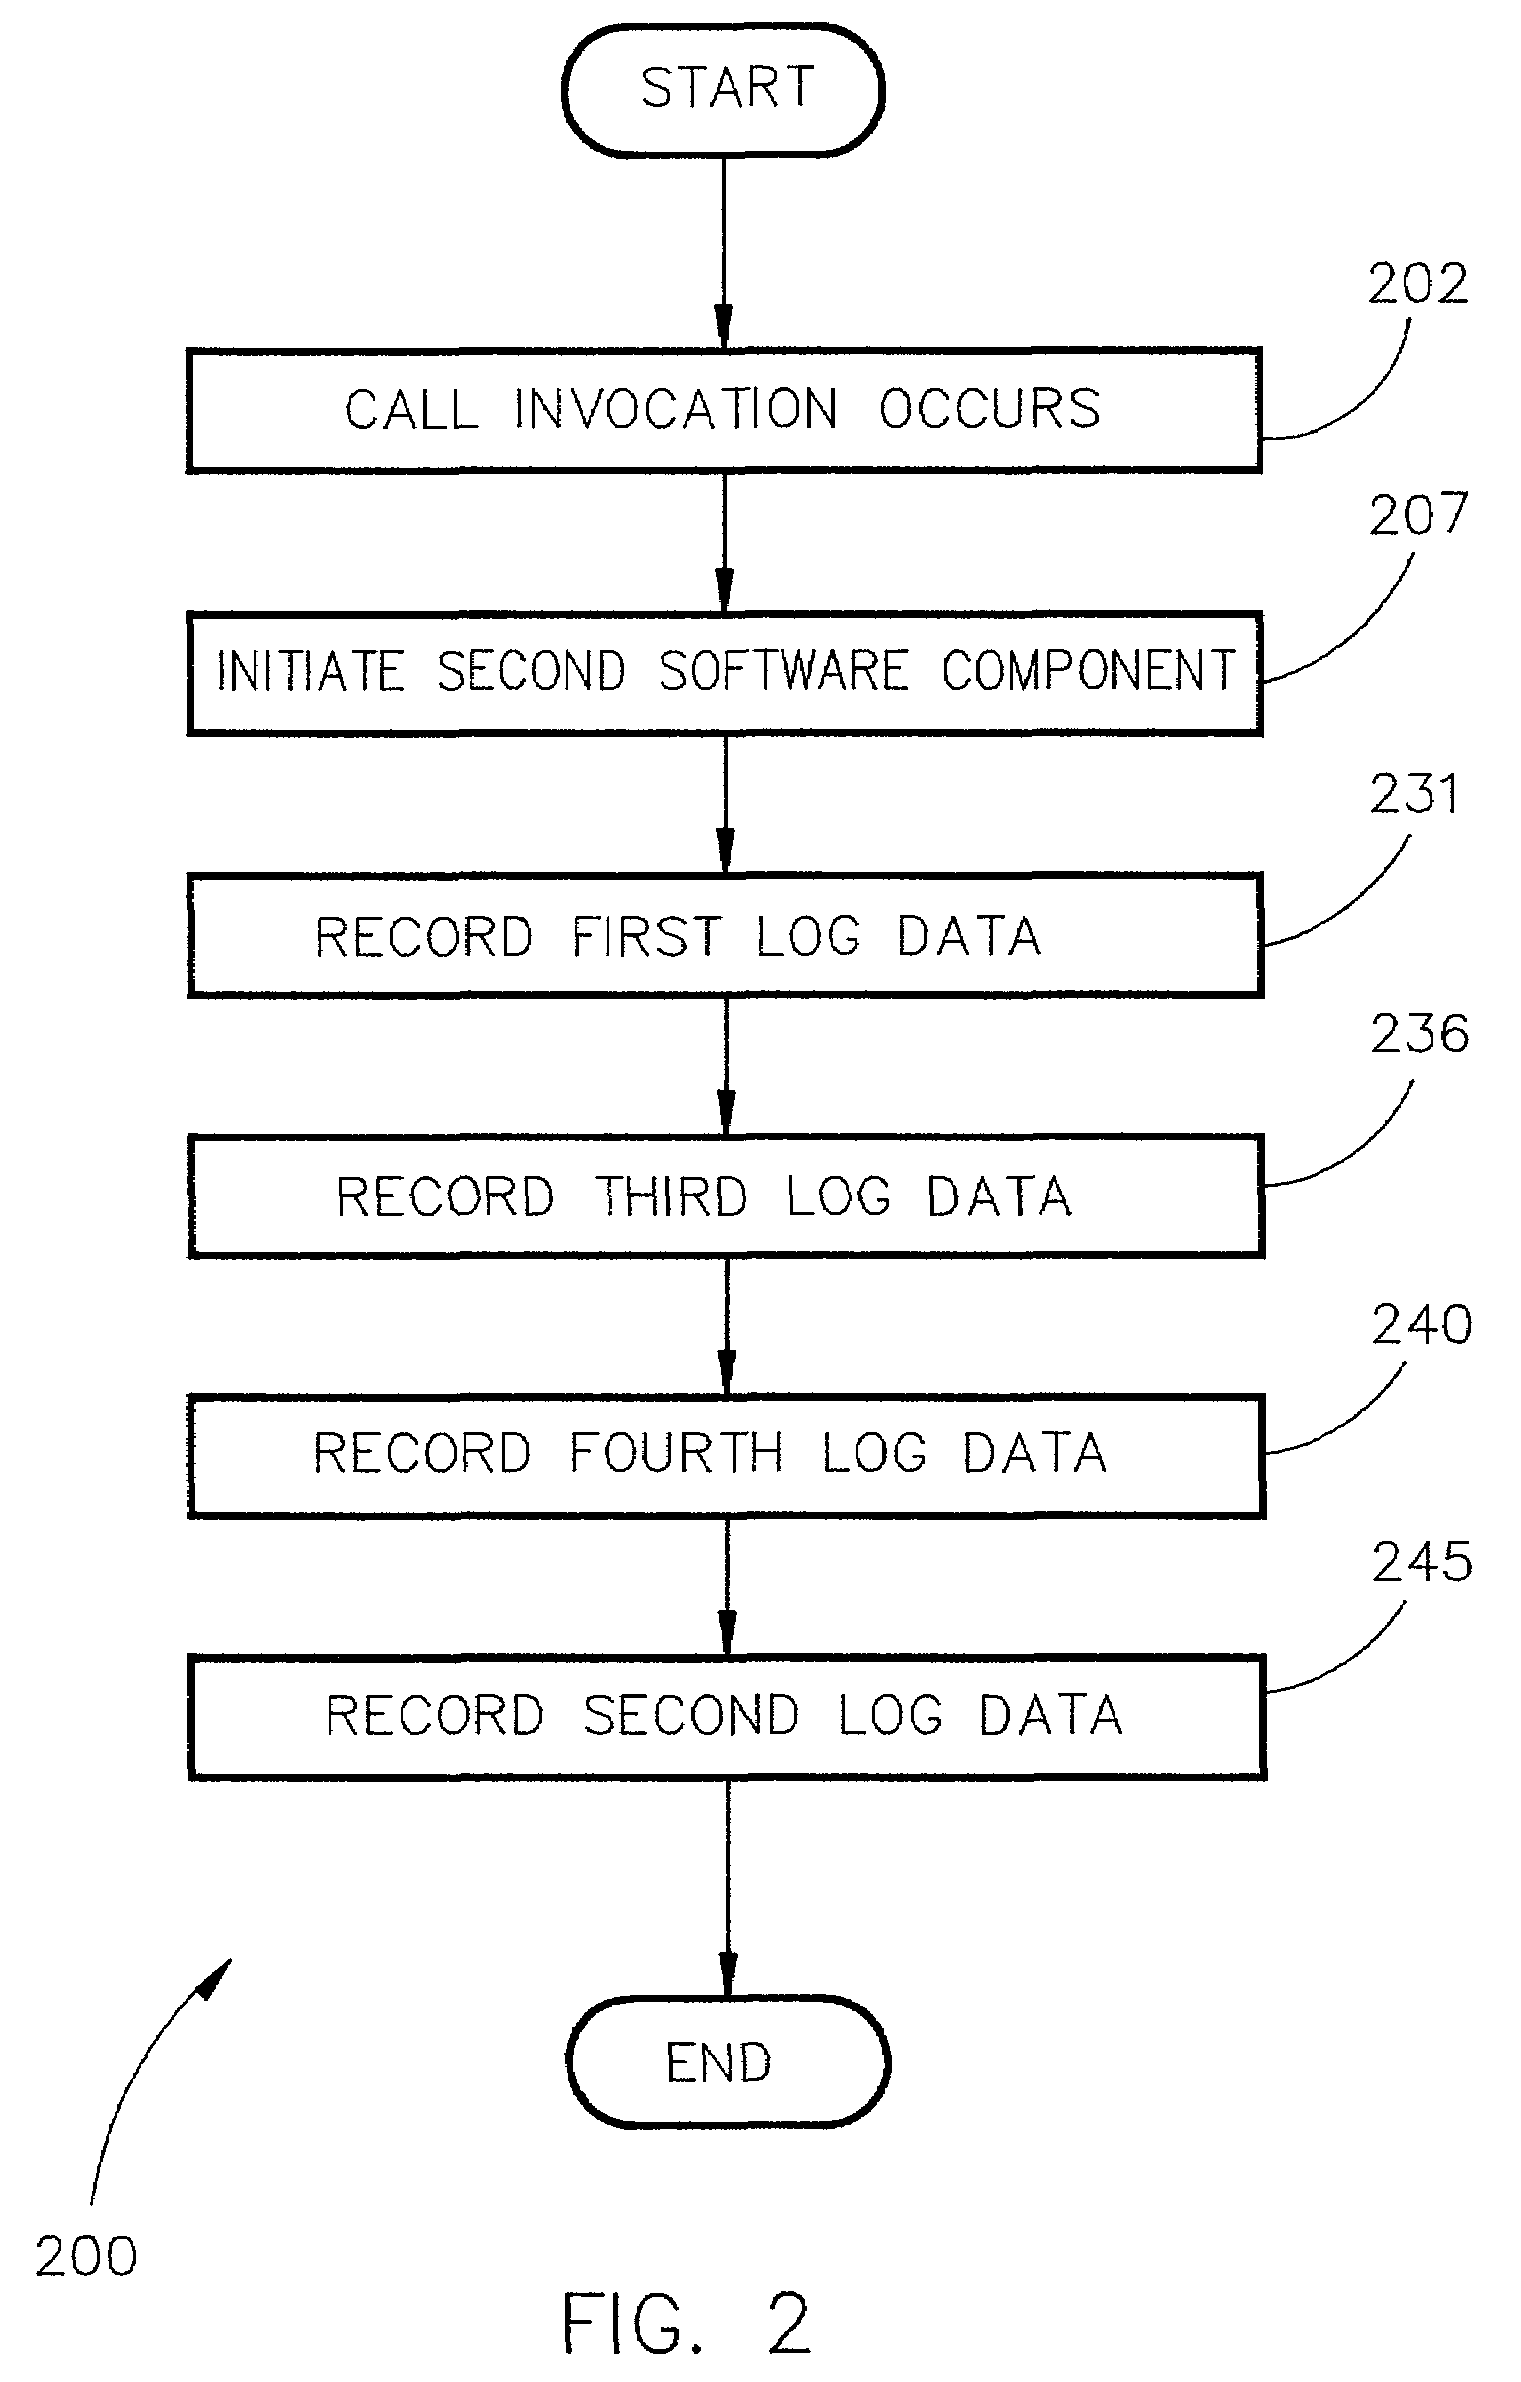
[0020]The method employs instrumented stubs and skeletons that are based on an IDL interface of instrumented software applications. The method therefore gathers data at a start of the stub, at an end of the stub, at the start of the skeleton, and at the end of the skeleton. The method also gathers data regarding memory allocation / deallocation and regarding thread creation and destruction. The monitoring method according to the invention is therefore able to create a Global Causal Identifier for a collection of threads that semantically span one or more caller / callee boundaries. This may include the incrementing of a local event number that allows tracking of thread relationships, and further allows an ordering of gathered data in order to track the relationships. Moreover, parent and child relationships are captured for threads by pairing the associated local thread identifiers. The Global Causal Identifier, the Event Numbers, the parent and child thread identifier pairs, and the instrumented stub and skeleton probes are used by the invention to calculate a system-wide causal chain and to compute an end-to-end latency, a CPU utilization, and a total memory usage for a software component executing within a component-based software system.

Problems solved by technology

These systems were notoriously difficult to debug and understand, as they tended to have multiple threads of control and run across multiple processors / computers.
The existing debuggers and profilers were not suited to this distributed, multi-threaded programming model.
The principal disadvantage of these tools was that the source code had to be written with logging in mind (i.e., the developer had to consciously add a log at an important event).
Quantify does not work on multi-process applications and cannot find causal linkage across processes / threads.
The Paradyn tool (from University of Wisconsin—Madison) is a binary rewriting system but has the disadvantage of not being able to automatically filter log messages or track causality between processes (or threads) in the distributed system.
The AIMS (Automated Instrumentation and Monitoring System from NASA Ames Research Center) is a source re-writing system that inserts log entry points; however, AIMS also fails to correlate events across threads or to provide causal linkage between processes (i.e., why an event occurred).
There are two key disadvantages to these tools: the first is the screen real-estate taken up in any large scale system, the second is the inability to correlate between processes (i.e., it is not possible to tell what caused one process to enter a particular state or who sent the message).
However, these tools have great difficulty turning the network packet (or operating system call) into application meaningful events (i.e., usually one just gets a packet of bytes and no easy way to interpret why the packet of bytes was sent or what the packet is trying to cause to happen).
The principal disadvantage of this approach is that it is tied to the Java Virtual Machine and does not allow intermixing multiple languages or platforms.
For all the above approaches the principal disadvantages are the inability to track causal chains across threads and processes, the intrusiveness of the approach (i.e., requiring changes to the source code), and the inability to track resource utilization (e.g., CPU, memory, bandwidth, time) to application meaningful events.
No existing program development environments are sufficient to debug, monitor, and characterize a multi-threaded, multi-processed, and distributed system.
In addition, the prior art approach may display simple resource usage, such as overall process execution times and overall memory consumption.
The runtime information display of the prior art suffers from several drawbacks.
The prior art is not capable of presenting a dynamic call graph (showing system-wide function invocations and thread spawning) and instead shows only a static call graph or a dynamic call graph that is only concerned with function invocations.
Consequently, the viewer cannot accurately and completely comprehend the available information and may not be able to easily move between the various items of information.
Moreover, the viewer cannot obtain an accurate picture of how the different pieces of information are inter-linked and inter-related.
The viewer may have to exit one graph or display in order to access another graph or display, resulting in delay, distraction, etc., for the user.
An additional drawback of the prior art approaches is that they do not scale well to large amounts of runtime information.
Another drawback is that there is no ability to correlate a call graph data with other analysis results.
The prior art is unable to comprehensively characterize and display a complete runtime system behavior of a computer system.
The prior art is especially unable to comprehensively characterize and display a complete runtime system behavior of a software component-based computer system.

Method used


Image

  • Hyperbolic tree space display of computer system monitoring and analysis data
  • Hyperbolic tree space display of computer system monitoring and analysis data
  • Hyperbolic tree space display of computer system monitoring and analysis data

Examples


Embodiment Construction

Definitions

[0041]A distributed system is a loose configuration of computers or computer devices that are interconnected by one or more networks or network links. A distributed system may include devices that are remote from each other. The devices on the distributed system may transfer data among themselves and may call and execute applications on other devices. This is especially true of component-based software, in which a software application is composed of components that each perform a specific task and operate according to well defined interfaces.

[0042]A component-based software system is a composition of a set of interacting software components, each of which provides and requests service from other software components. Each component has a well-defined interface by which the component exposes its interface to other components. A component's interface, therefore, may be used to provide services to other components and is used by other components to obtain services. In a compo...


PUM


Abstract

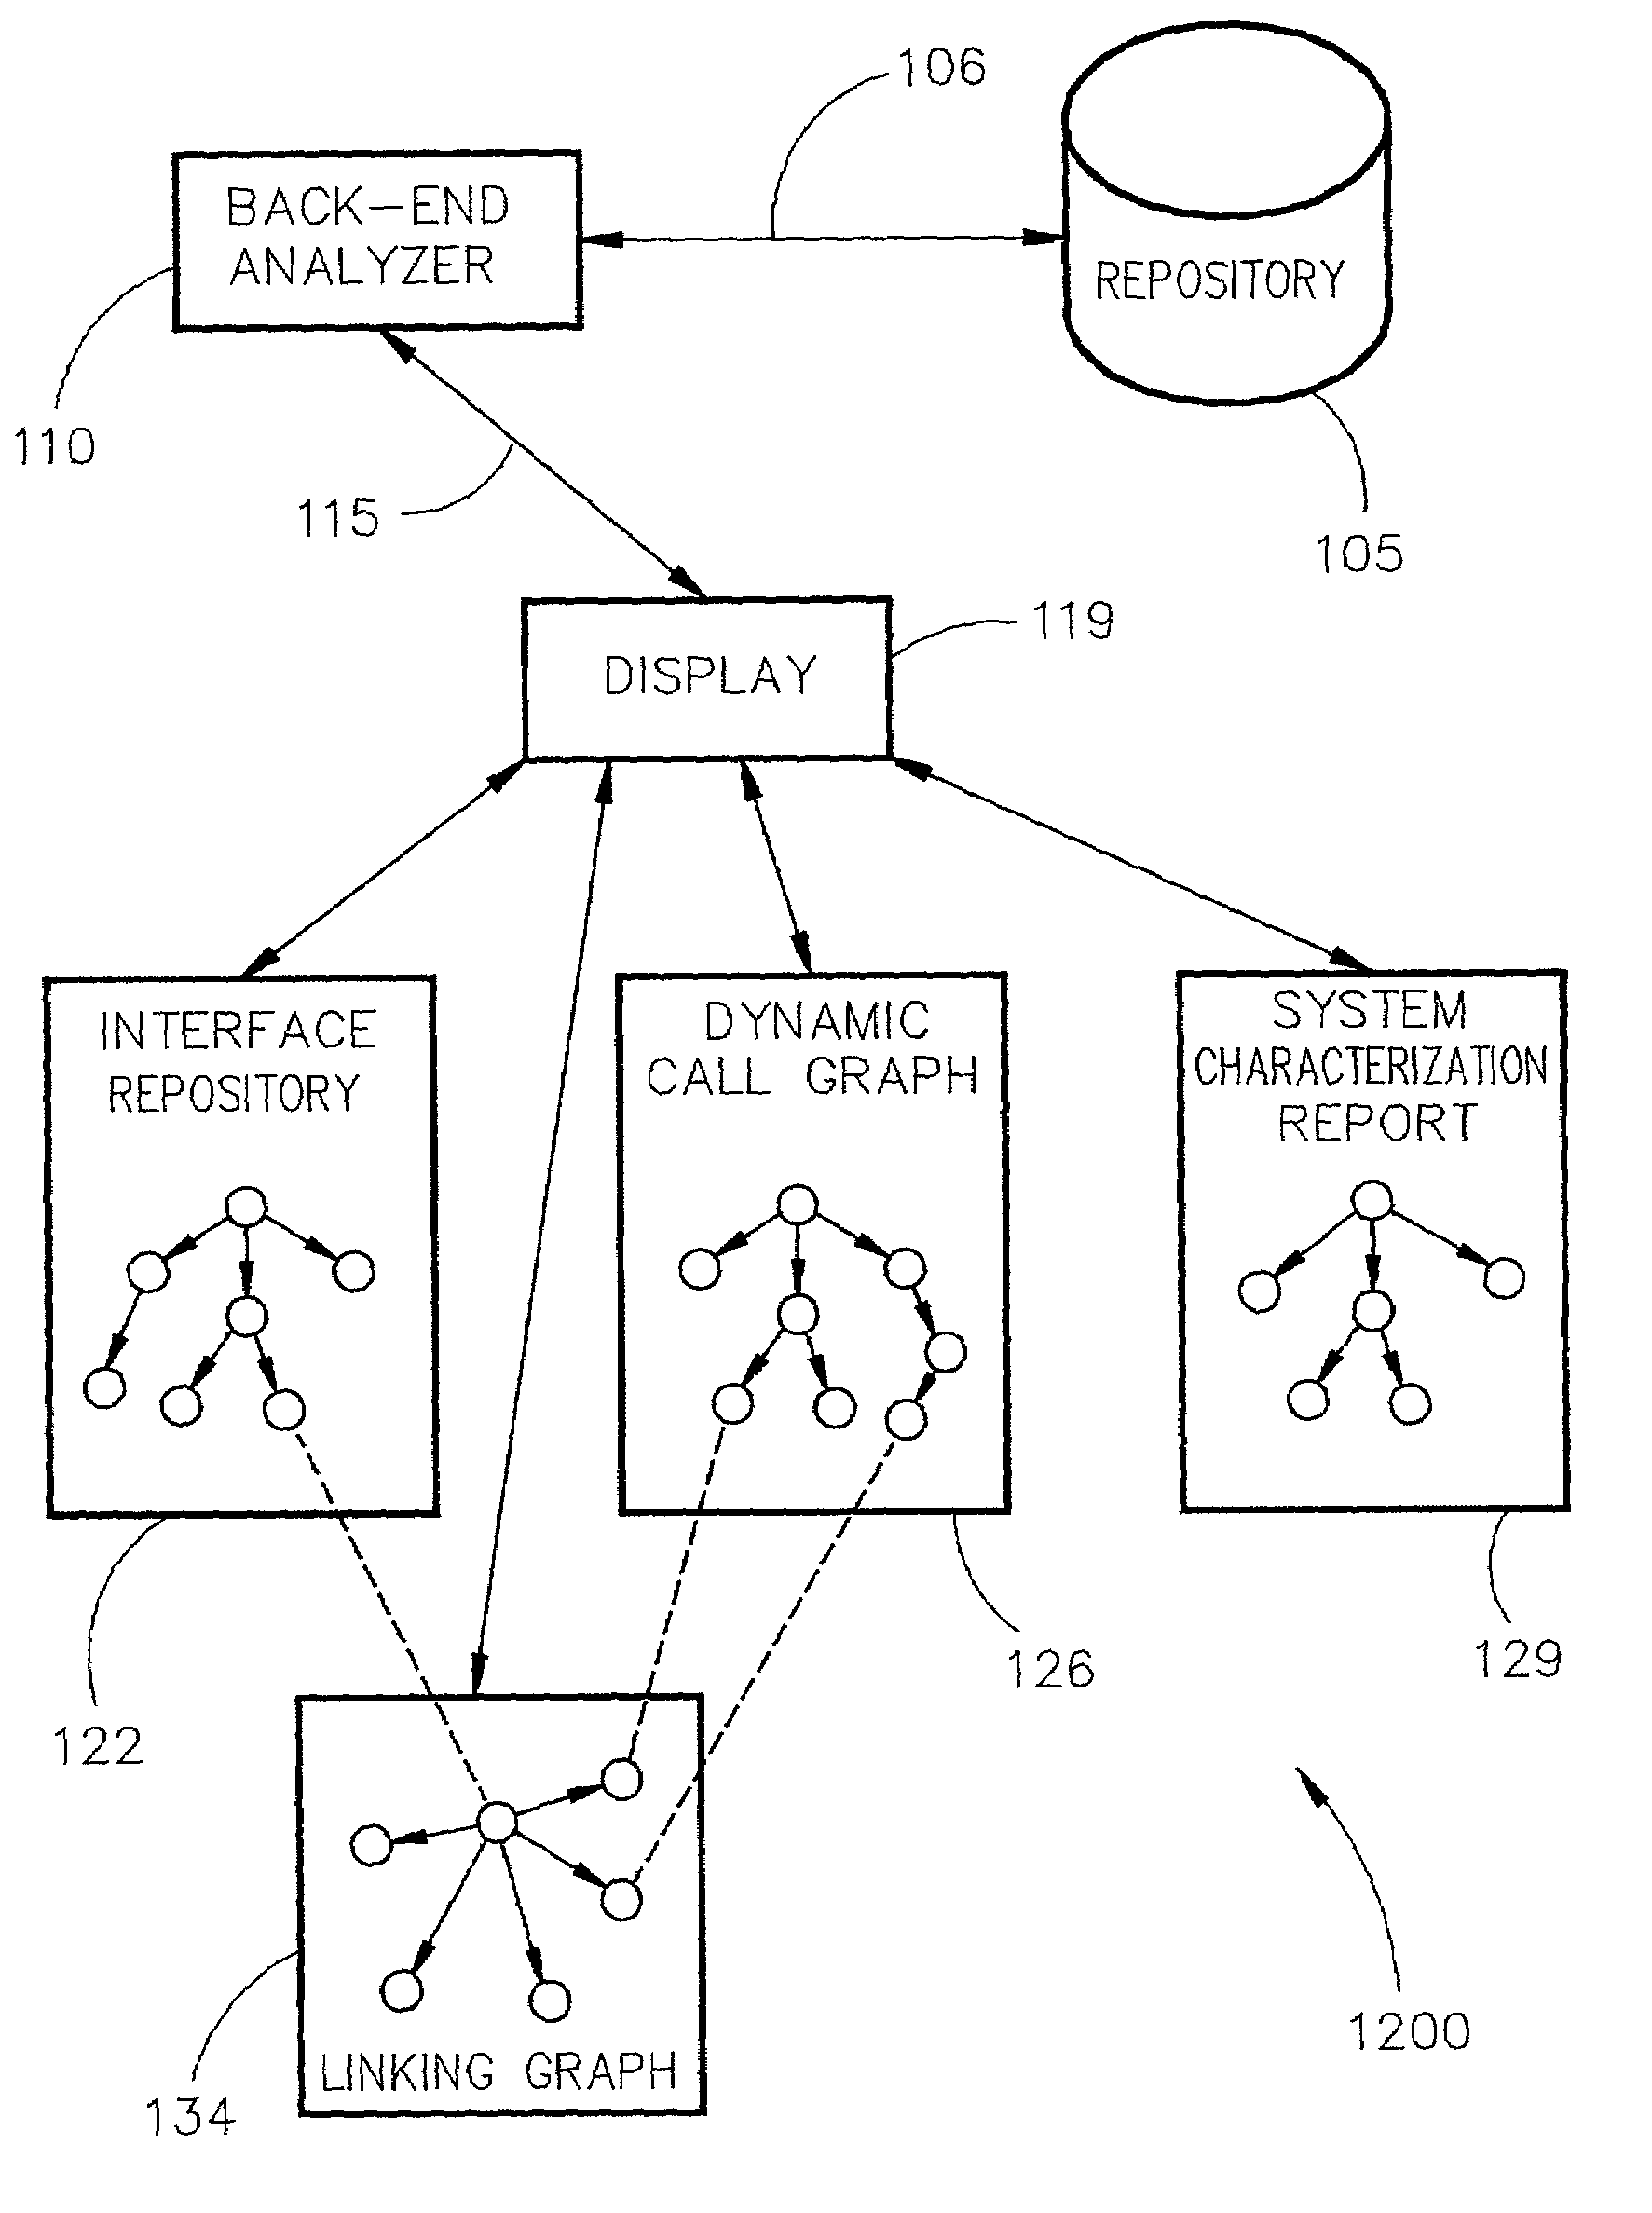
A method for displaying a computer system runtime information includes the steps of displaying a plurality of runtime information items in different hyperbolic trees. The method further comprises the steps of navigating and inspecting runtime information within each individual hyperbolic tree, and navigating between semantically linked hyperbolic trees.

Description

[0001]This application is a continuation-in-part of U.S. patent application Ser. No. 09 / 955,764, filed Sep. 19, 2001.FIELD OF THE INVENTION[0002]The present invention relates generally to runtime monitoring in a distributed computer system, and more particularly to runtime monitoring in a component-based distributed system.BACKGROUND OF THE INVENTION[0003]A key part of software code development is the use of debuggers and profiling tools to understand what a software system is doing. Typically, debuggers (such as Microsoft Visual Studio from Microsoft Corporation or gdb from the Free Software Foundation) are used to diagnose a logic flaw in a program that caused the program to reach an erroneous result. Causal tracing and call stacks, for example, are an essential part of the value derived from program debuggers. Profiling tools (such as gprof (a common Unix tool), Purify (from Rational Corporation), and Quantify (also from Rational Corporation)) are used to capture details about ho...

Claims


Application Information

Patent Timeline
IPC IPC(8): G06F9/44G06F3/00G06F11/34G06F11/32G06F11/36
CPCG06F11/323G06F11/3612
Inventor LI, JUNMOORE, KEITH E.
Owner HEWLETT PACKARD DEV CO LP
Learn More