Orthogonal heterodyne optical signal-to-noise-ratio (OSNR) monitoring method and apparatus
- Summary
- Abstract
- Description
- Claims
- Application Information
AI Technical Summary
Benefits of technology
Problems solved by technology
Method used
Image

Examples
Embodiment Construction
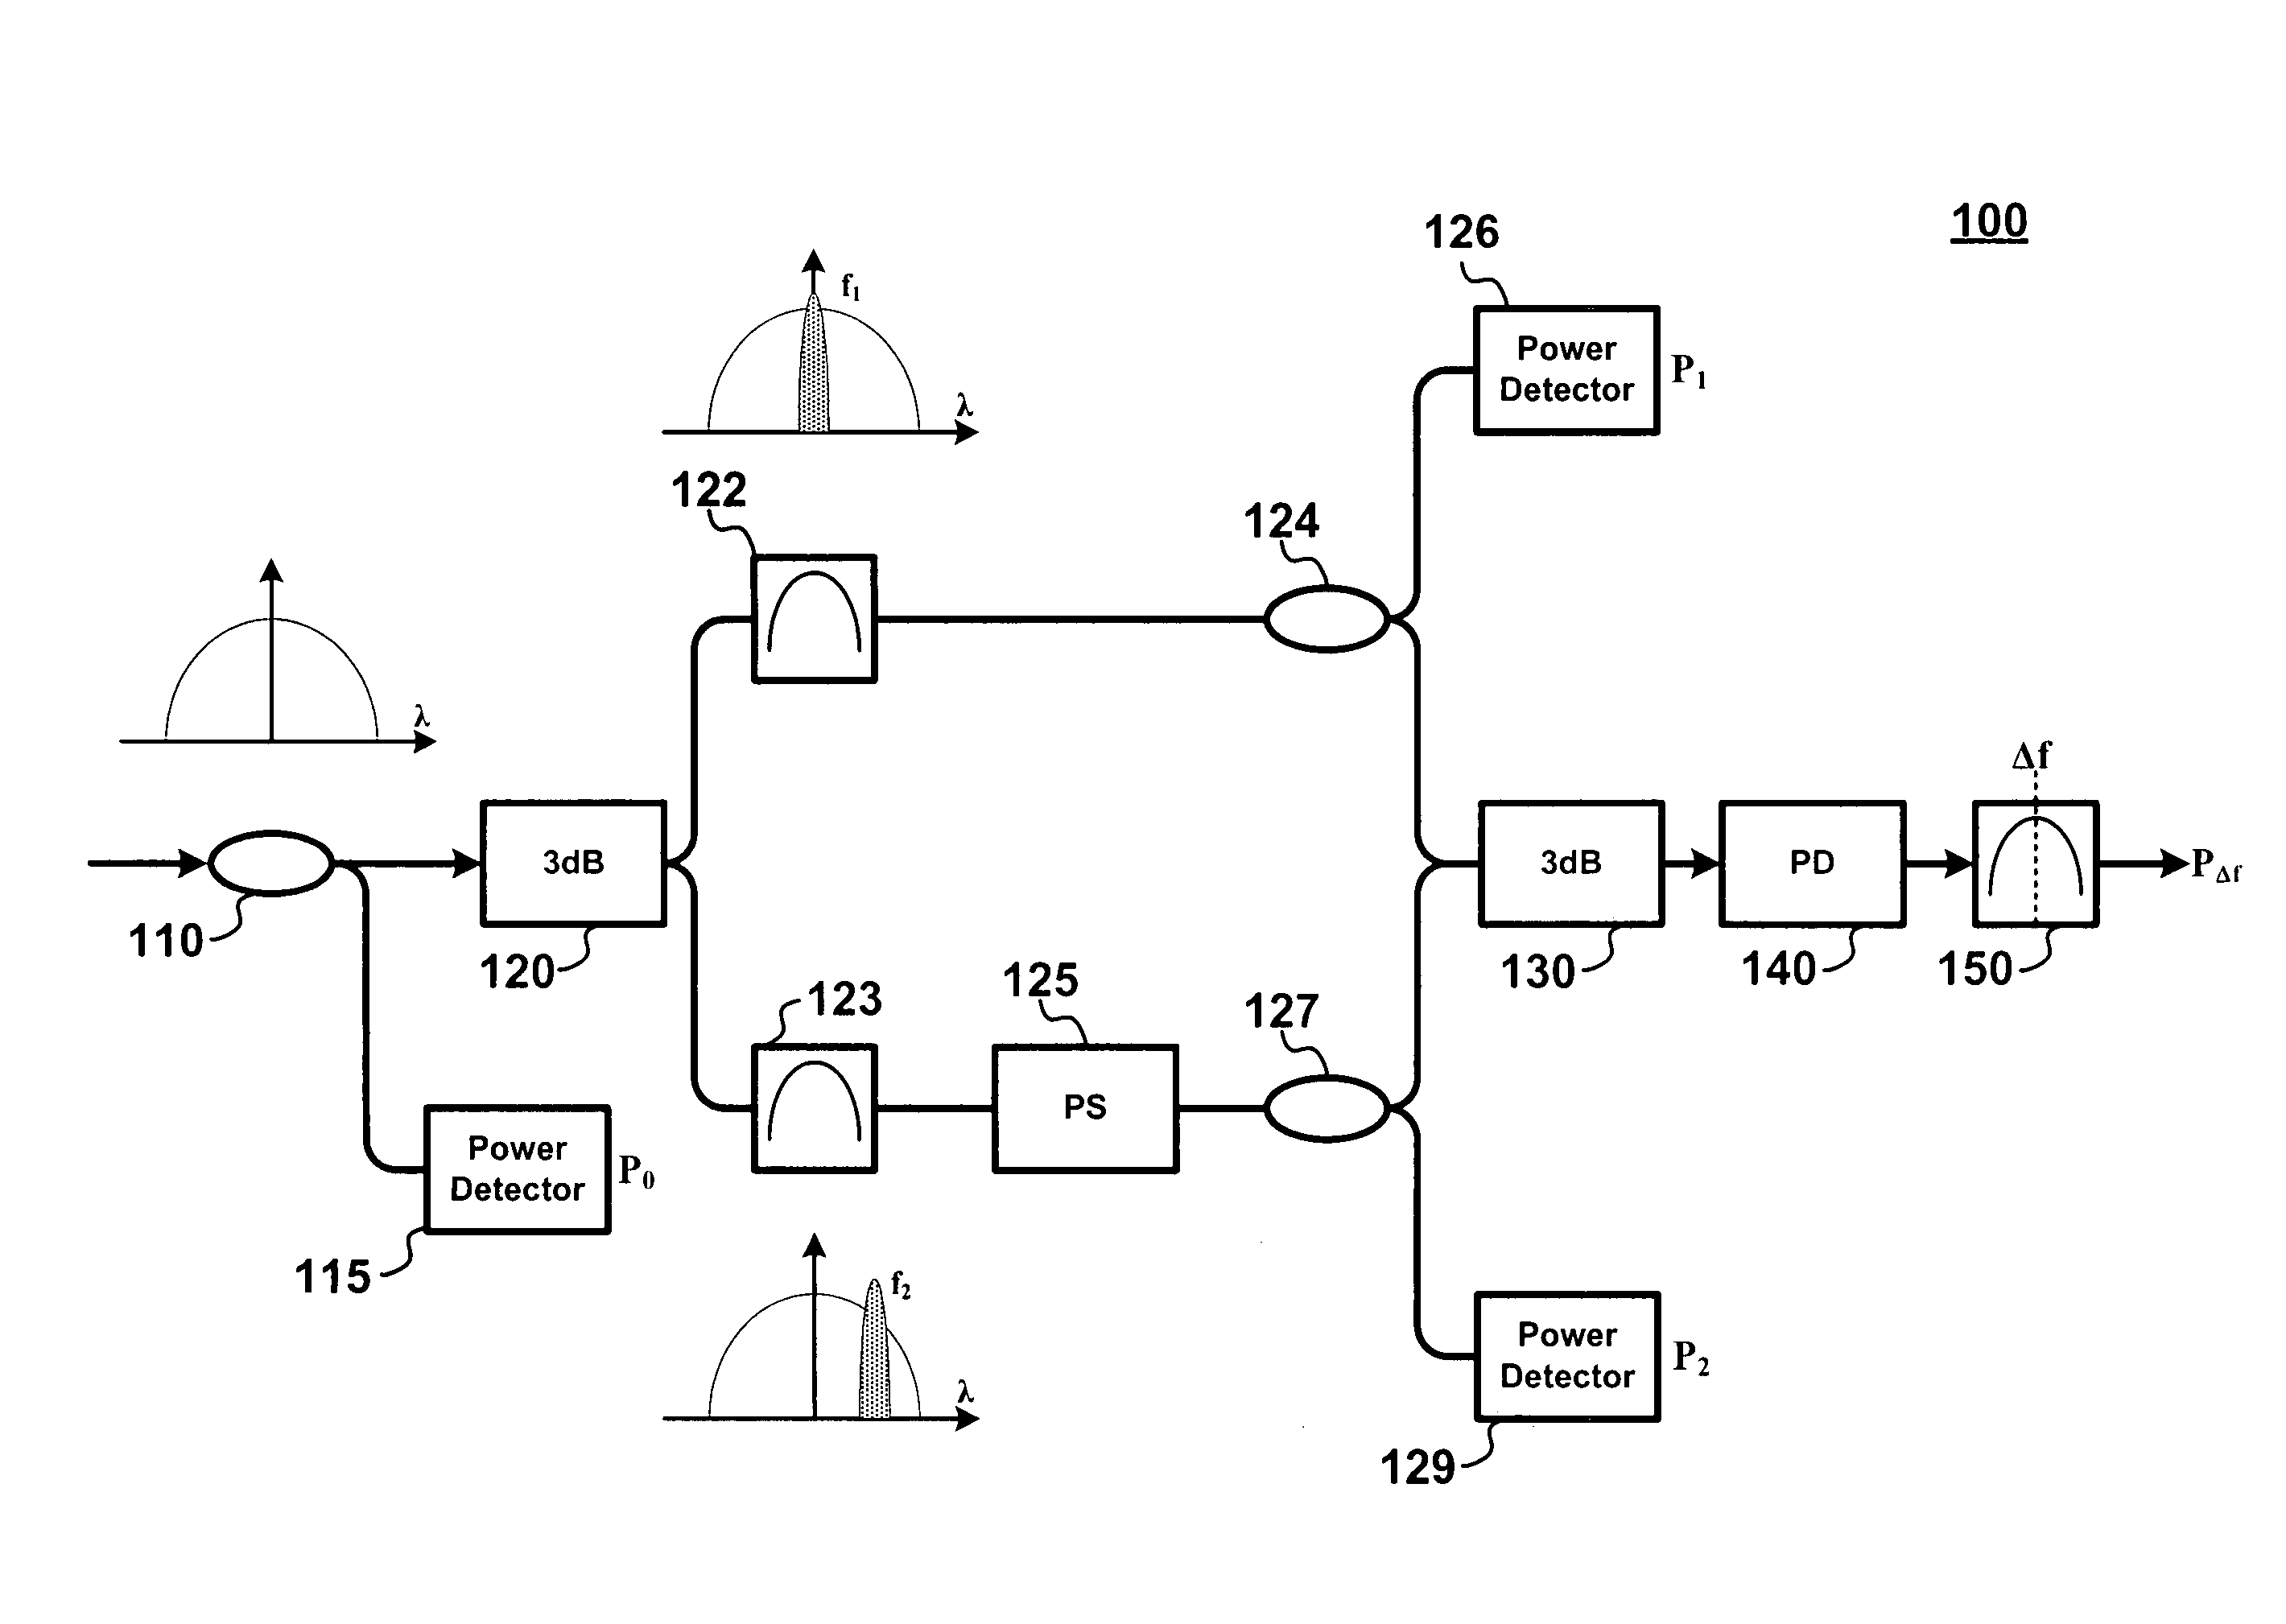
[0017]FIG. 1 shows a schematic of an optical apparatus 100 which we will use to demonstrate and explain our inventive optical signal-to-noise-ratio measurement method. With reference to that FIG. 1, it is shown that an input optical signal is first “tapped” by optical coupler 110 such that a power measurement of the input signal P0 is made by power detector 115. The input signal is subsequently split through the effect of 3 dB coupler 120 and the split signal(s) sent into separate “branches” (Branch 1—Upper; Branch 2—Lower) of our apparatus.
[0018]In each of the branches, there is positioned a narrow bandwidth optical filter 122, and 123. As shown in FIG. 1, the center frequency of the two filters is represented as f1 and f2 and their bandwidth(s) B1 and B2, respectively. In addition, the two optical filters are non-overlapping, that is, Δf=|f1−f2|>(B2+B1) / 2.
[0019]In upper Branch 1, an optical signal exiting the narrow bandwidth optical filter 122 is tapped through the effect of coup...
PUM
 Abstract
Description
Claims
Application Information
PatSnap Eureka turns technology decisions into work you can execute. Powered by our Innovation Knowledge Graph, it runs expert workflows across engineering, life sciences, materials and intellectual property. Get your review-ready output in minutes.


