Static timing and risk analysis tool

a technology of risk analysis and integrated circuits, applied in the field of integrated circuit tools, can solve the problems of affecting the quality of integrated circuits, affecting the accuracy of integrated circuits, and containing an enormous number of components or cells, and achieving the effect of eliminating costly and frustrating failure analysis and high quality

Inactive Publication Date: 2007-02-20
BELL SEMICON LLC
View PDF7 Cites 8 Cited by
  • Summary
  • Abstract
  • Description
  • Claims
  • Application Information

AI Technical Summary

Benefits of technology

[0014]The advantages of the present invention are that marginal nodes in a design may be identified that may otherwise be overlooked. The marginal nodes may be further analyzed using additional static timing analysis corner cases to determine if a problem exists. Any problems uncovered during the design phase that can be corrected ensure a higher quality manufactured product and eliminates costly and frustrating failure analysis after manufacturing has begun.

Problems solved by technology

Integrated circuits (ICs) are extremely complex and contain an enormous number of components or cells.
The complexity of the ICs makes debugging an IC difficult and very labor intensive.
Further, the sheer number of components, sometimes in the millions, may make pinpointing a problem area an enormous task.
Because of the complexities of some ICs, the run time to perform a static timing analysis is very long, sometimes requiring hours or days of computation time.
This leaves open the possibility that in some circumstances, a design that passes on the limited number of corner cases may actually fail in service.

Method used


Image

  • Static timing and risk analysis tool
  • Static timing and risk analysis tool
  • Static timing and risk analysis tool

Examples


embodiment 100

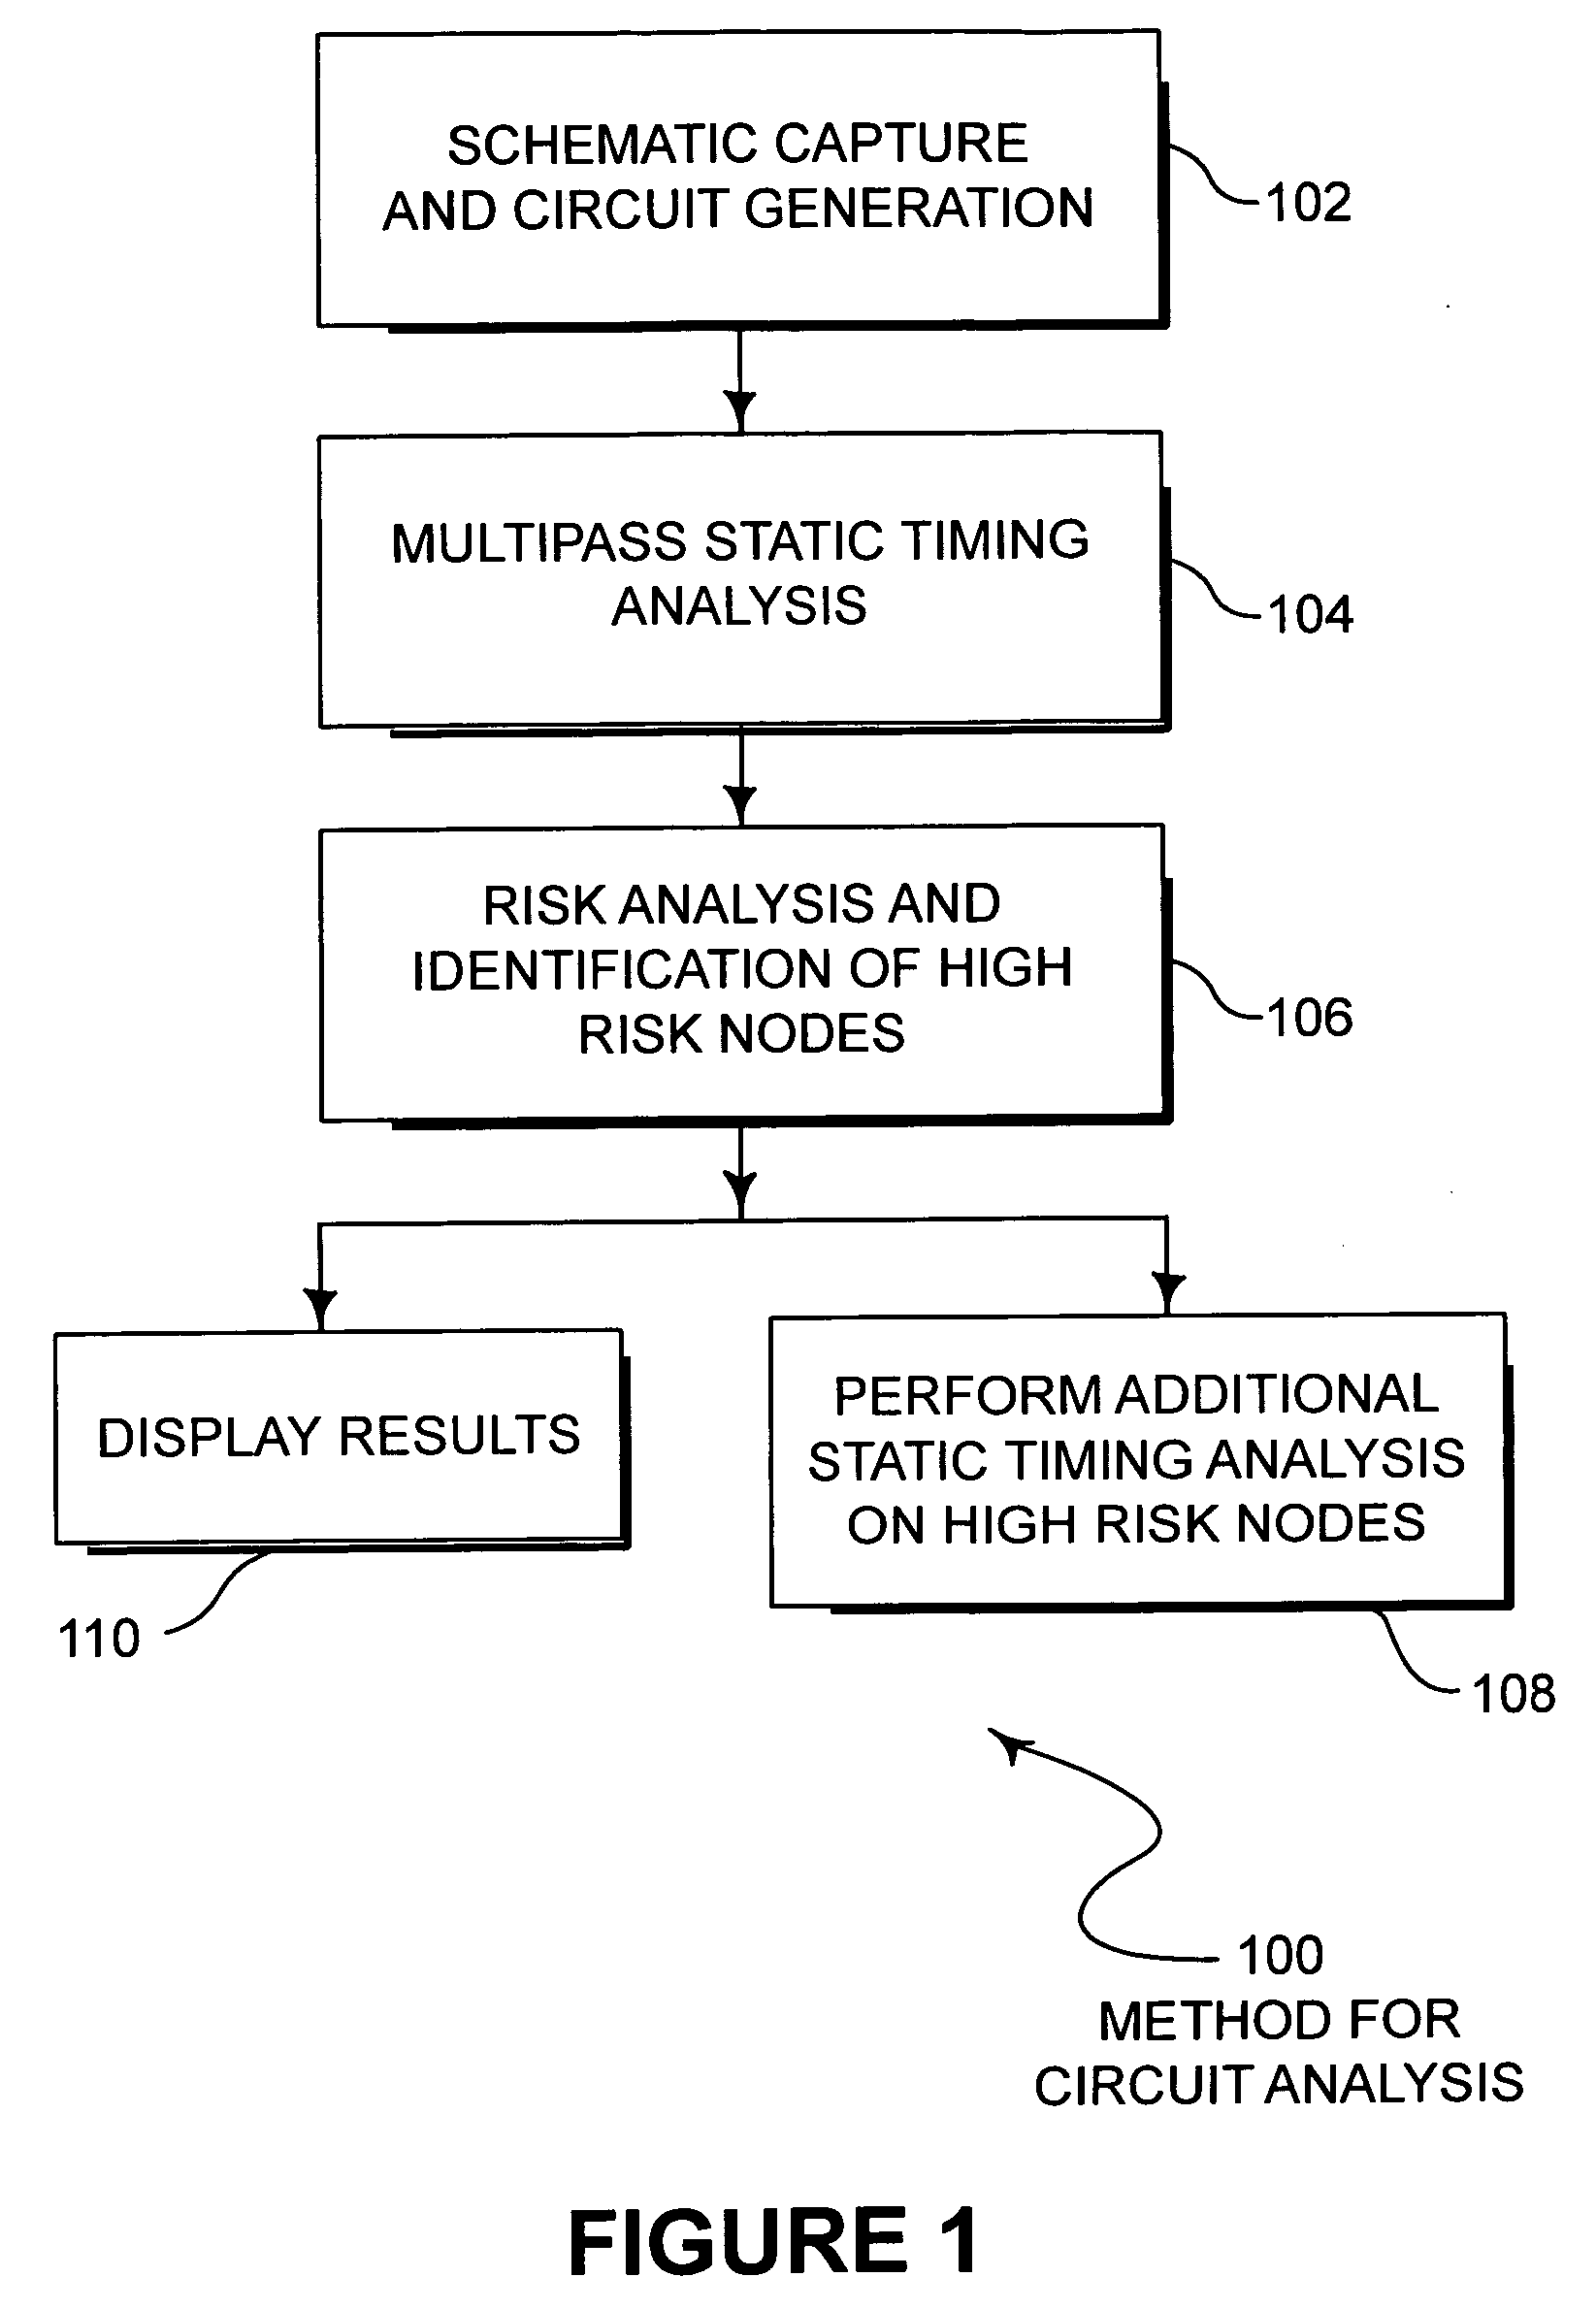
[0030]FIG. 1 is a flowchart illustration of an embodiment 100 showing a method for analyzing a complex circuit, such as an integrated circuit (IC). The schematic capture and circuit generation is performed in block 102, followed by a multipass static timing analysis step in block 104. The results of the multipass static timing analysis of block 104 are used in the risk analysis and identification of high risk nodes of block 106. After risk analysis, additional static timing analyses may be performed on the high risk nodes in block 108 or the results may be displayed in block 110.

[0031]Embodiment 100 is a method of analyzing a complex integrated circuit or similar electrical circuit by performing static timing analysis using at least two corner cases, screen the nodes based on a risk factor, and then perform additional analyses on the high risk nodes. The complexity of a circuit may be such that performing one corner case analysis may require several hours or even days of computer ti...

embodiment 200

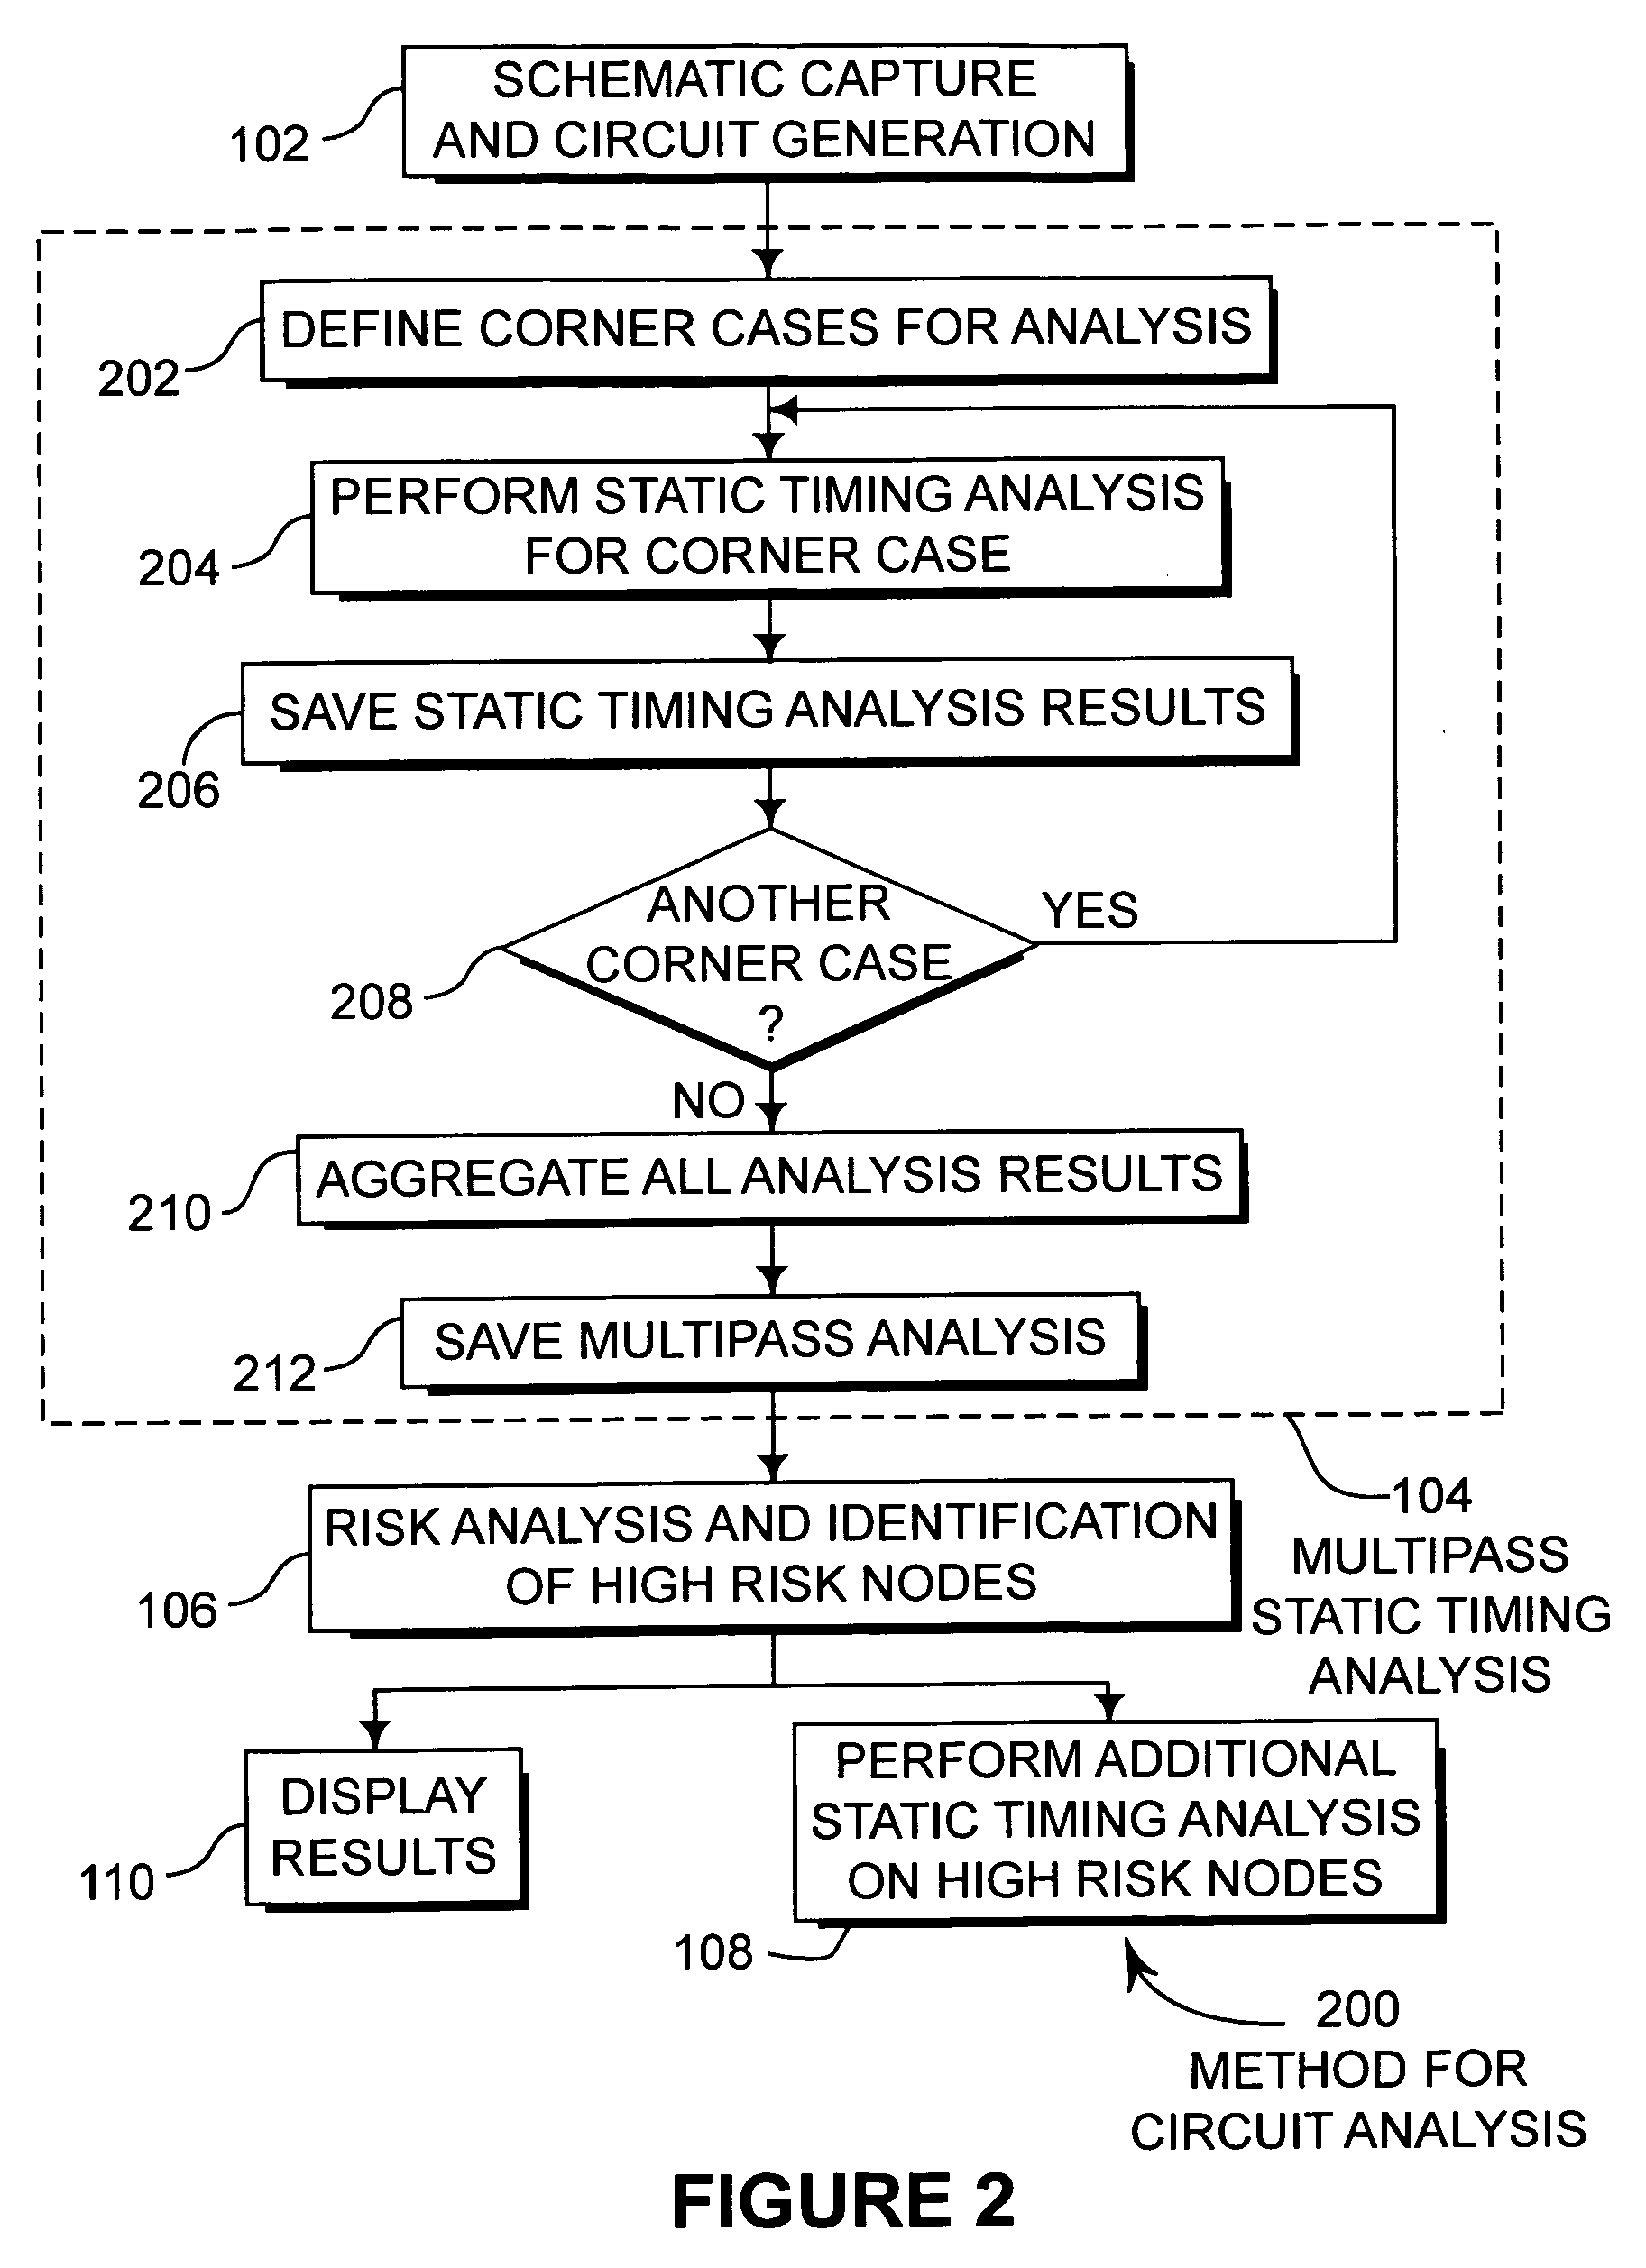
[0043]FIG. 2 is a flowchart illustration of an embodiment 200 of a method for analyzing a complex circuit, particularly detailing a multipass static timing analysis method. The circuit is designed using a schematic capture and circuit generation tool in block 102. Within the multipass static timing analysis block 104, the corner cases for the analysis are defined in block 202. The static timing analysis is performed using one of the corner cases in block 204, the results of which are saved in block 206. If another corner case needs to be run in block 208, the process continues with block 204. If no other corner cases need to be run in block 208, all of the analysis results are aggregated in block 210 and saved in block 212. The results of the multipass static timing analysis block 104 are processed for risk analysis in block 106. The risk analysis results may be used to perform additional static timing analysis in block 108 or may be displayed in block 110.

[0044]The multipass static...

embodiment 300

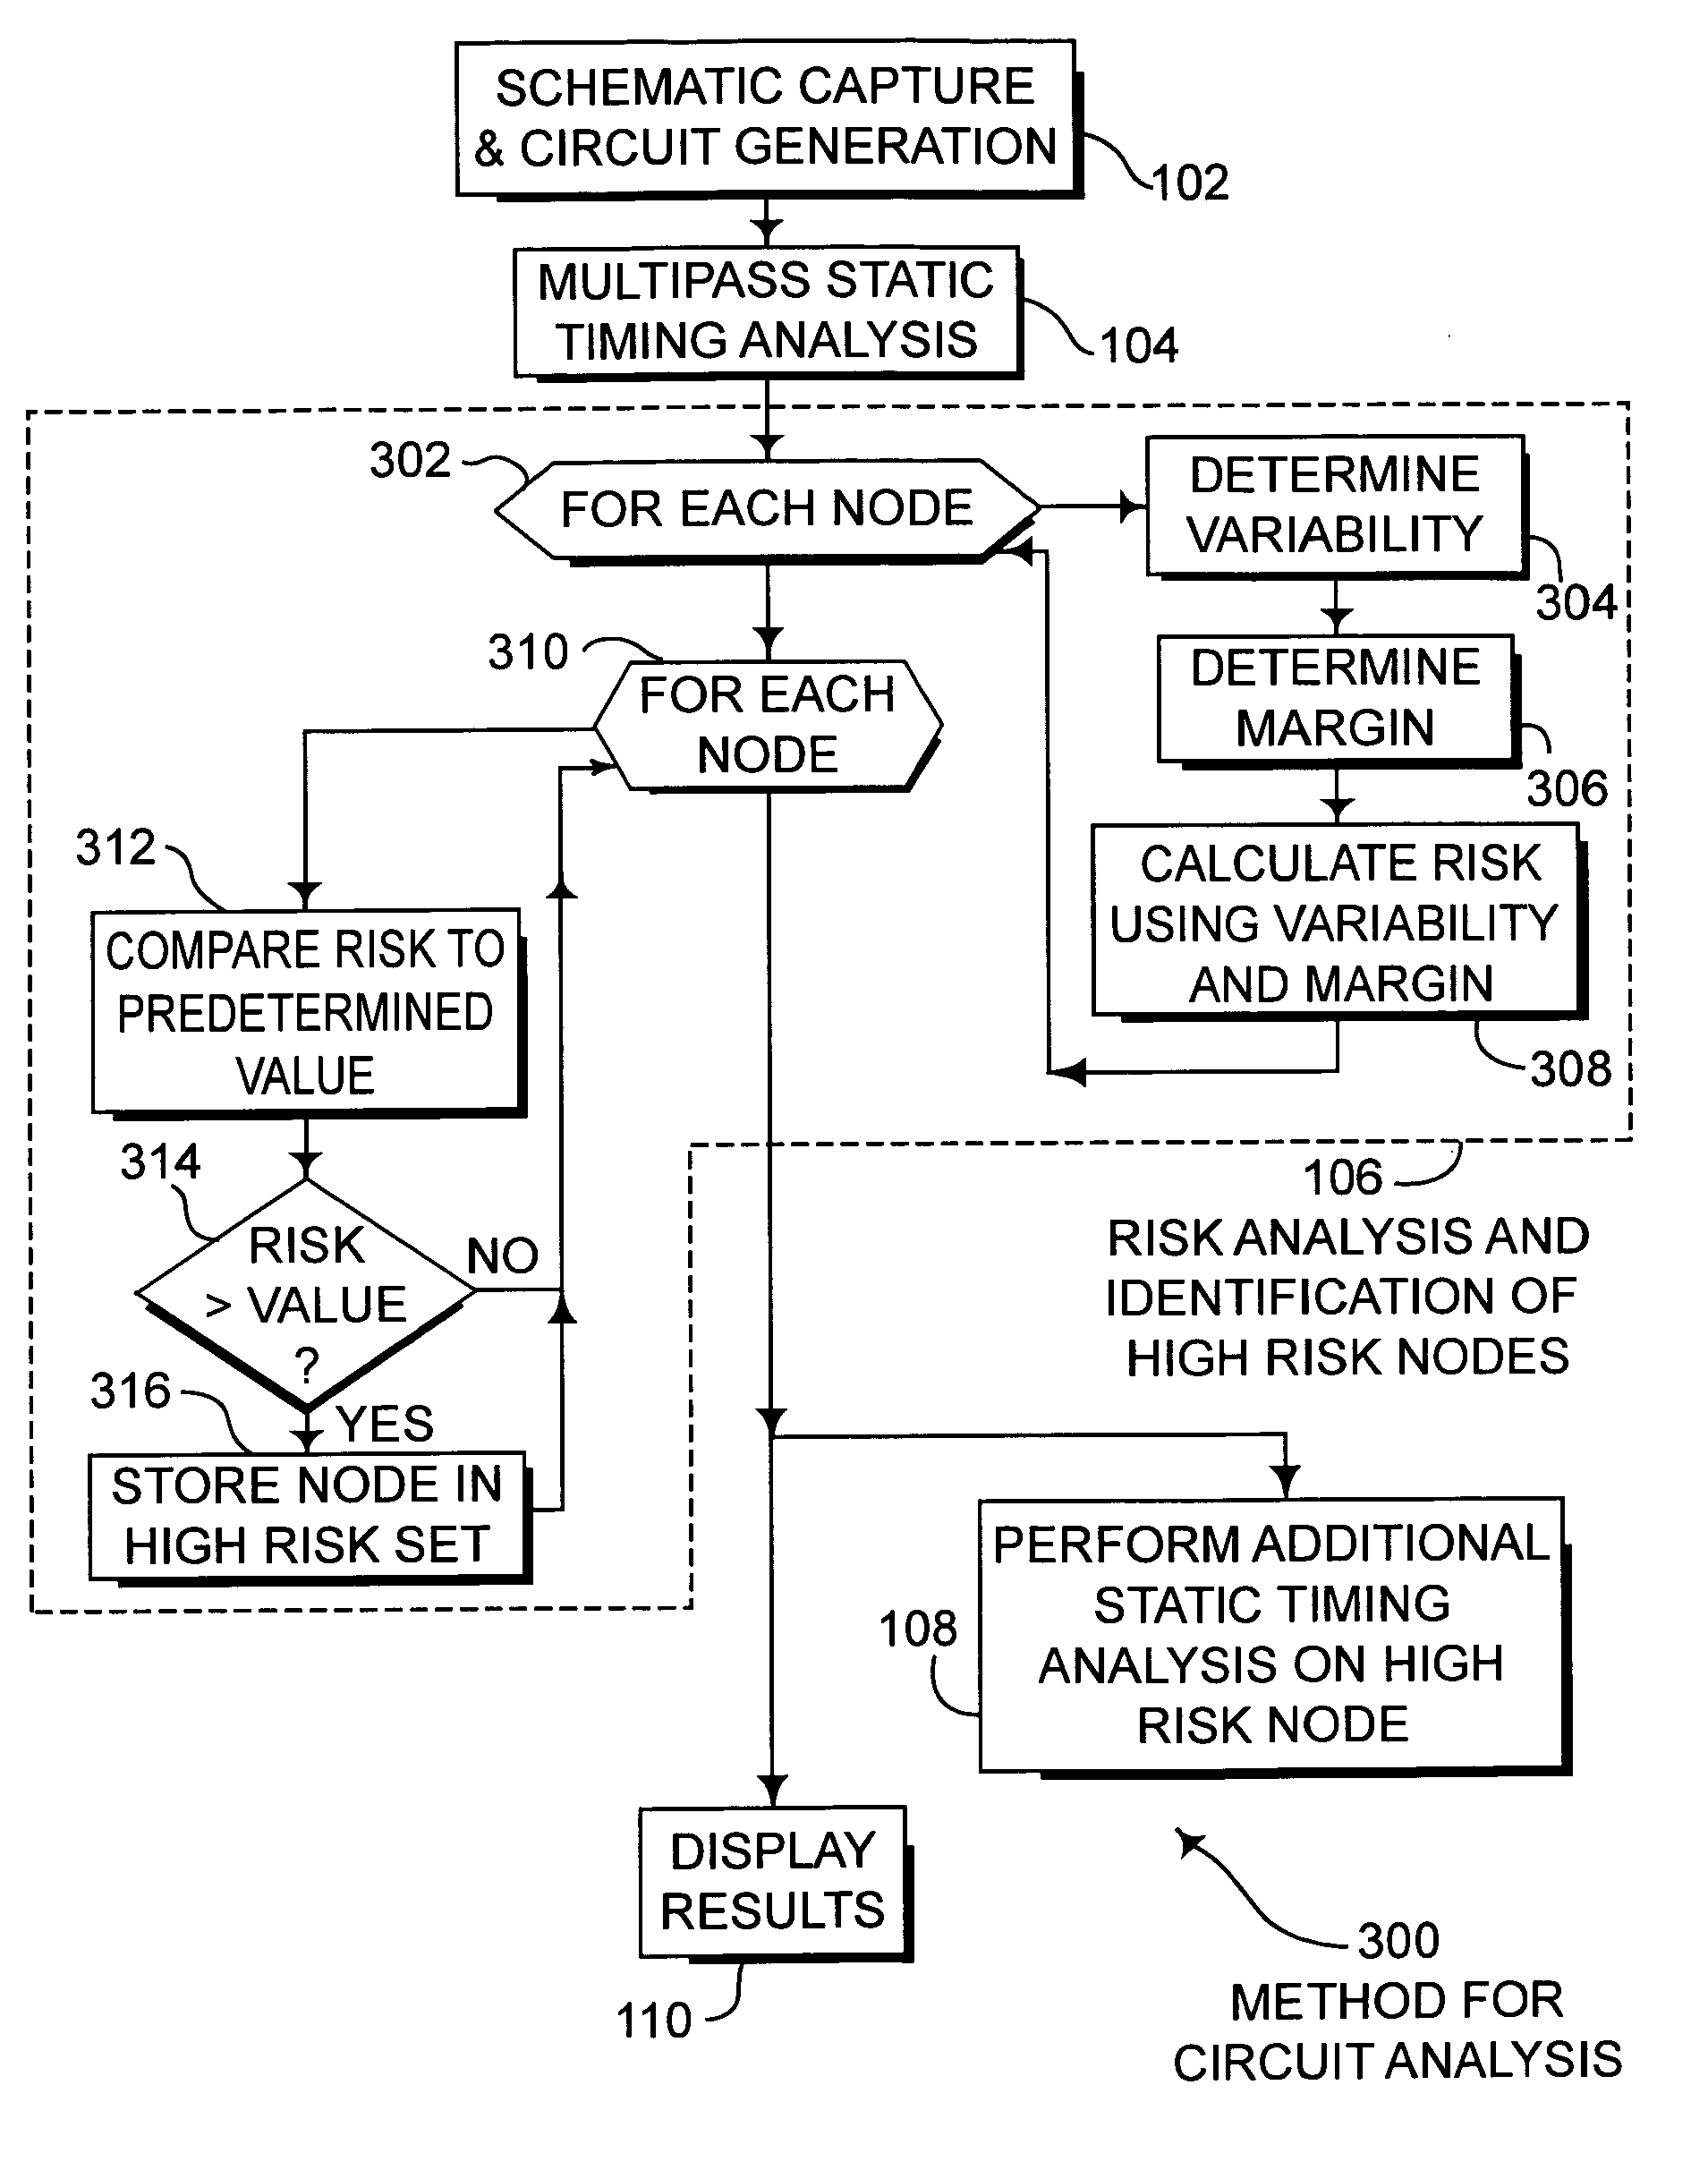
[0048]FIG. 3 is a flowchart illustration of an embodiment 300 showing a method for circuit analysis with a detailed illustration of the risk analysis and identification of high risk nodes. The circuit is created and defined in the schematic capture and circuit generation block 102. The multipass static timing analysis is performed in block 104. Within the risk analysis block 106, for each node in block 302, the variability of each parameter is determined in block 304, the margin is determined in block 306, and the risk is calculated in block 308. For each node in block 310, the risk is compared to a predetermined value in block 312. If the risk is greater than the value in block 314, the node is stored in a high risk set in block 316. After all the nodes are processed, additional static timing analysis may be performed in block 108 on the subset of nodes defined as high risk in 316 and the results may be displayed in block 110.

[0049]The embodiment 300 illustrates a method whereby a ...


PUM


Abstract

A system and method for evaluating multiple corner case static timing analyses. For each node within the analysis, the variability and margin of the node is used to create a risk factor that is used to identify nodes for further analysis. In some cases, a subset of nodes may be selected for static timing analysis with several additional corner cases. The variability of the node may be determined by the difference between the maximum and minimum value of the node between corner case analyses. The margin may be determined by the difference between the actual timing and the required timing. Various ratios using variability and margin may be used to identify those nodes on which to perform further analysis.

Description

CROSS REFERENCE TO RELATED APPLICATIONS[0001]This application is a continuation-in-part of U.S. patent application Ser. No. 10 / 232,423, filed Aug. 28, 2002, now issued U.S. Pat. No. 6,851,098, the entire contents of which are specifically hereby incorporated by reference for all it teaches and discloses.BACKGROUND OF THE INVENTION[0002]a. Field of the Invention[0003]The present invention pertains generally to tools used to analyze integrated circuits during design and specifically to combining multiple static timing analyses in a useful manner.[0004]b. Description of the Background[0005]Integrated circuits (ICs) are extremely complex and contain an enormous number of components or cells. As the size of these components decreases, even more components can be manufactured on a single IC. The complexity of the ICs makes debugging an IC difficult and very labor intensive. Further, the sheer number of components, sometimes in the millions, may make pinpointing a problem area an enormous ...

Claims


Application Information

Patent Timeline
Patent Type & Authority Patents(United States)
IPC IPC(8): G06F17/50
CPCG06F17/5031G06F30/3312
Inventor SCHULTZ, RICHARD T
Owner BELL SEMICON LLC
Why Eureka
Try Eureka