User interface for an electronic trading system

a technology of electronic trading system and user interface, which is applied in the direction of static indicating device, 2d-image generation, instruments, etc., can solve the problems of difficult for a trader to quickly gather information from diverse and often unrelated sources, complicating the task of ascertaining trends, and affecting the effect of market conditions, so as to improve the ability of the trader to quickly determine his or her relative position in the marketplace, and to make informed decisions quickly

Inactive Publication Date: 2007-05-01
TRADING TECH INT INC +1
View PDF61 Cites 318 Cited by
  • Summary
  • Abstract
  • Description
  • Claims
  • Application Information

AI Technical Summary

Benefits of technology

[0006]The present invention is a user interface for an electronic trading system that allows a remote trader to view trends in the orders for an item, and provides the trading information in an easy to see and interpret graphical format. The user interface of the present invention operates in a system in which individual traders place orders including bids and offers, on remote client terminals, and this information is routed to a transaction server. The transaction server receives order information from the remote terminals, matches a bid for an item to an offer for an item responsive to the bid corresponding with the offer, and communicates outstanding bid and offer information back to the client terminals. Thus, in accordance with the present invention, each client terminal displays all of the outstanding bids and offers for an item, in contrast to the conventional systems and methods in which only the highest bid and lowest offer were known to the individual trader. This allows the trader to view trends in orders for an item, and thus better enables the trader to anticipate demand for the item.
[0008]The user interface of the present invention presents this information in an intuitive format, allowing the trader to make informed decisions quickly. In a priority view embodiment, bid and offer icons are displayed corresponding to an axis of values. This results in the bid icons being displayed on the lower portion of the screen and the offer icons being displayed on the upper portion of the screen. The trader is able to discern immediately the number and volume of bids and offers outstanding for the item and their difference in value. The bids and offers are preferably displayed in different colors, shapes, or other visual characteristics, further enhancing the trader's ability to quickly ascertain the current state of the market. The screen is updated frequently to display the most recent bids and offers. In one embodiment, the icons are formed having an edge which is angled toward the axis of values. When all outstanding offers and bids are displayed, the arrangement of icons naturally forms the edges of a triangle that points to the value differential at the axis of values. In yet another embodiment, the trader's own bids and offers are displayed in a first color or other visual characteristic, and the bids and offers of other traders are displayed in a second color or visual characteristic. This allows the trader to quickly determine his or her relative position in the marketplace. Finally, in a preferred embodiment, a size of the icons represents the quantity of the bid or offer, allowing an easy visual means of determining the relative quantities each bid and offer represent.
[0009]In a value / quantity view embodiment, an axis of values and an axis of quantities are used to determine the location of the bid and offer icons. The icons in this embodiment are markers or tokens and provide a different look and feel to the trader. Providing alternate views allow a trader to select a view with which the trader is most comfortable trading.
[0010]A value quantifying analytic is displayed in a further embodiment with respect to the value axis at a location corresponding to the current value which the analytic represents. The analytic is preferably displayed as a marker called an action line, in a color or other visual characteristic different from the other characteristics used to represent other objects being displayed. The action line is selected by each individual trader and can reflect value-to-earning ratio, volatility, volume of sales, or any other metric the trader designs, or can be selected from a listed of predetermined metrics. The action line responds to changes in the data it measures, updating in essentially real time. The action line allows the trader to immediately determine the current valuation of the item relative to the trader's own valuation of the item. As the offers or bids approach the action line, the trader is prepared to complete a transaction in accordance with the trader's own valuation.
[0012]An alternate embodiment provides a trading pit view that displays trader icons for each trader and positions the trader icons reflective of the activity level of the trader. Floor brokers and other bystanders are also displayed and identified to allow the trader to understand at a glance the respective positions and activity of all users currently connected to the transaction server for that trading pit. Selecting a trader icon provides information regarding the trader and can open up a window to allow the traders to communicate with each other using one or more methods including electronic mail, text chat or communication by voice over a network connection. The trading pit view allows the remote trader to immediately ascertain whom the trader is trading against, how active they are, and allows the trader to better anticipate the market.

Problems solved by technology

However, for an individual trader, having only the latest order information for an item complicates the trader's task of ascertaining trends in the orders for an item because the trader has very little information about the volume of offers and bids or the rate at which these volumes are changing.
However, it is often difficult for a trader to quickly assemble this information from diverse and often unrelated sources or even effectively process all of this information in order to make an informed transaction decision.

Method used


Image

  • User interface for an electronic trading system
  • User interface for an electronic trading system
  • User interface for an electronic trading system

Examples


Embodiment Construction

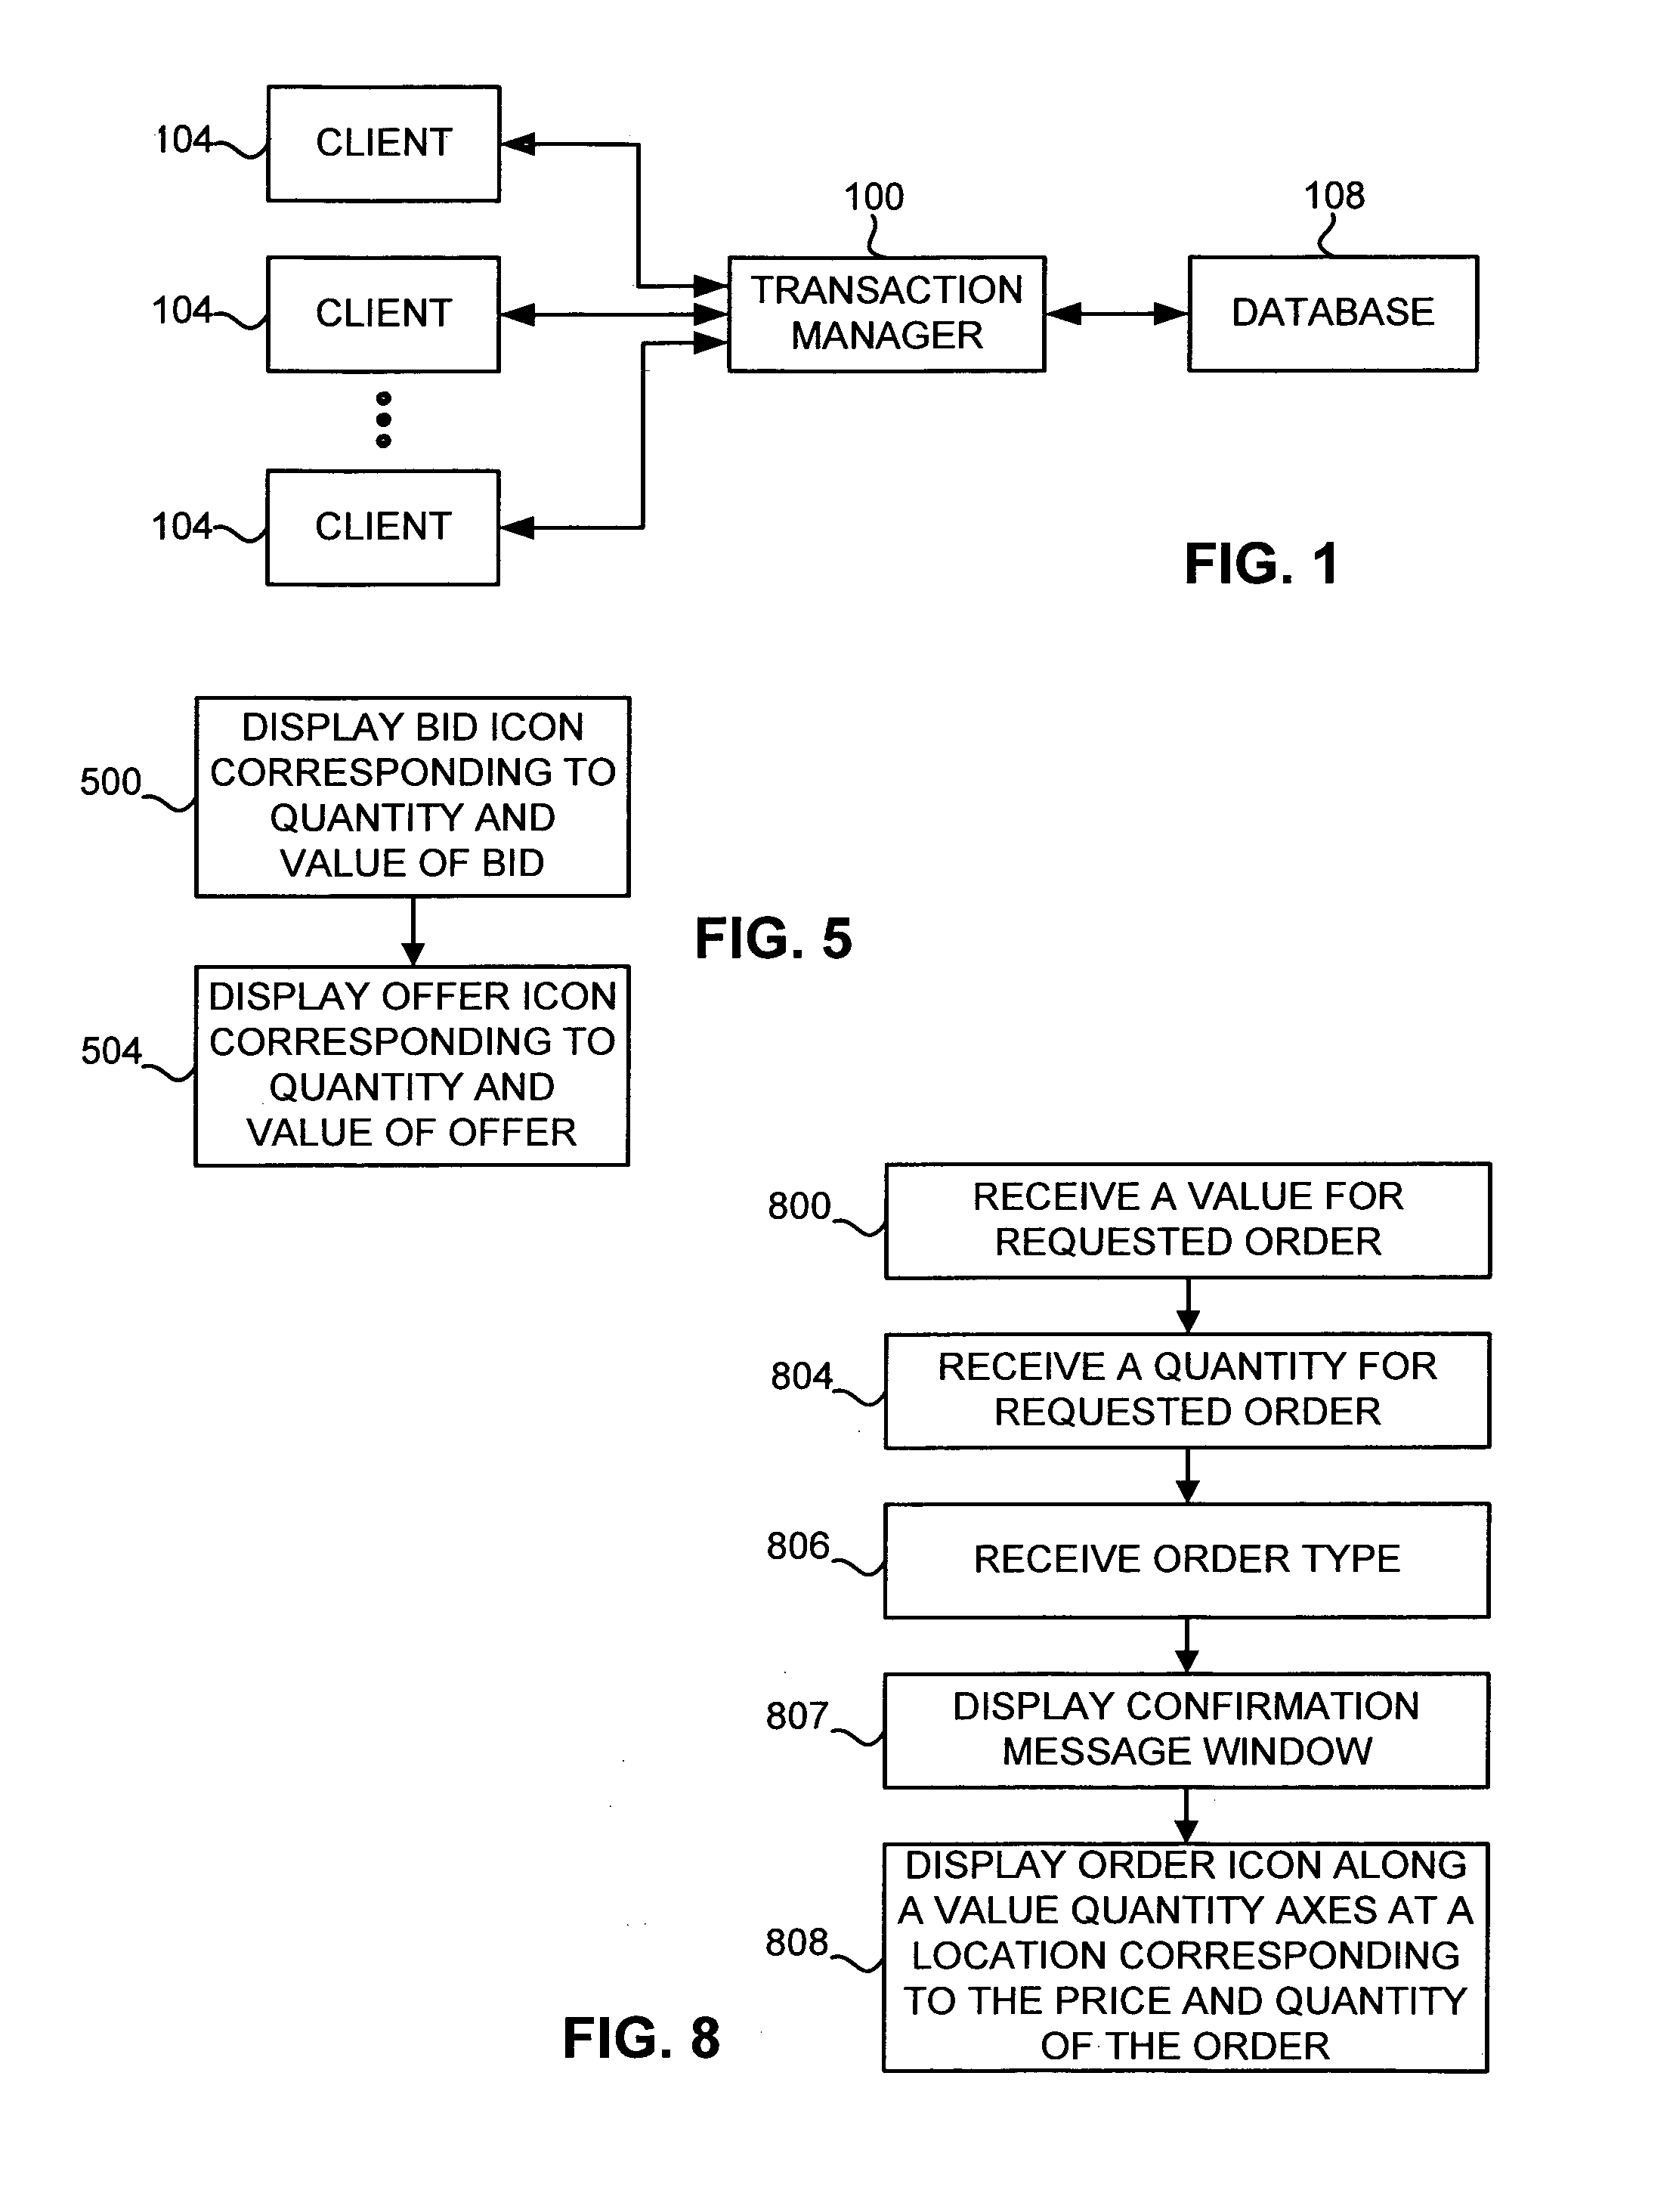
[0026]FIG. 1 illustrates the electronic trading system in accordance with the present invention. Client terminals 104 are coupled to a transaction manager 100. The client terminals 104 are personal computers, terminals as part of a network, or any other computing device. Traders use the client terminals 104 to interact with trading pits that are managed by the transaction manager 100. The transaction manager 100 manages transaction requests generated by the client terminals 104, routes information to, from, and between the terminals 104 and the transaction manager 100, and stores and retrieves information from a database 108 or databases 108.

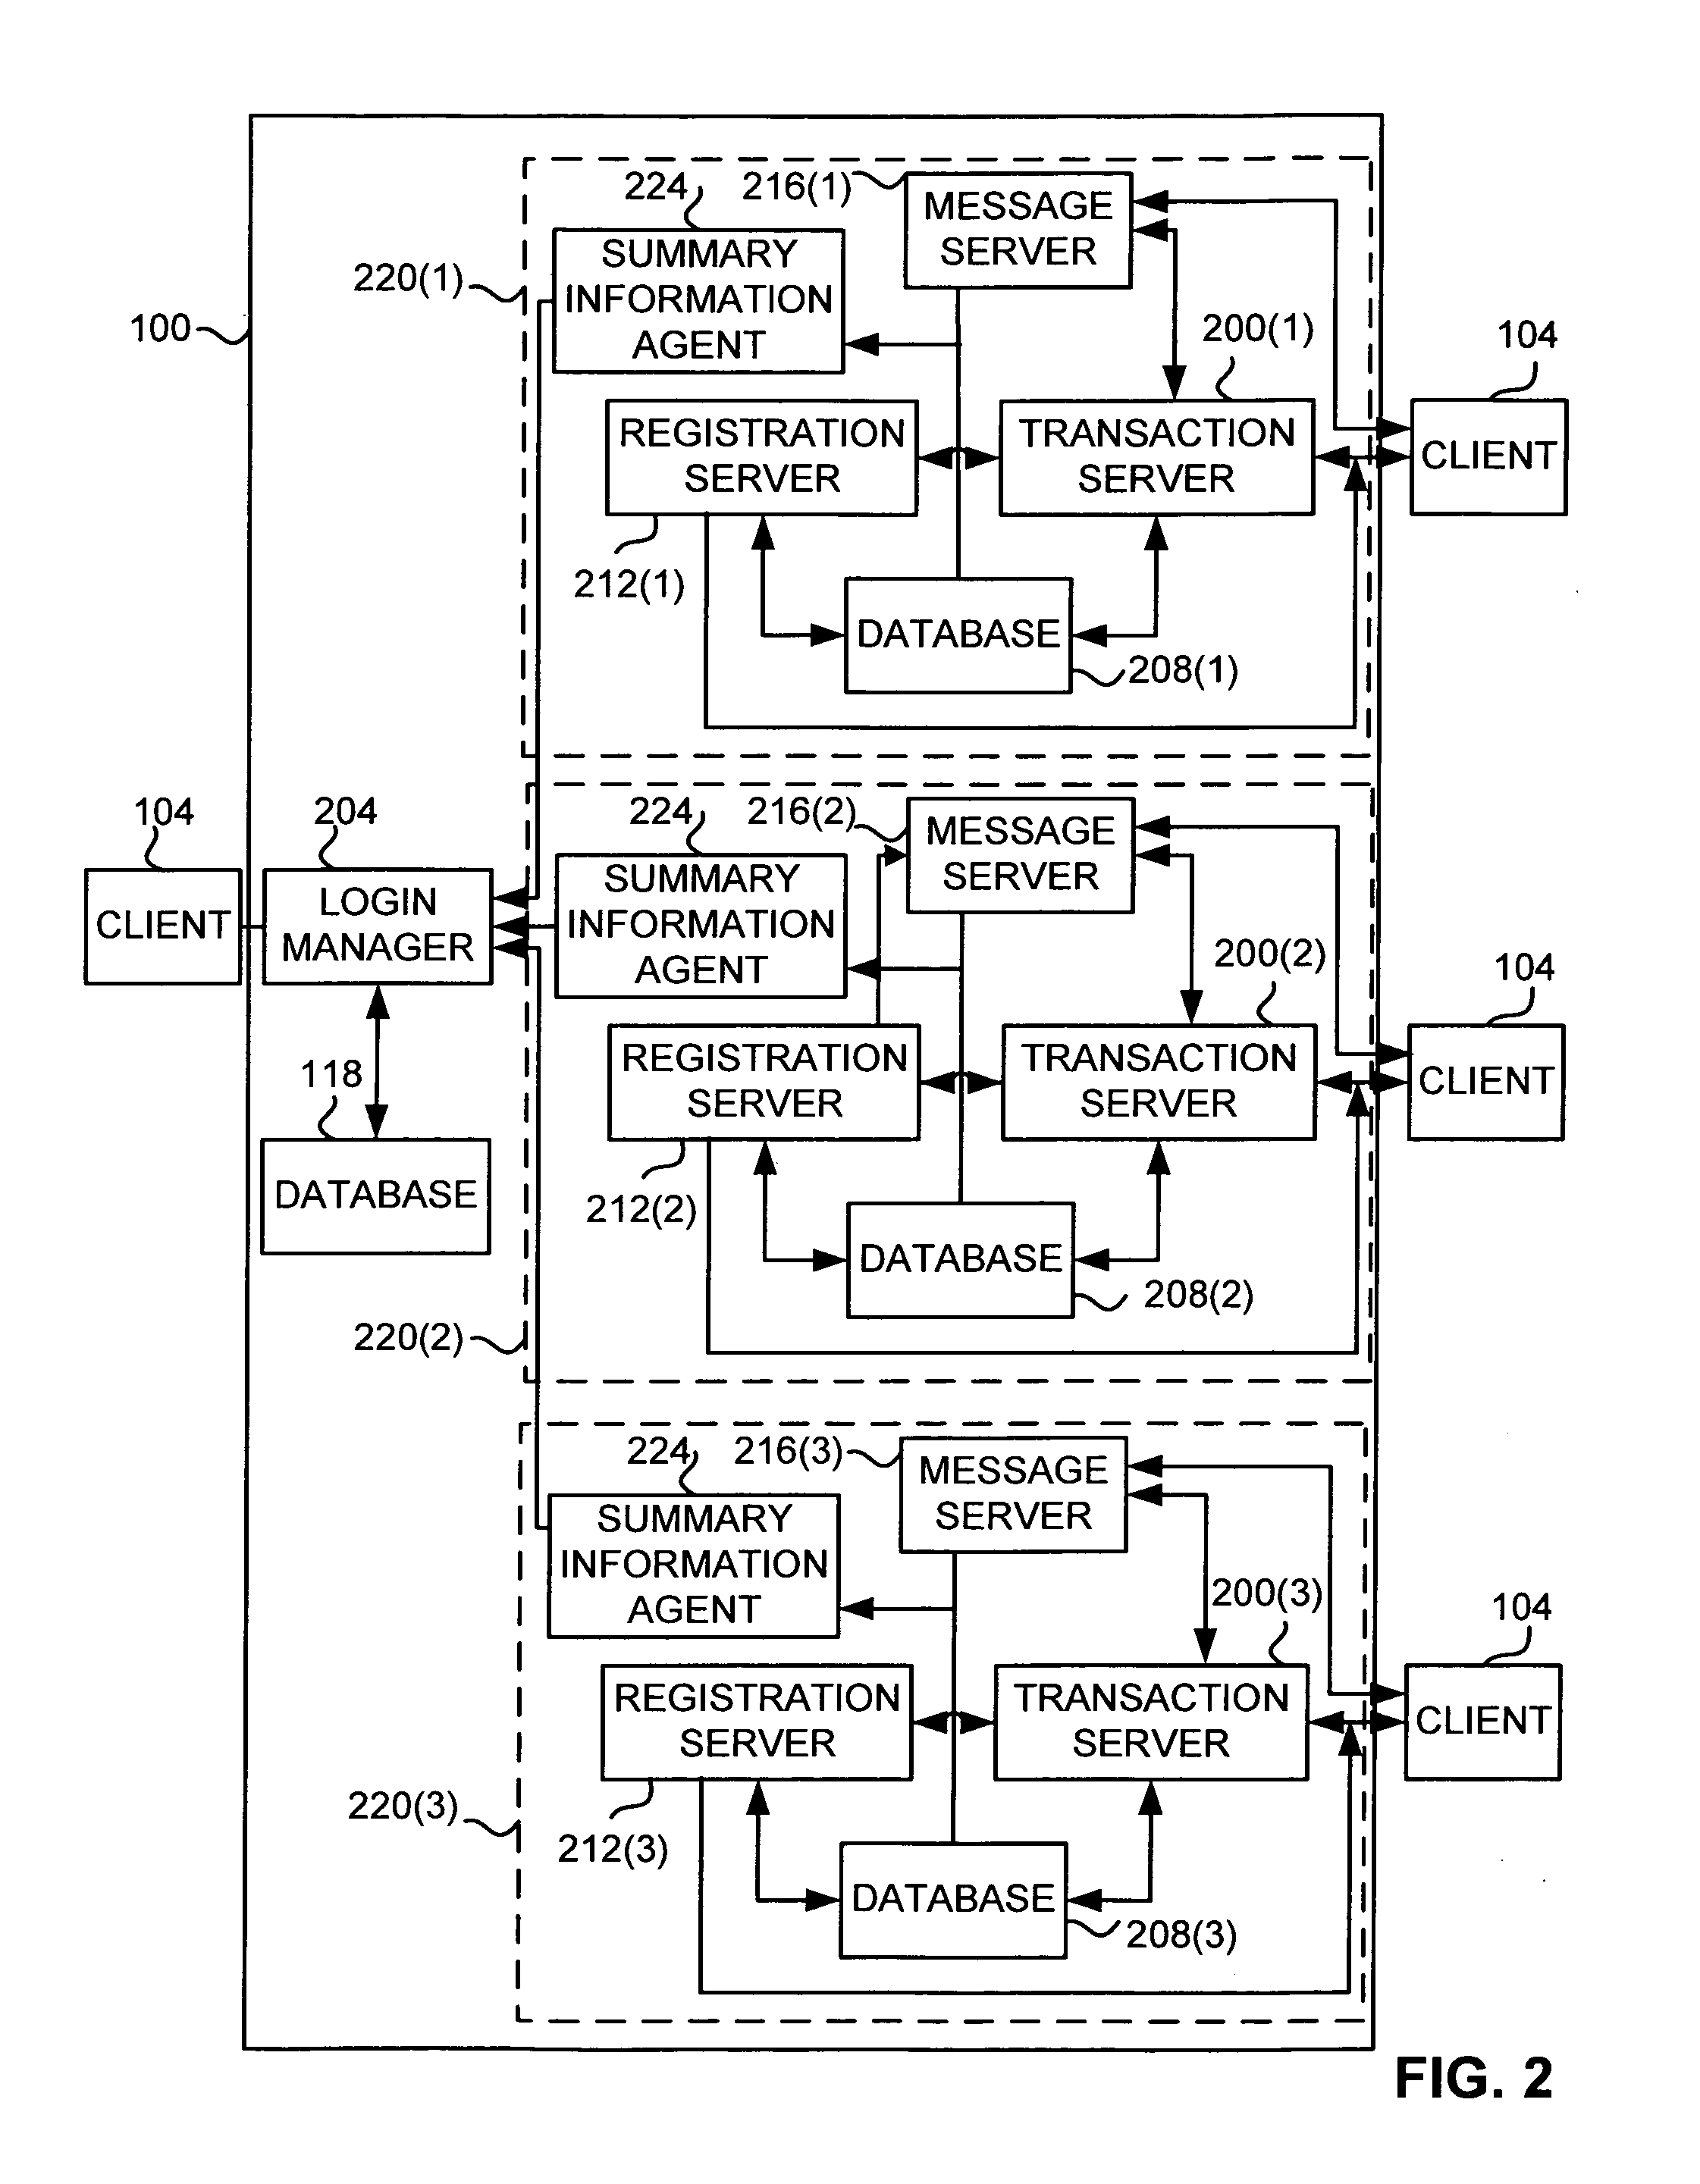
[0027]FIG. 2 illustrates a more specific embodiment of the transaction manager 100. The clients 104 are coupled to log-in manager 204 to provide to each client access to the transaction manager 100, and to allow each client 104 to designate one or more trading pit 220 to which to be connected. The transaction manager 100 hosts one or more transa...


PUM


Abstract

A user interface for an electronic trading exchange is provided which allows a remote trader to view in real time bid orders, offer orders, and trades for an item, and optionally one or more sources of contextual data. Individual traders place orders on remote client terminals, and this information is routed to a transaction server. The transaction server receives order information from the remote terminals, matches a bid for an item to an offer for an item responsive to the bid corresponding with the offer, and communicates outstanding bid and offer information, and additional information (such as trades and contextual data) back to the client terminals. Each client terminal displays all of the outstanding bids and offers for an item, allowing the trader to view trends in orders for an item. A priority view is provided in which orders are displayed as tokens at locations corresponding to the values of the orders. The size of the tokens reflects the quantity of the orders. An alternate view positions order icons at a location which reflects the value and quantity of the order. Additionally, contextual data for the item is also displayed to allow the trader to consider as much information as possible while making transaction decisions. A pit panel view is also provided in which traders connected to the pit are represented by icons, and are displayed corresponding to an activity level of the trader.

Description

TECHNICAL FIELD [0001]The present invention relates generally to the field of graphical user interfaces and more particularly to the field of graphical user interfaces for electronic trading systems.BACKGROUND OF THE INVENTION [0002]Trading pits are the lifeblood of a market economy. Quantities of goods and shares in companies are bought and sold by millions of investors through trading pits on exchanges everyday. When a particular trading product or item is more valued, the value of the item is driven up as a result of more aggressive bidding by the buyers. When an item is less valued, the value of the item is driven down as a result of more aggressive offers to sell the item. The successful trader anticipates the rise or fall of the value of an item and performs his or her own transaction before-the rest of the market is aware of the item's potential gain or loss in value. Thus, anticipation of the market and specifically of the future demand for an item of interest is critical to...

Claims


Application Information

Patent Timeline
Patent Type & Authority Patents(United States)
IPC IPC(8): G06Q40/00G06F3/00G06F3/048G06F15/00G06F17/00G06Q20/10G06Q30/08
CPCG06Q30/08G06Q40/00G06Q40/04G06Q40/06G06Q20/10
Inventor FRIESEN, RICHARD W.HART, PETER C.
Owner TRADING TECH INT INC
Why Eureka
Try Eureka