Method for comparing customer and test load data with comparative functional coverage hole analysis

a functional coverage and customer technology, applied in the field of data operations, can solve the problems of difficult to separate produce too much data to easily filter important data from unimportant data, and achieve the effect of accurate operational test profiles and efficient comparison of customer and test profiles

Inactive Publication Date: 2009-12-22
IBM CORP
View PDF12 Cites 24 Cited by
  • Summary
  • Abstract
  • Description
  • Claims
  • Application Information

AI Technical Summary

Benefits of technology

[0008]One aspect of the present invention includes an enhanced use of comparative functional coverage holes analysis. In one embodiment, the various forms of coverage holes analysis are performed on one source of data (usually test data), while checking each of the holes on the other source of data (usually customer data). A full report produced by the coverage holes analysis will illustrate holes divided into three categories: (1) holes on both sets of data, (2) holes on customer data (i.e., no matching holes in test data), (3) holes on test data (i.e., no matching holes in customer data).

Problems solved by technology

However, as illustrated below, the establishment of an accurate operational test profile and an efficient comparison of the customer and test profiles are not easily accomplished by existing methods in the art.
However, because there are cases when thousands of parameters and attributes are compared, it is difficult to separate important data from unimportant data.
For example, the model could be to “check that every sends every possible to every other .” However, these models may produce too much data to easily filter important data from unimportant data.
Hole analysis techniques, however, have not been applied within test applications to produce comparisons between test and customer data, and similarly have not been applied within functional coverage tools.

Method used


Image

  • Method for comparing customer and test load data with comparative functional coverage hole analysis
  • Method for comparing customer and test load data with comparative functional coverage hole analysis
  • Method for comparing customer and test load data with comparative functional coverage hole analysis

Examples


Embodiment Construction

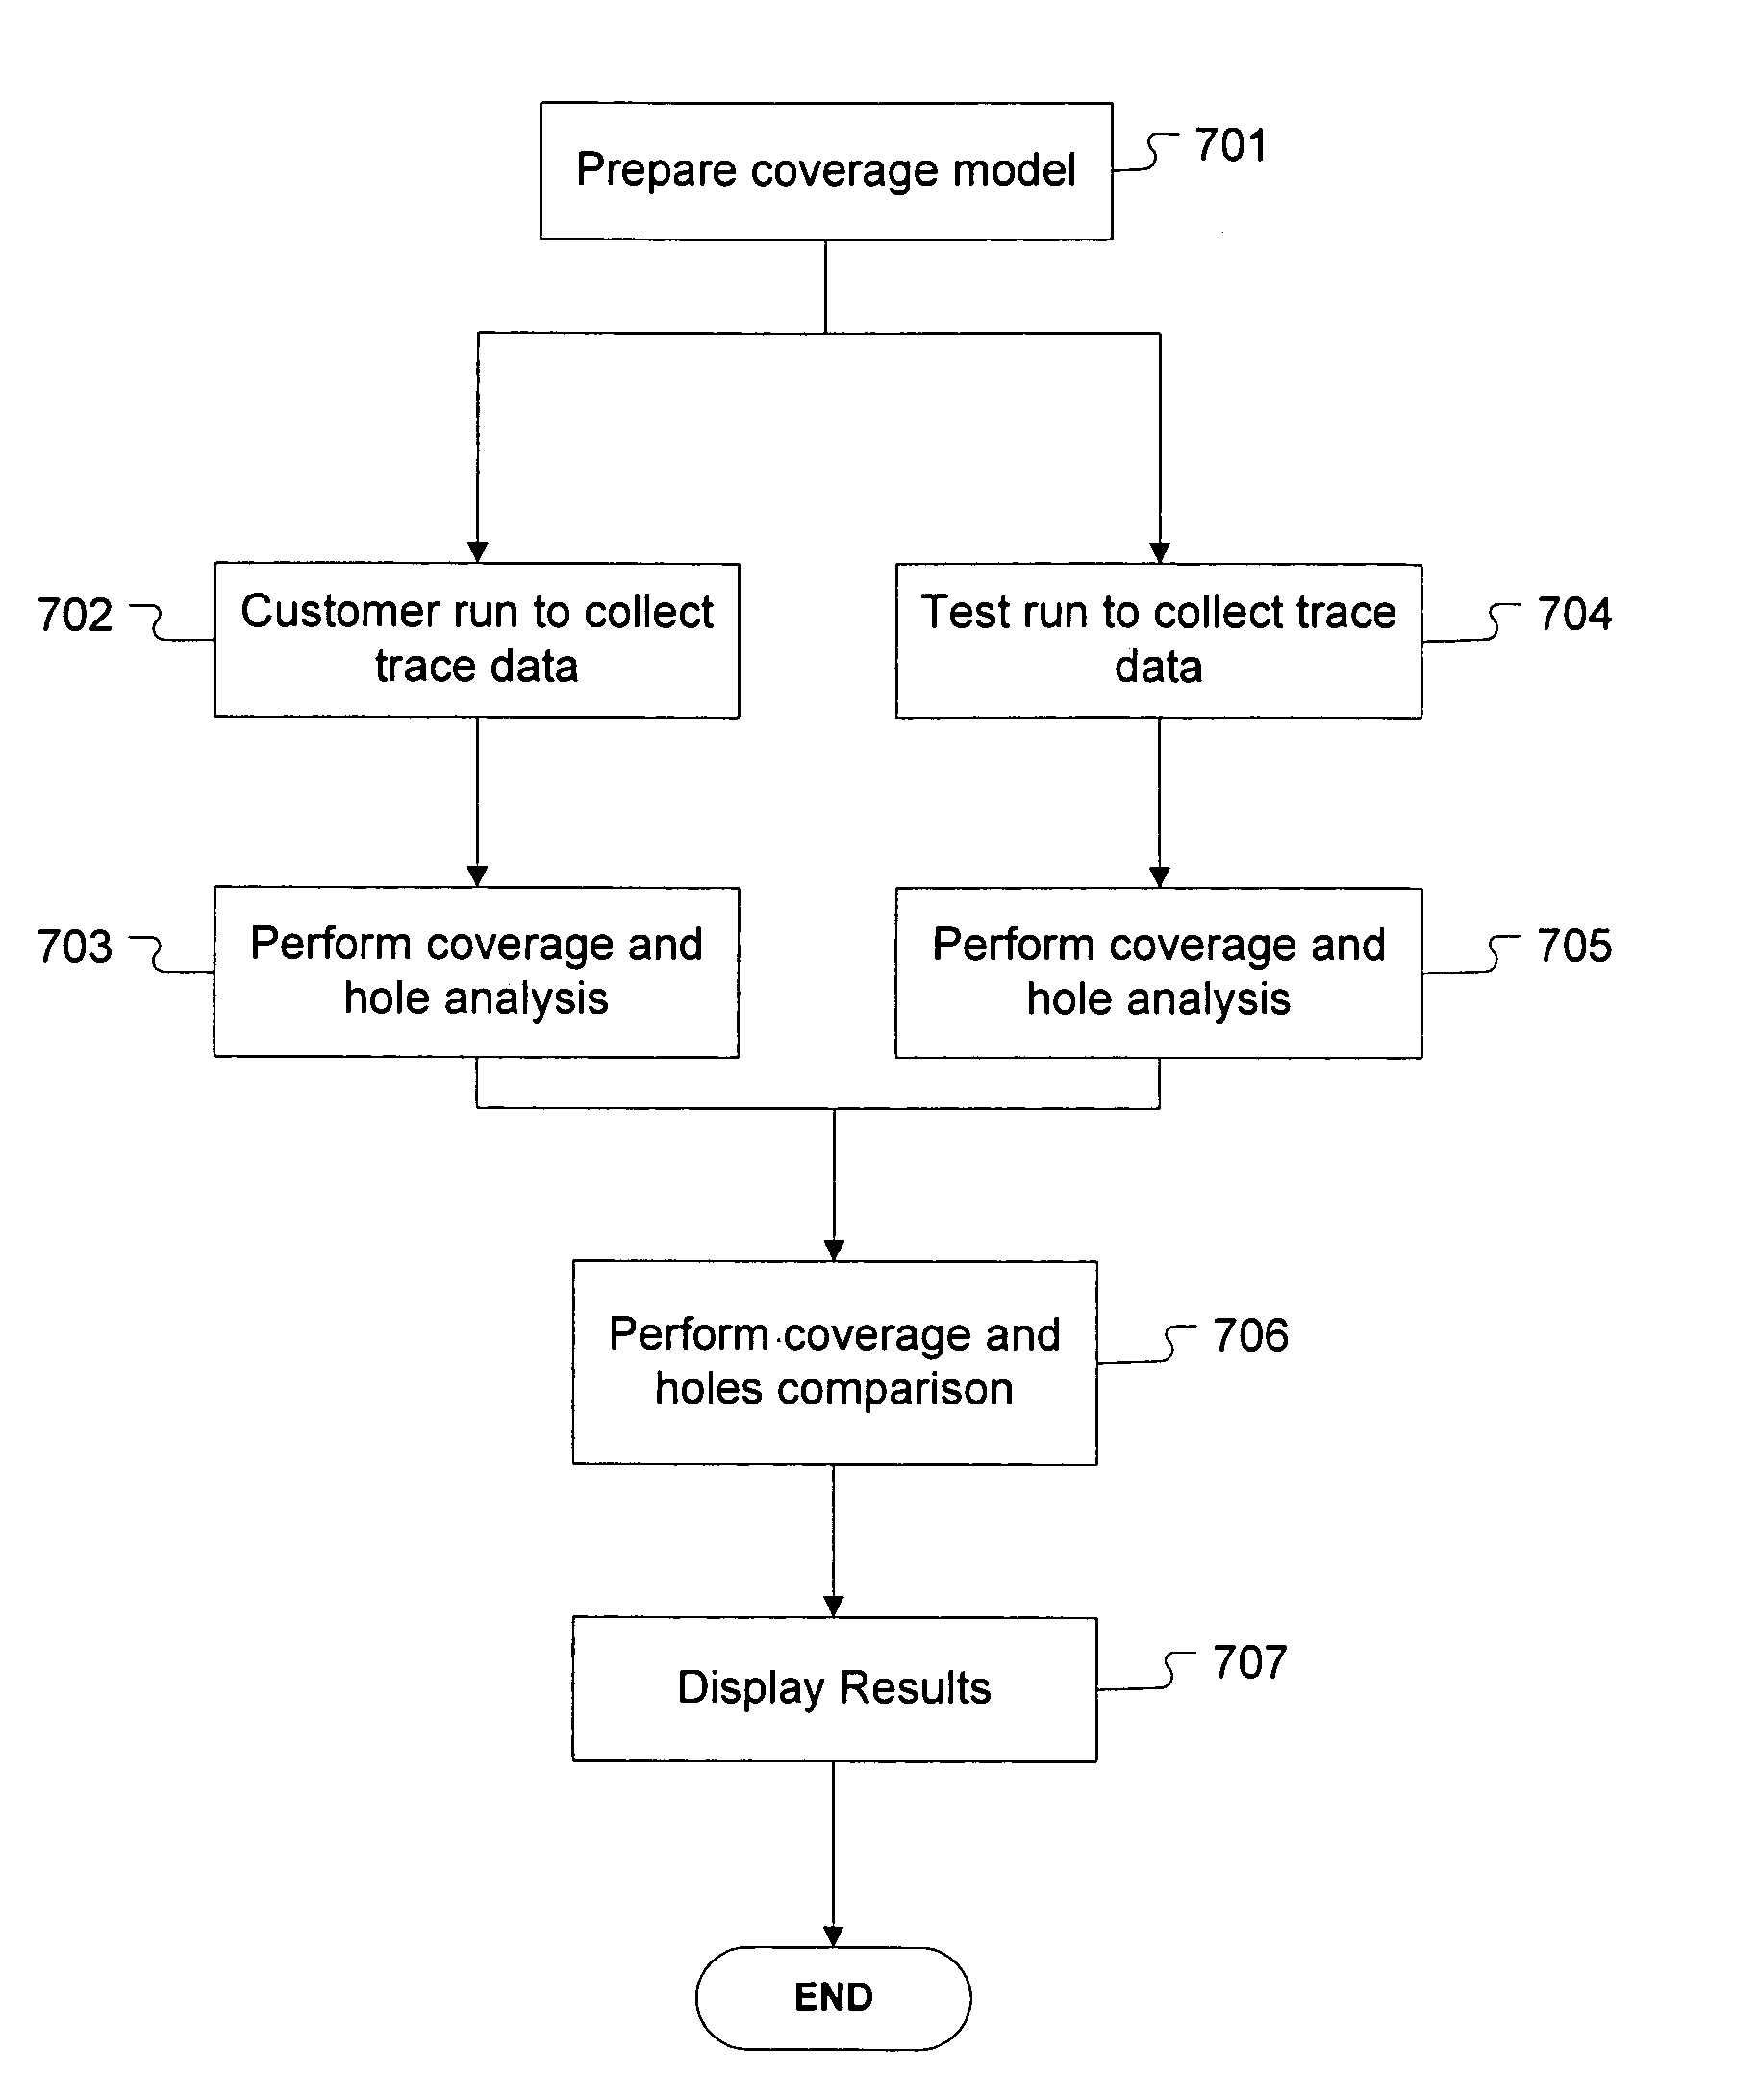
[0021]One aspect of the present invention includes enhanced operations used for comparisons of test data. In order to reduce the amount of work done to collect data (e.g., instrumentation and special scripting) and to enable exploration of the data, the present disclosure explains a functional coverage methodology augmented for comparative functional coverage reports and functional coverage holes analysis. With the application of real data and enhanced capabilities to a general functional coverage data methodology, numerous trends and behaviors can be discovered to distinguish test data from the actual customer data.

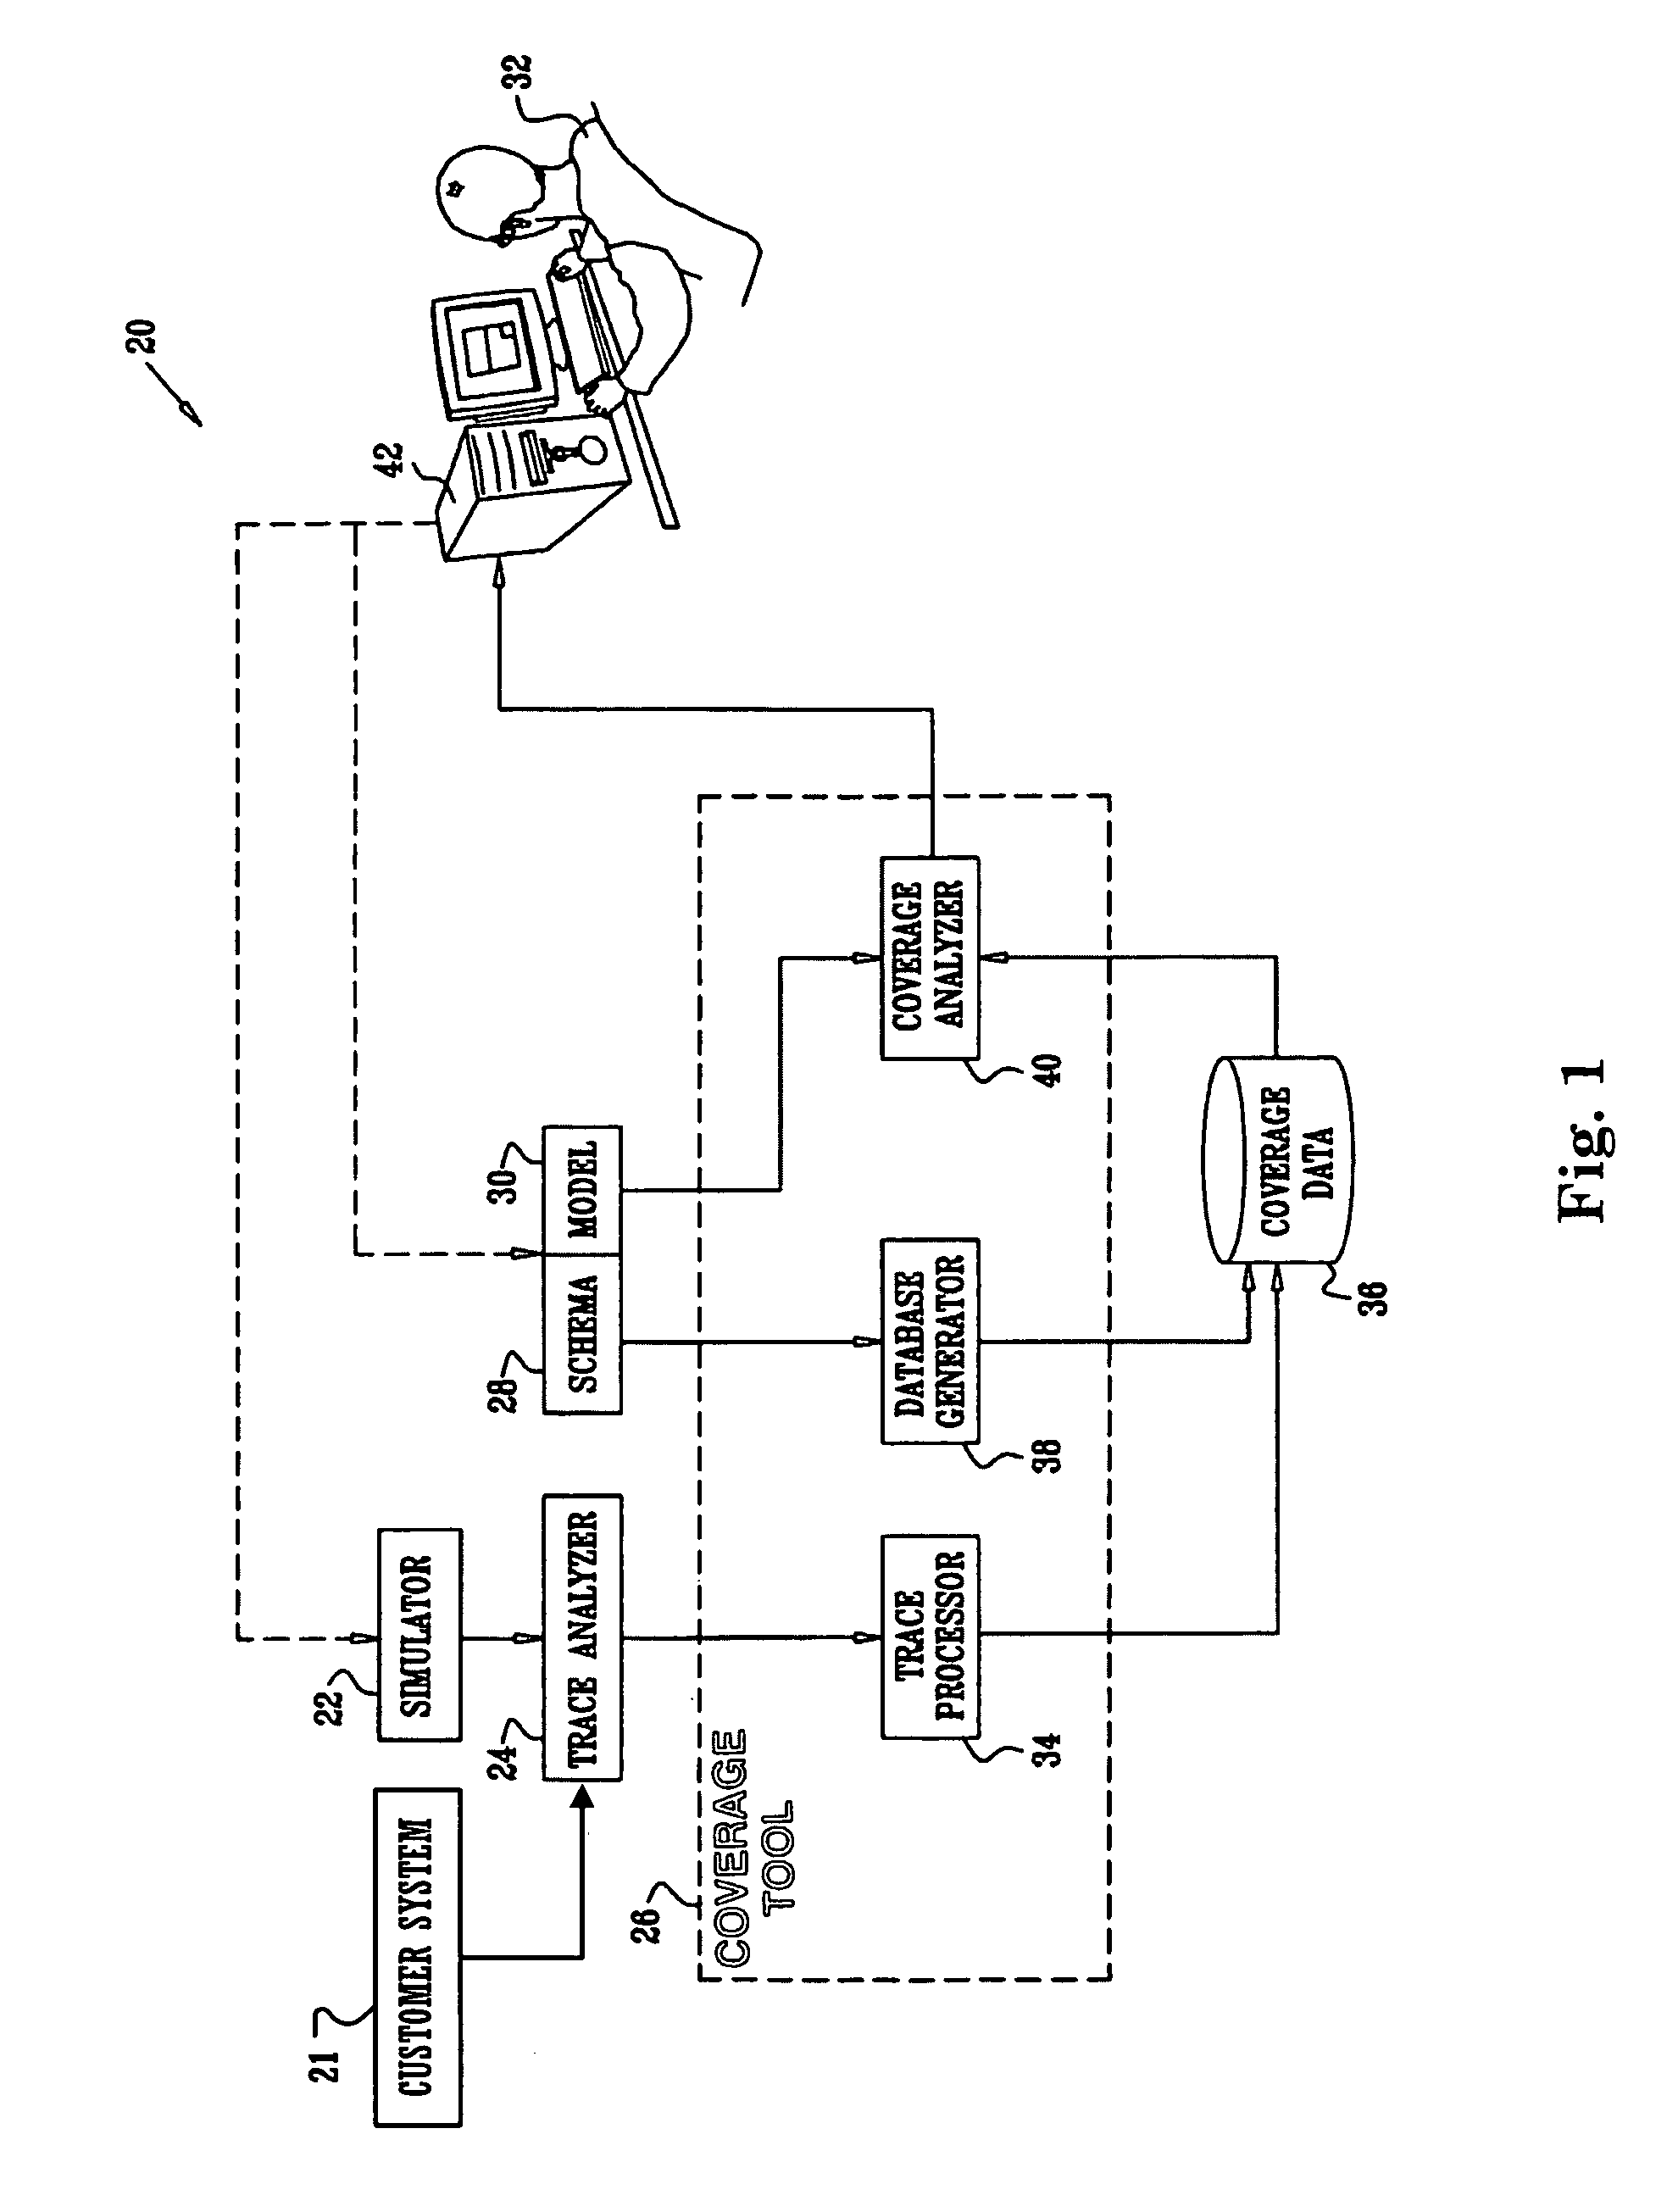
[0022]FIG. 1 depicts an operation 20 for performing analysis of input from a customer system 21 and a test (simulator) 22 in accordance with one embodiment of the present invention. A simulator 22 runs a suite of tests on a design under test, and a trace analyzer 24 generates trace data, containing lists of events that occurred during testing and within the customer syst...


PUM


Abstract

One aspect of the present invention includes performance of a comparative functional coverage technique for comparing analysis of actual operational load data, such as customer data, with test operational load data. In one embodiment, coverage and holes analysis operations are performed on each of actual trace data produced by the operation of actual activities, and test trace data produced by the operation of a simulation within a test execution. The functional coverage and hole analysis results produced for each of the actual data source and the test data source are then compared to discover the most important functional holes relevant to testing, namely holes which appear only in the test but not within the actual operation. The results of the holes comparison detailing which holes exist within the test are then presented and ultimately utilized to improve the test.

Description

FIELD OF THE INVENTION[0001]The present invention generally relates to data operations performed within a testing environment. The present invention more specifically relates to a comparison of actual operational load data with test operational load data using comparative functional coverage and functional coverage hole analysis operations.BACKGROUND OF THE INVENTION[0002]Emulating customer data for the purpose of data testing is a common practice. The idea is to create a load in test such that an operational test “profile” is similar to the profile of the actual customer data. The way that customer and test load data are typically compared is that many parameters are evaluated over both profiles and the differences are compared. However, as illustrated below, the establishment of an accurate operational test profile and an efficient comparison of the customer and test profiles are not easily accomplished by existing methods in the art.[0003]Some test teams profile a customer's work...

Claims


Application Information

Patent Timeline
Patent Type & Authority Patents(United States)
IPC IPC(8): G06F11/00
CPCG06F11/3676
Inventor BLUE, DALE E.UR, SHMUEL
Owner IBM CORP
Why Eureka
Try Eureka