
Method of determining a seismic velocity profile

a velocity profile and seismic technology, applied in the field of method of determining a seismic velocity profile, can solve the problems of difficult to relate arrival time to velocity, erroneous velocity profiles, and difficulty in extraction of velocity profiles from check shots

Active Publication Date: 2010-04-27
SHELL USA INC
View PDF9 Cites 13 Cited by
  • Summary
  • Abstract
  • Description
  • Claims
  • Application Information

AI Technical Summary

Problems solved by technology

A complex overburden may lead to erroneous velocity profiles when conventional check-shots and zero-offset vertical seismic profiles (VSP) are used.
When there is a complex transmission medium between the set of seismic sources and the region of interest, such as for example a complex overburden, the extraction of velocity profiles from check shots is a challenging task.
First arrival waveforms may be distorted and difficult to pick as a result of the complex transmission medium, and the fastest arrival may not even come along the shortest path between the source and the receiver, thus making it difficult to relate arrival time to velocity.
In practice, however, it is cumbersome to place and operate a physical source downhole.
Another difficulty with conventional check shots is that they measure only P-wave velocity from first arrivals.
Shear waves, even if emitted from the surface source or generated by P-S conversions in the overburden, arrive later, and are difficult to unravel and pick.
Hence a shear wave check shot is difficult, if not impossible, to obtain using conventional check shot techniques.

Method used


Image

  • Method of determining a seismic velocity profile
  • Method of determining a seismic velocity profile
  • Method of determining a seismic velocity profile

Examples


example 1

P-Wave Virtual Checkshot

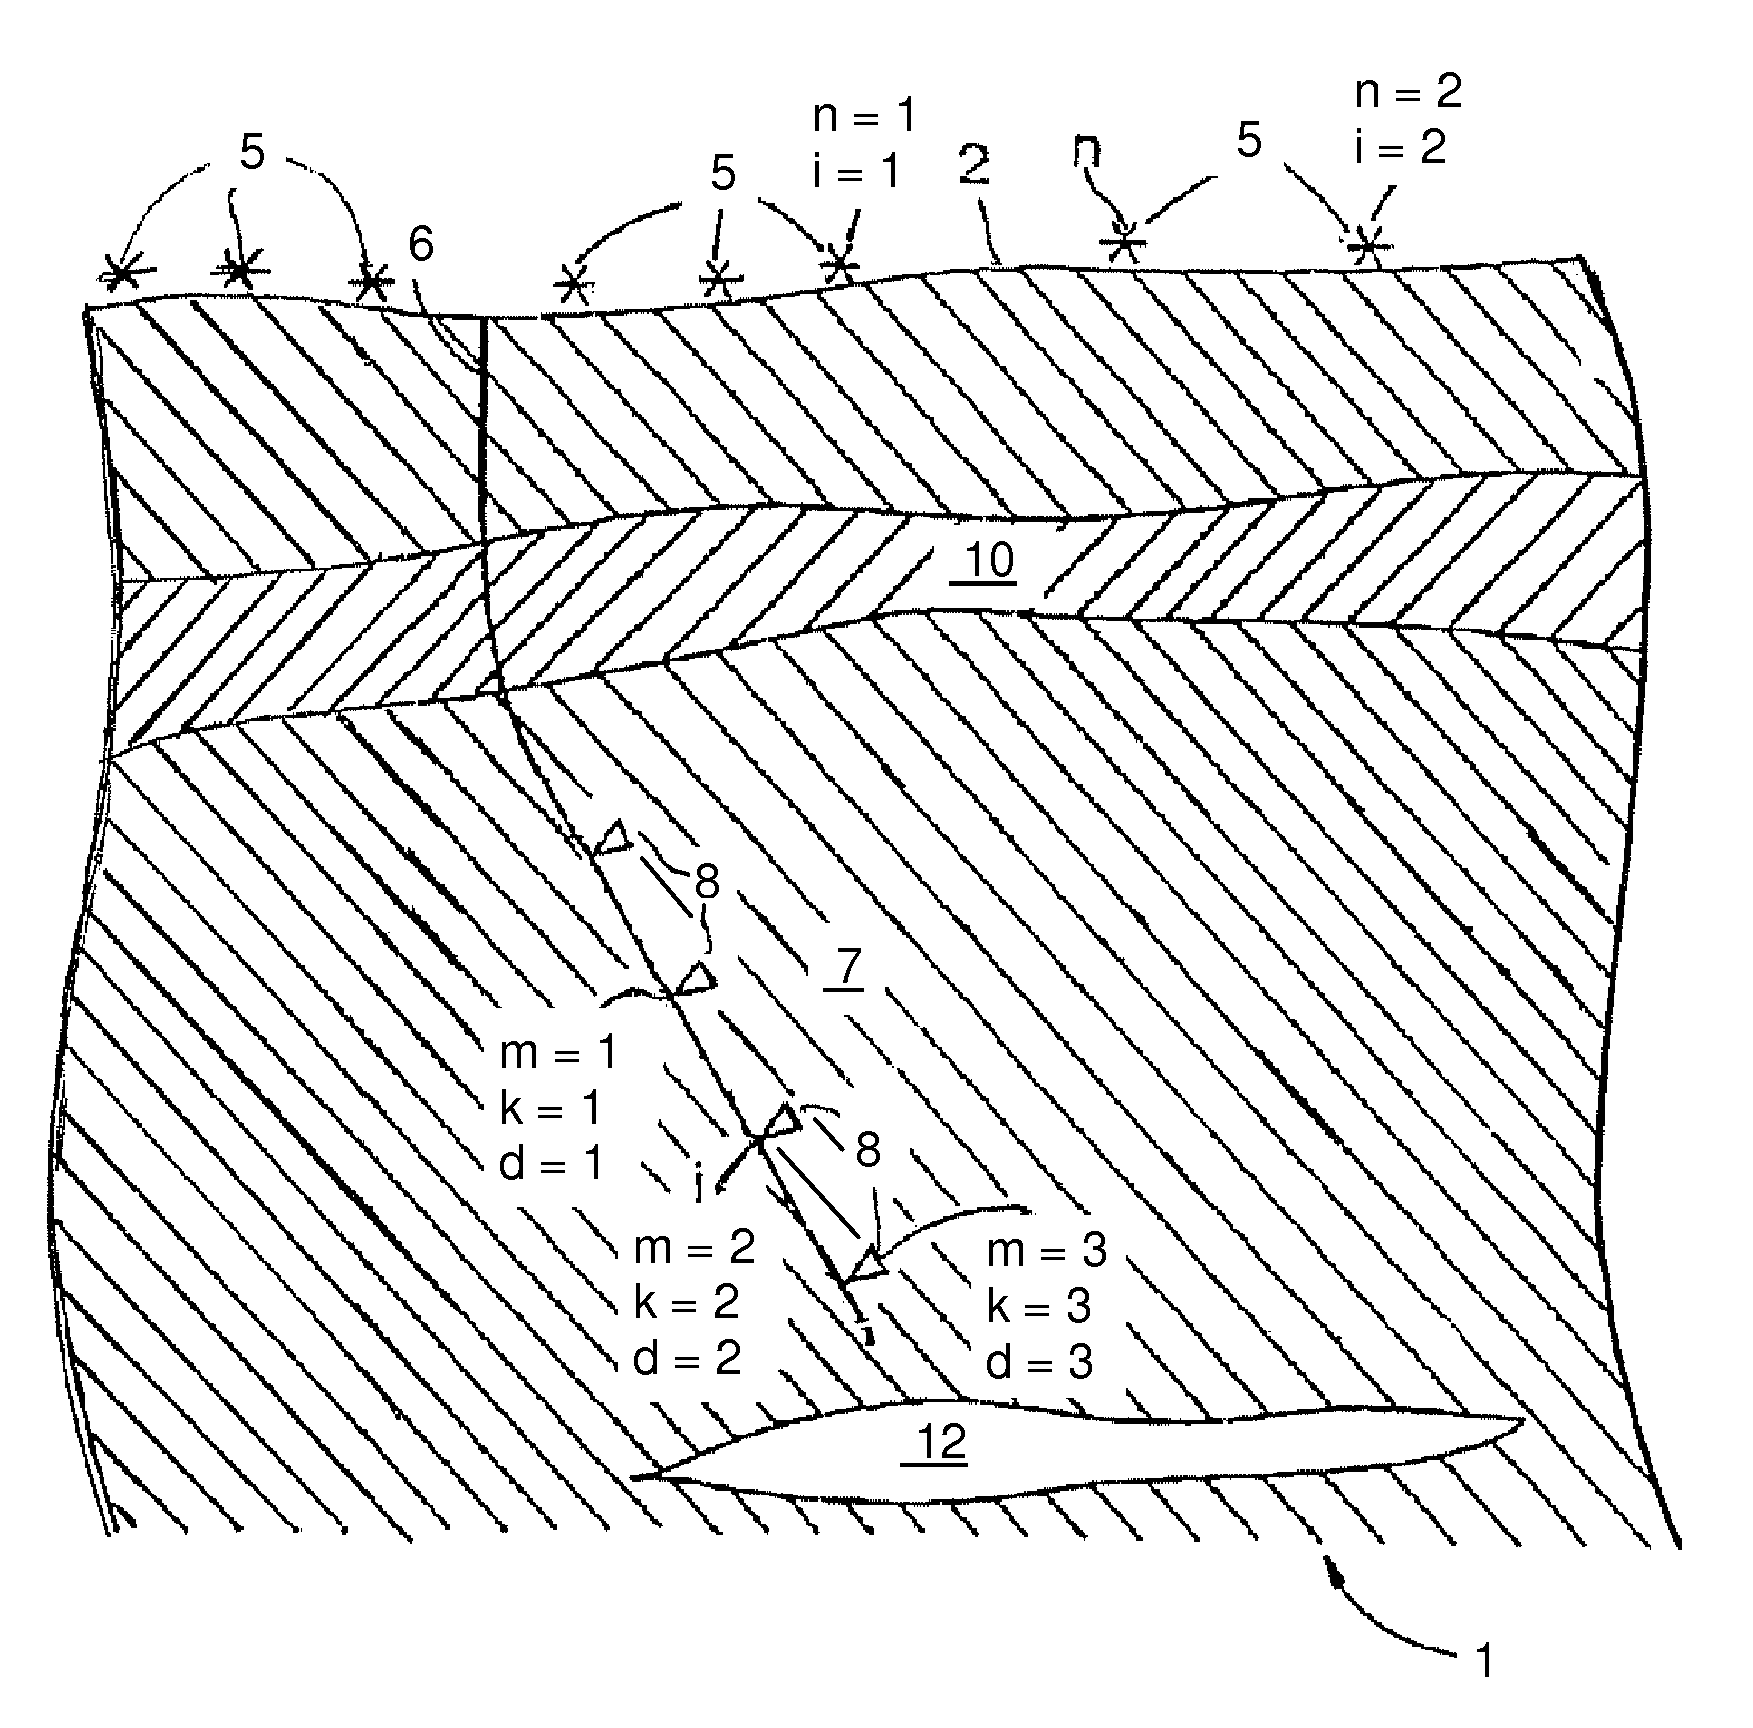
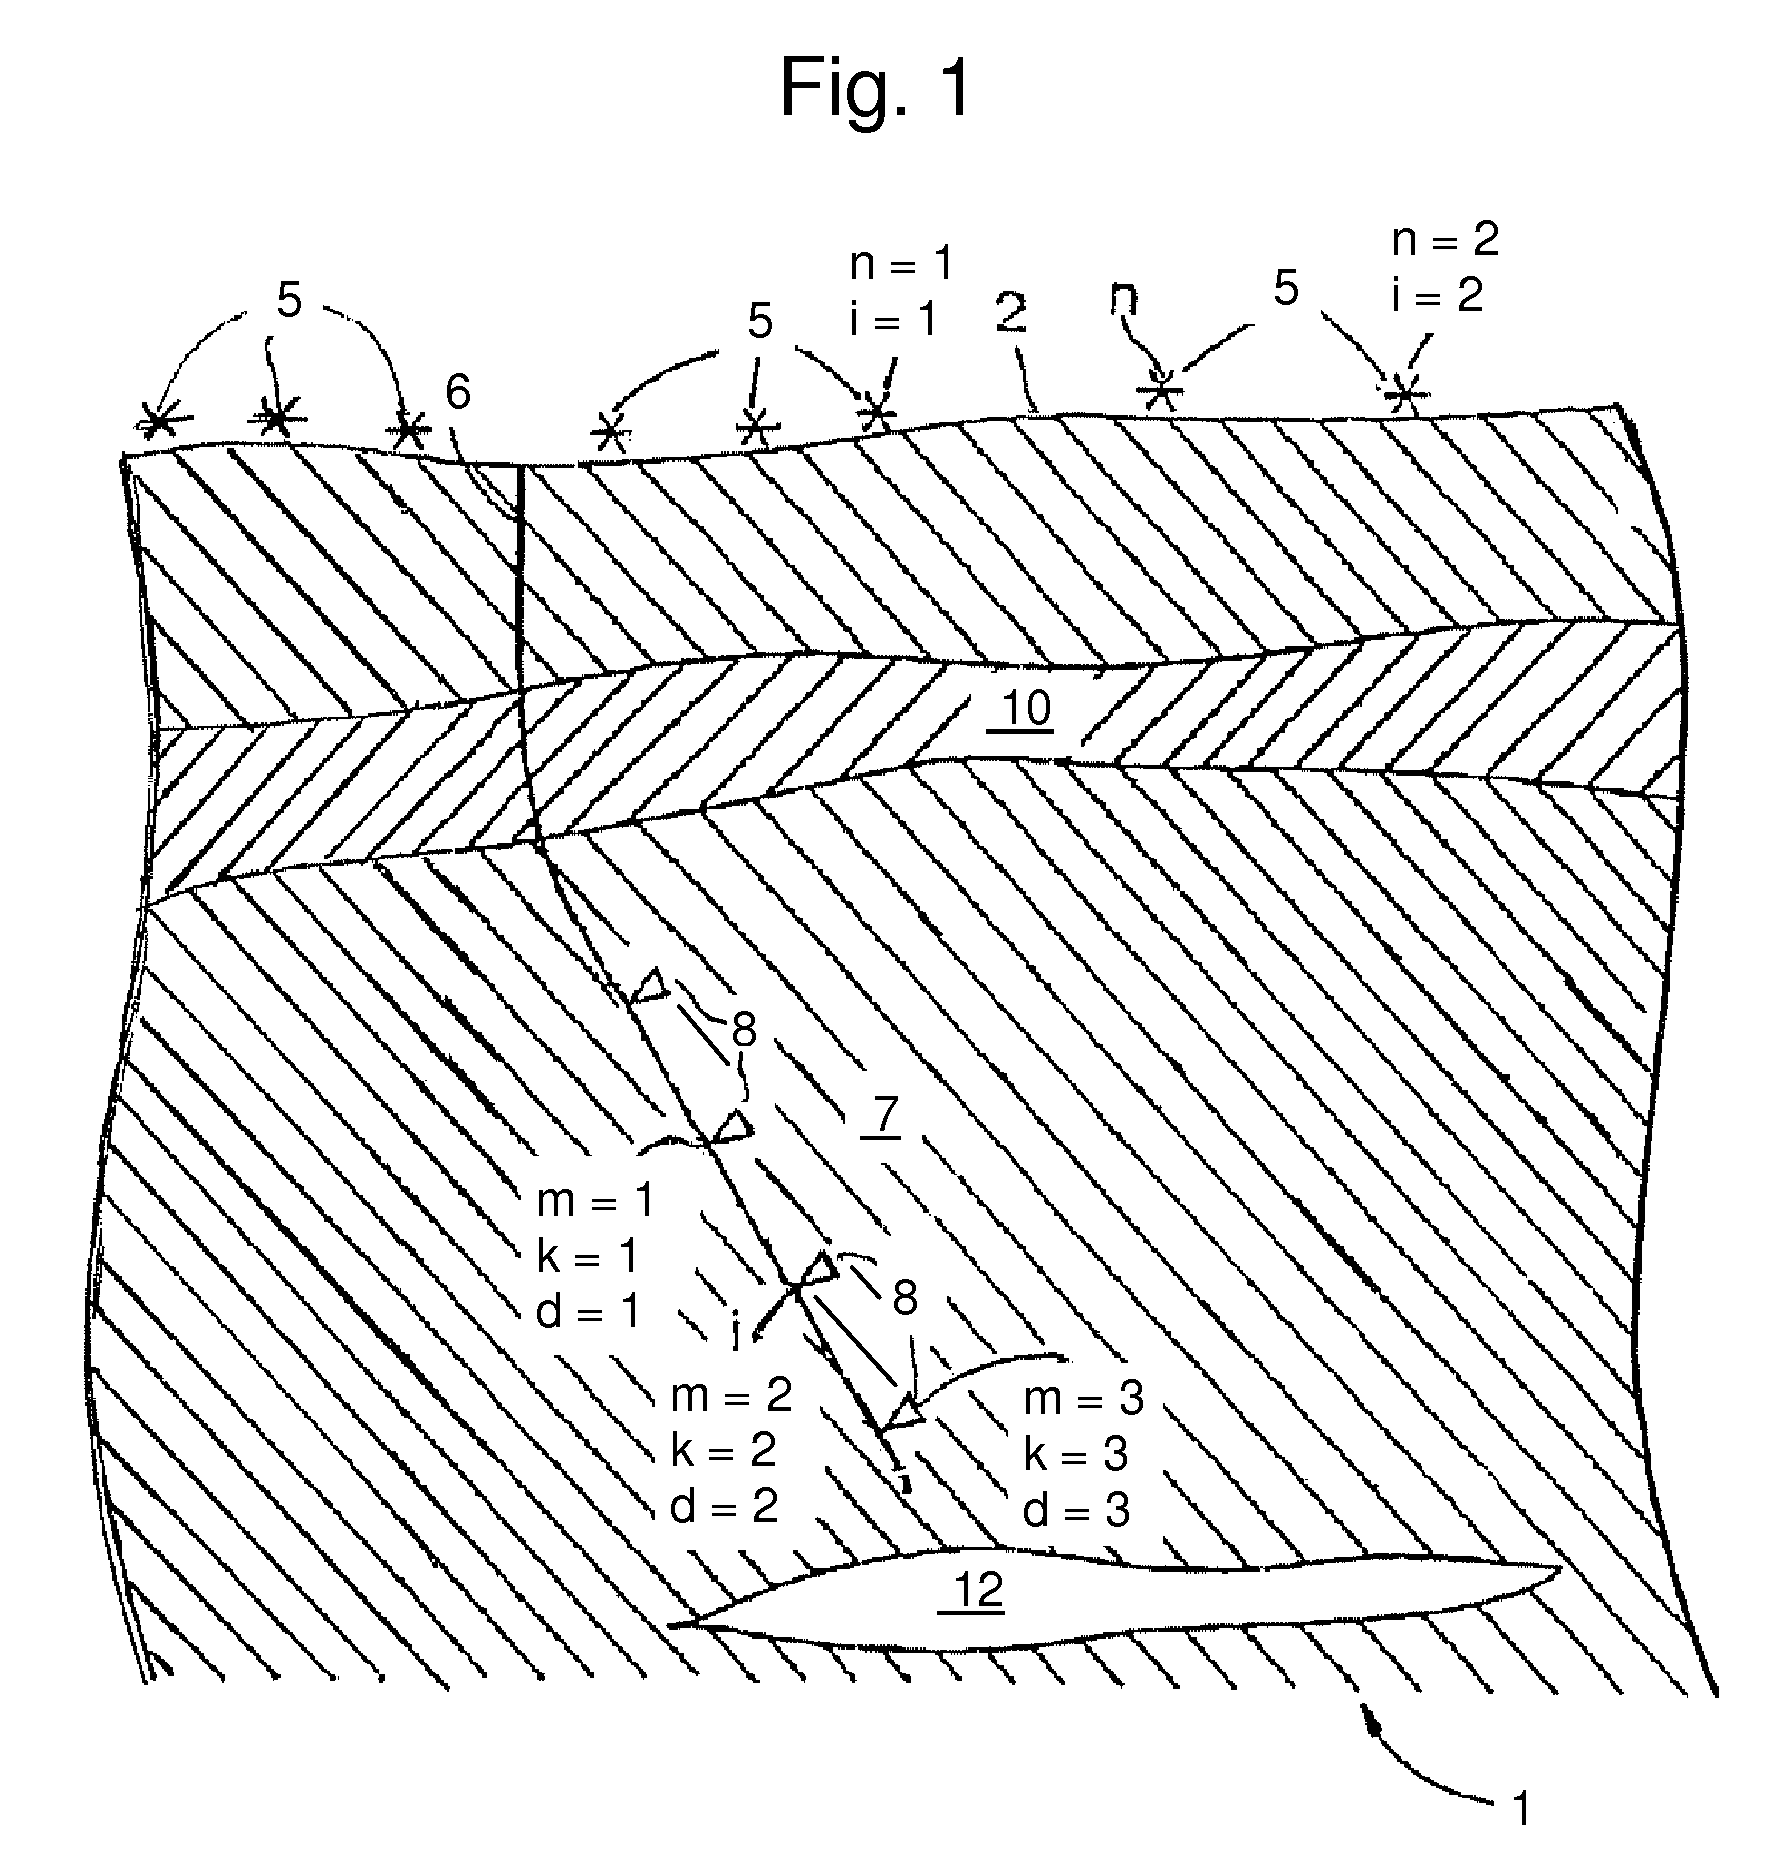
[0050]To create the P-wave virtual source, the present example uses as input the vertical (Z) component of the VSP data. A virtual source was created at every receiver depth. A common virtual shot gather with a P-wave virtual source (PVS) located at the top-most receiver location is shown in FIG. 3(a). FIG. 3(a) thus shows the virtual signal traces uvsmk(t) for m=1 and various k ranging from 2 to 96. The gaps at traces k=12-13 and k=60-61 are caused by dead receivers.

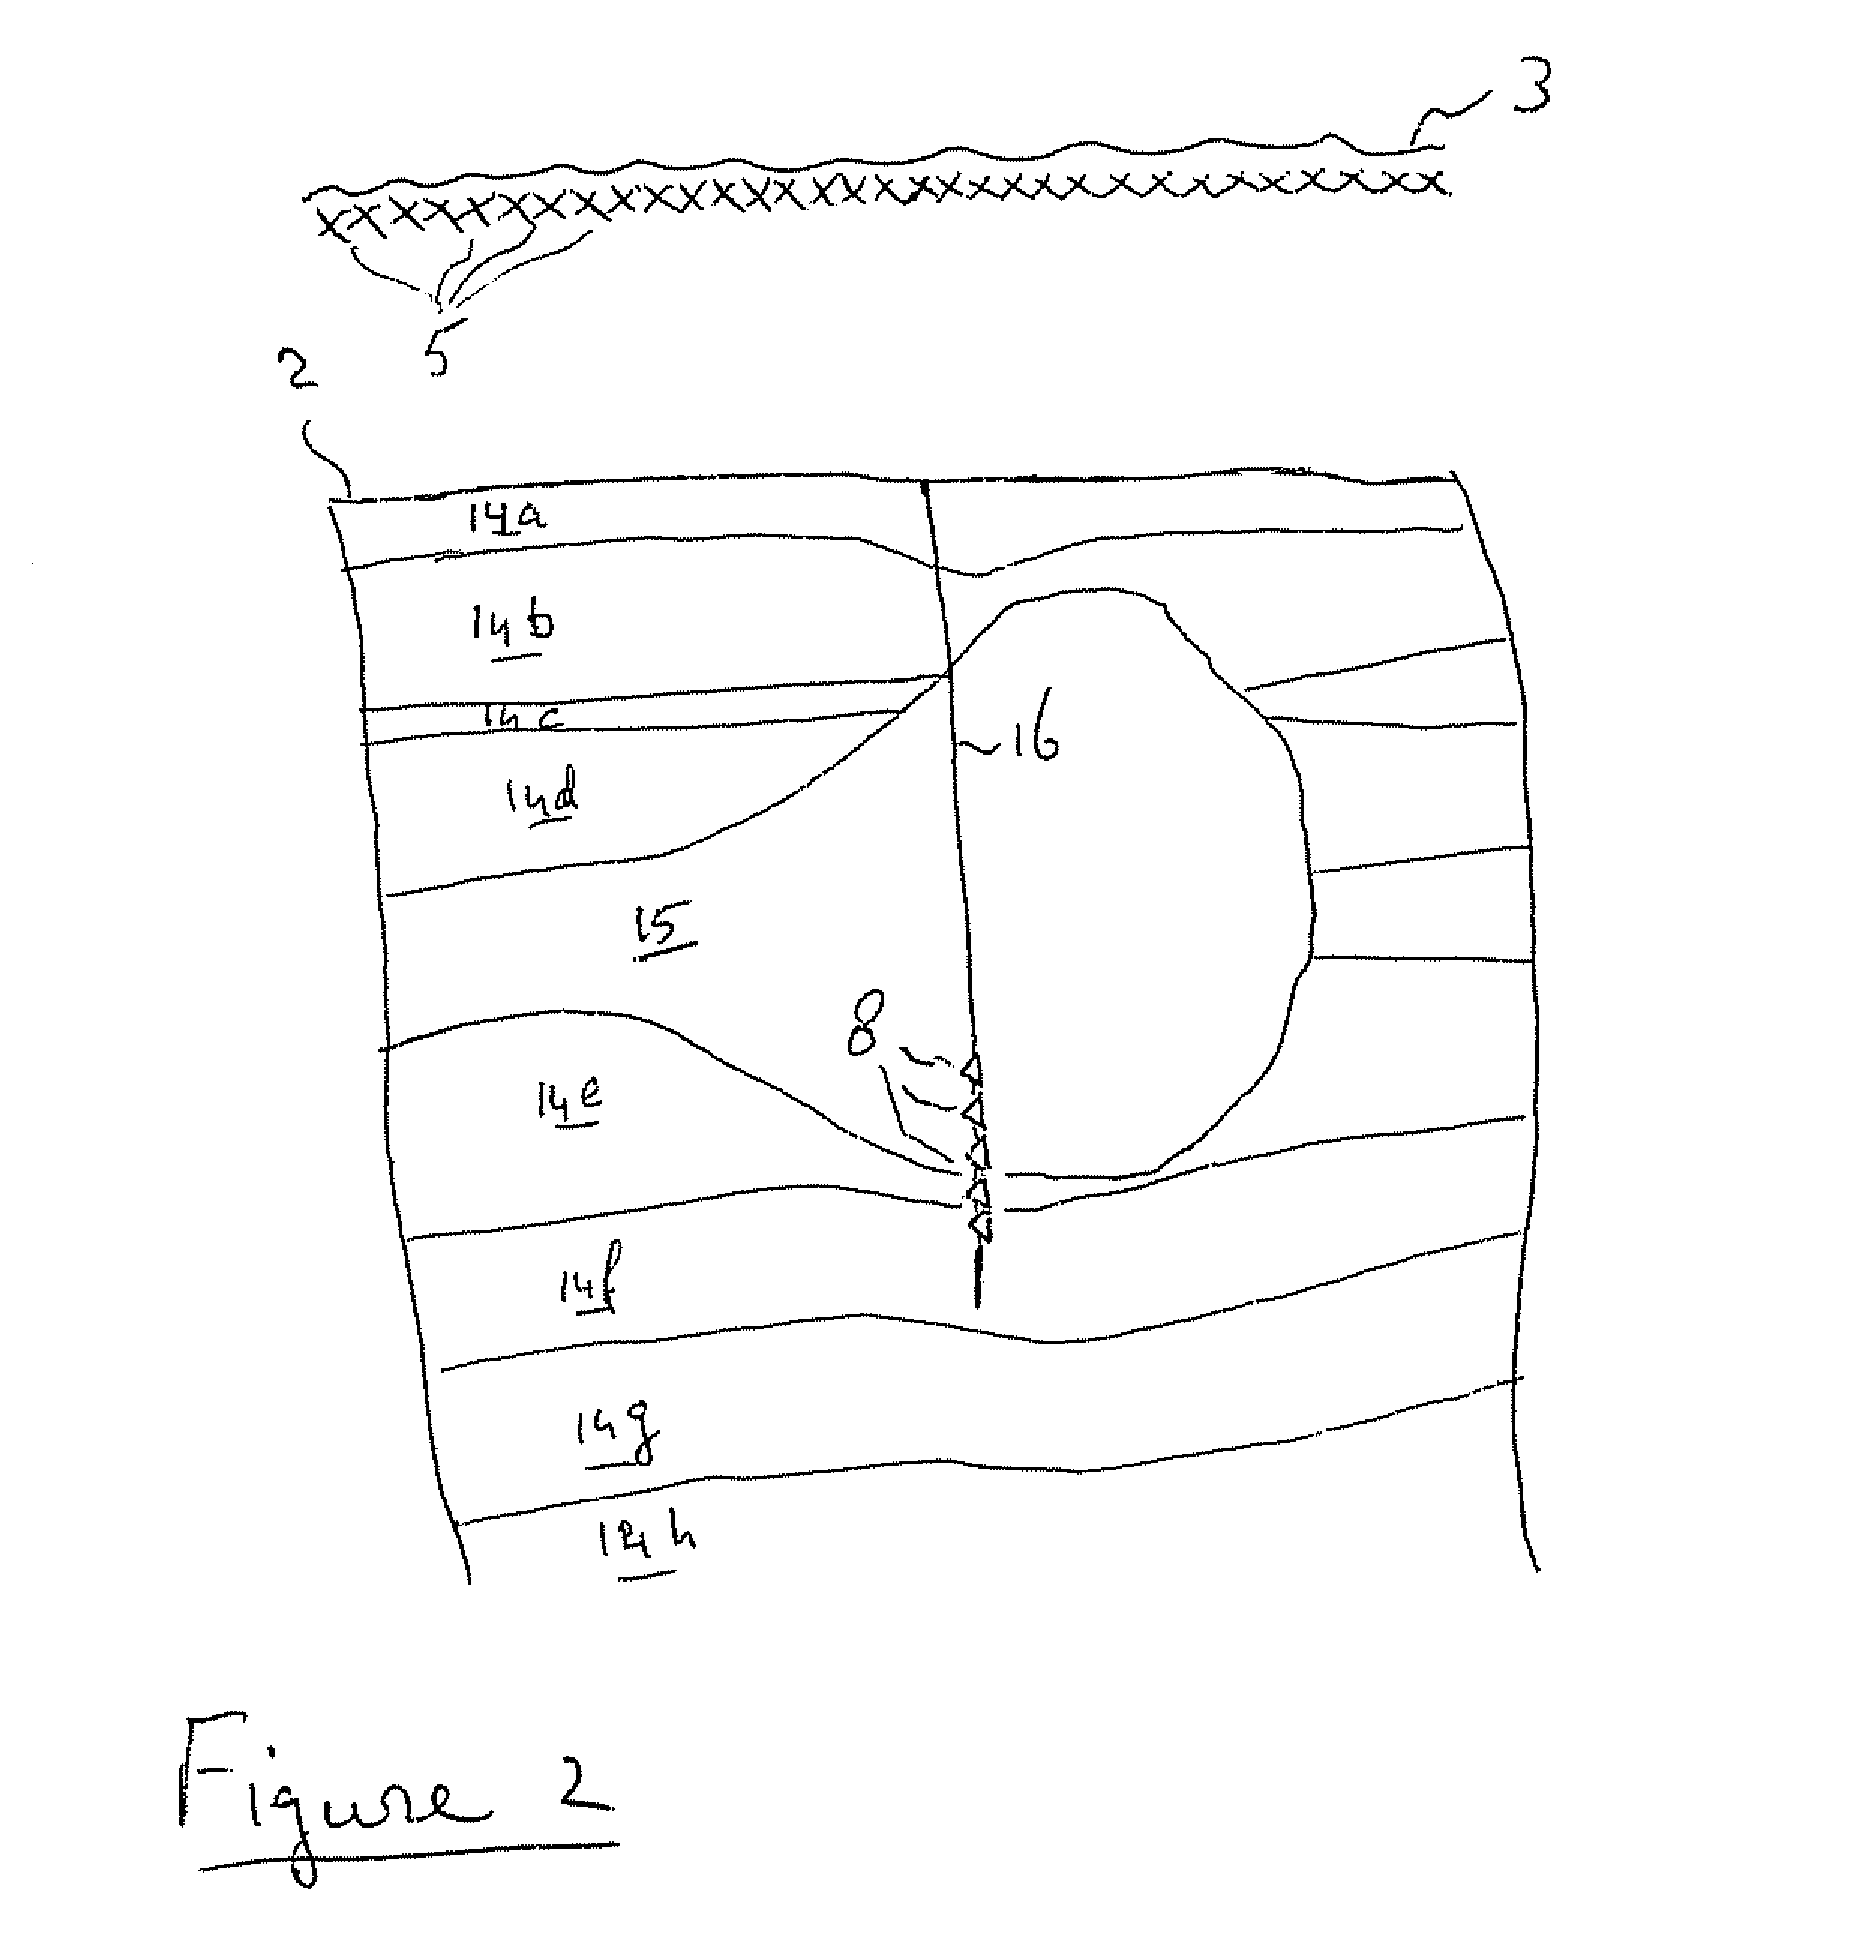
[0051]The virtual source “fires” a zero-phase impulse at time t=100 ms. The first arrival on the virtual signal traces is clear and easy to pick. Only picks on receivers from the same tool setting [30 m (exactly 100 ft) apart] were used for interval velocity estimation. A linear fit to the first arrival moveout provides the following P-wave velocity estimate in the region of interest: Vp≈2.82 km / s (9400 ft / s). The region of interest in the example is below the salt body 15.

[0052]FIG. 4 plots P-wa...

example 2

S-Wave Virtual Checkshot

[0054]The present example VSP data set was acquired with airguns in the water—they do not directly excite shear waves. Nevertheless, a shear virtual source can be created by harvesting P-S conversions that may occur at heterogeneities above the seismic receivers. Further details may be found in a paper presented by A. Bakulin and R. Calvert at the 2005 Annual International Meeting of the Society of Exploration Geophysicists in Houston, entitled “Virtual shear source: a new method for shear-wave seismic surveys”, and published in Expanded Abstracts pages 2633-2636, herein incorporated by reference in its entirety. The strongest P-S conversion is thought to occur at the top of salt. We verified this by ray-tracing.

[0055]There is, however, no need to know where in the overburden the conversions occurred. They may occur at many places at once and be very complicated. The present VS method collapses them all to a useful virtual shear signal radiated from the shear...

example 3

Velocity Estimation in a Salt Body

[0058]Since virtual check shots measure interval velocities, our primary focus was on the sediments below the salt rather than on the relatively homogeneous salt. But for the sake of completeness, it is remarked that the virtual check shots may also be used to measure the average P- and S-wave velocities in salt. In the present example, the average velocities were estimated, as opposed to a detailed velocity profile in salt, mainly because it is a common practice to assign a single velocity value to salt bodies for seismic processing. Also, since the salt is much faster than sediments, interval velocities (average over 30 m) would have much larger uncertainties than interval velocities below salt.

[0059]A linear regression through the virtual source first arrivals in salt gave Vp=4.398±0.099 km / s (14660±330 ft / s) and Vs=2.52±0.11 km / s (8390±350 ft / s), corresponding to Vp / Vs=1.75±0.08. Smoothed logs over the same depth interval of 480 m (1600 ft) gave...


PUM


Abstract

A seismic velocity profile in a region of interest in a subsurface formation is determined using at least the following steps.(a) Activating a seismic source at a location n, thereby exciting a wave in the subsurface formation.(b) Recording a wave signal trace unm(t) against time t, at a seismic receiver m.(c) Recording a wave signal trace unk(t) against time t at a seismic receiver k.(d) Cross correlating the wave signal traces unm(t) and unk(t) to obtain uconvnmnk(t).(e) Repeating these steps, for different locations n;(f) Summing uconvnmnk(t) over all locations n, to obtain a signal trace uvsmk(t) which corresponds to the signal received by the seismic receiver k from the virtual source at the position of seismic receiver m;(g) Deriving the seismic velocity based on the time of first arrival of the wave in uvsmk(t) and the predetermined distance between the seismic receiver m and the seismic receiver k.

Description

CROSS REFERENCE TO PRIOR APPLICATION[0001]The present application claims the benefit of U.S. Provisional Application No. 60 / 765,563, filed 6 Feb. 2006, and of U.S. Provisional Application No. 60 / 866,950, filed 22 Nov. 2006.FIELD OF THE INVENTION[0002]In one aspect, the present invention relates to a method of determining a seismic velocity profile in a subsurface formation.BACKGROUND OF THE INVENTION[0003]A seismic velocity profile in a subsurface formation may be obtained employing the so-called check shot (also known as “well shoot” or “velocity survey”) technique. The check shot technique is described in, for instance, on pages 167 and 168 of “Well Logging in non-technical language,” by David Earl Johnson and Kathryne E. Pile, published 2002 by PennWell Books, ISBN 0878148256.[0004]A conventional check shot technique includes generating multiple shots from a seismic source located in a selected position, usually close to a wellhead. Shots are detected at different locations along...

Claims


Application Information

Patent Timeline
Patent Type & Authority Patents(United States)
IPC IPC(8): G01V1/00
CPCG01V1/303G01V1/42
Inventor BAKULIN, ANDREY VICTOROVICHCALVERT, RODNEY WILLIAMMATEEVA, ALBENA ALEXANDROVA
Owner SHELL USA INC
Learn More