
Method and system for generating display data

a display data and data technology, applied in the field of diagnosis and diagnosis of lesions, can solve the problems of difficult comparison analysis, subject to error, and difficult for the radiologist to evaluate the strength of the original magnetic resonance signal, and achieve the effect of facilitating accurate diagnosis and diagnosis of malignant lesions

Active Publication Date: 2012-06-05
PHILIPS ELECTRONICS NORTH
View PDF11 Cites 0 Cited by
  • Summary
  • Abstract
  • Description
  • Claims
  • Application Information

AI Technical Summary

Benefits of technology

"The present invention provides methods for generating image display data that can help diagnose lesions in a body part more accurately, especially malignant ones. The methods also allow for the creation of three-dimensional displays from data collected from multiple parallel planes through the body part."

Problems solved by technology

However, the transformations from source signal to image intensity signal, which may vary from case to case, make this comparative analysis difficult and subject to error.
However, after the source data have been transformed to image intensities that have been adjusted to optimize medical diagnosis, where this optimization differs from case to case, it is difficult for the radiologist to evaluate the strength of the original magnetic resonance signal on the basis of the images that are presented.

Method used


Image

  • Method and system for generating display data
  • Method and system for generating display data
  • Method and system for generating display data

Examples


Embodiment Construction

[0036]One exemplary procedure according to a first aspect of the invention will now be described.

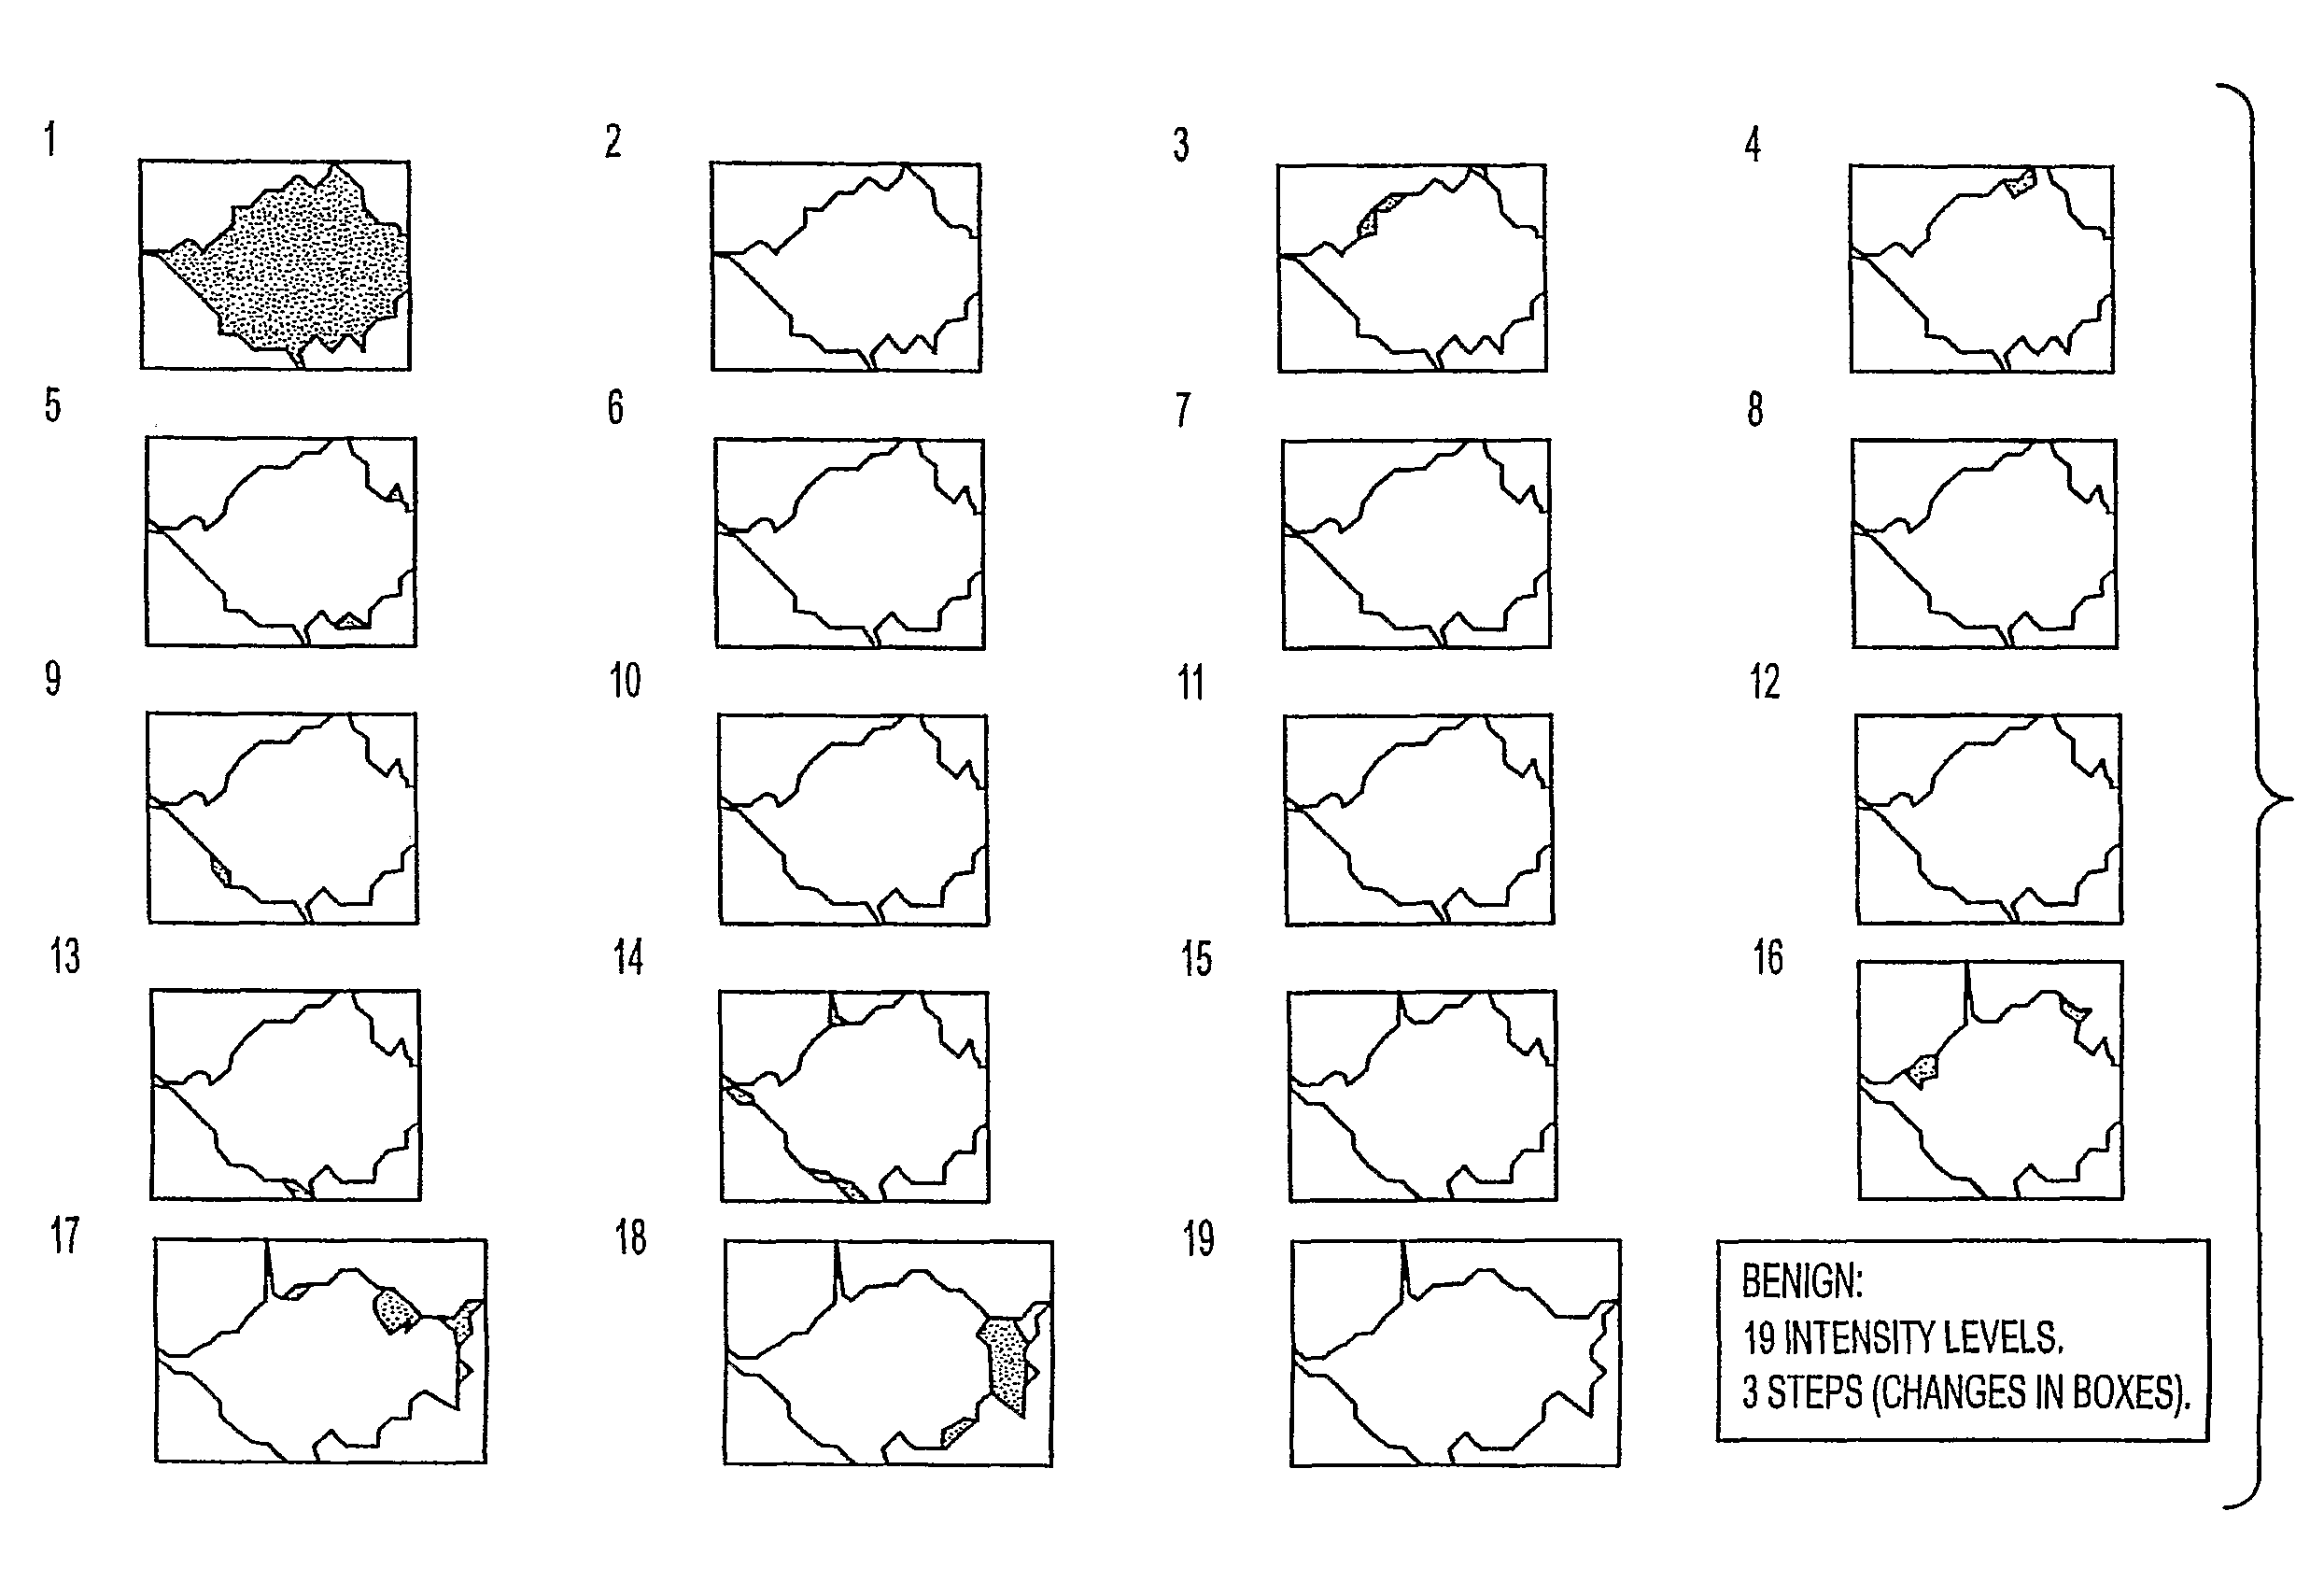
[0037]In a first step, a first data set composed of raw data is obtained, as from signals generated by a system used to aid medical diagnosis, such as MRI systems, for example in the manner described above with reference to the above-cited applications. By this procedure, there is obtained a first data set composed of a matrix of data values, each value representing the intensity of a pixel in an MRI image of a selected planar region of the body part. According to the present invention, such information is obtained for a plurality of mutually parallel planar regions through the body part.

[0038]Then, in a second step, the first data sets are converted into second data sets containing, for each pixel in each of the first data sets, data, for example RGB data, representing a particular color and data representing a selected opacity level (α). The color is selected on the basis of the intens...


PUM


Abstract

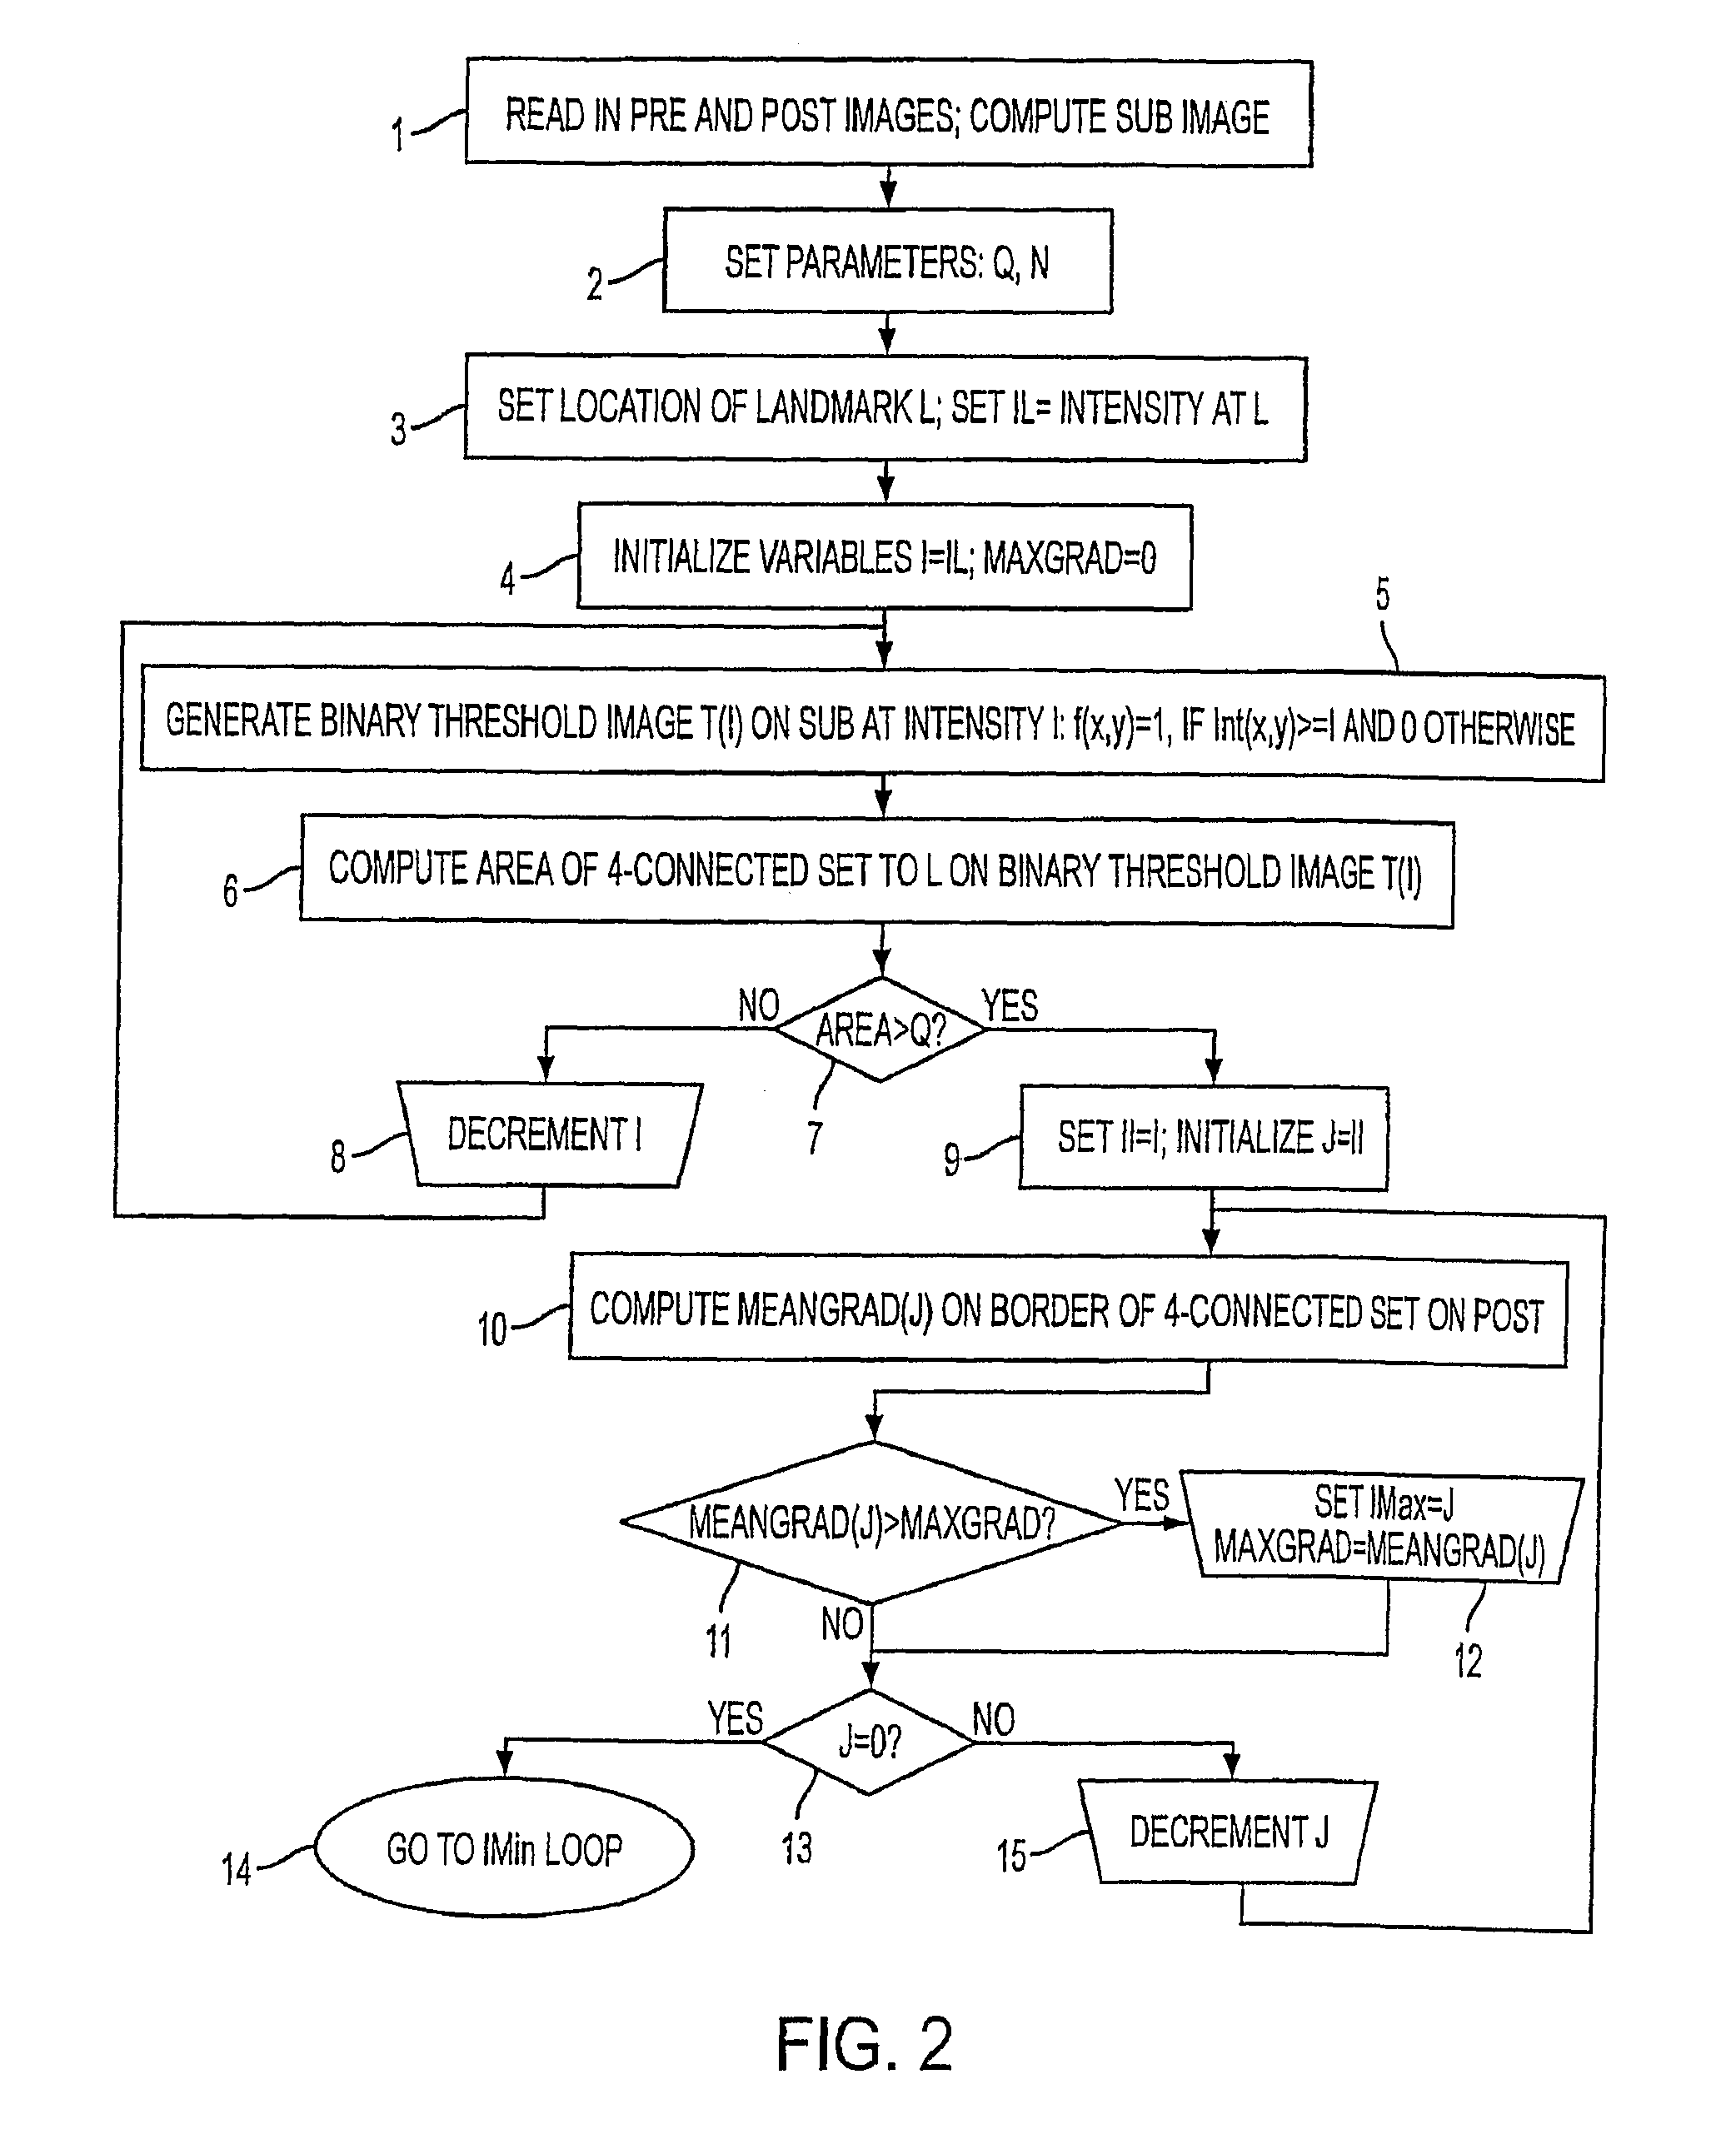
A method of aiding in the evaluation of lesions in a body using a plurality of sets of image data of sections of the body region in mutually parallel planes. Processing of the data requires several steps, including pixel intensity pattern recognition, ˜ contouring of the regions of probable pathology, thresholding and 3-dimensional clustering, providing each pixel with a color representative of a selected opacity level and displaying an image of the region of interest where areas of probable pathological conditions are highlighted.

Description

[0001]This work was supported in part by at least one grant R44CA85101 issued by the National Cancer Institute (NCI). The government may have certain rights in this invention.TECHNICAL FIELD[0002]The present invention relates to the detection and diagnosis of lesions. The invention relates more particularly to the generation of display data for aiding the diagnosis and detection of lesions in a body part. The starting point of the invention is technology disclosed in Provisional Application 60 / 647,756, filed on Jan. 31, 2005, and in international PCT application PCT / US05 / 15326, filed on May 3, 2005. The entirety of the disclosures of these applications are incorporated herein by reference.BACKGROUND ART[0003]In many prior systems for aiding such diagnoses, data are represented in three dimensions where two of the dimensions (x,y) represent spatial location on a grid of fixed size and the third dimension (w) is a representation of original source data. As an example, in magnetic reso...

Claims


Application Information

Patent Timeline
Patent Type & Authority Patents(United States)
IPC IPC(8): G06K9/00A61B5/00
CPCA61B5/055A61B5/7435A61B6/463A61B6/465A61B6/466A61B6/5223G06T7/0012G06T2207/30004
Inventor PENN, ALANTHOMPSON, SCOTT F.
Owner PHILIPS ELECTRONICS NORTH
Learn More