[0022]The concept behind the disclosed embodiments is the use of transmission grating to enable insertion of the grating in the optical path of the tester in registration with, and without disrupting, the image of the emission itself. By proper choice of a transmission grating, e.g., a proper transmission blazed grating, the emission can be imaged without the grating and thereafter the grating can be inserted in the optical path without disrupting the view of the emission and while preserving the registration of the emission spot. This is achieved, in part, by choosing the transmission grating such that the zero order is the integrated emission and the first order is a diffraction of the emission spot. When choosing appropriate blazed grating, it is optimized to achieve maximum efficiency at the first diffraction order and minimize power at the higher orders. The blazed grating is made of material that is transparent at 800-2500 nm wavelengths and the blaze angle of the blazed grating is configured to have maximum power at first order for wavelength or between 800 nm and 2500 nm, although depending on the sensor used, the blazed grating is configured to have maximum power at first order for wavelength or between 800 nm and 1600 nm instead.
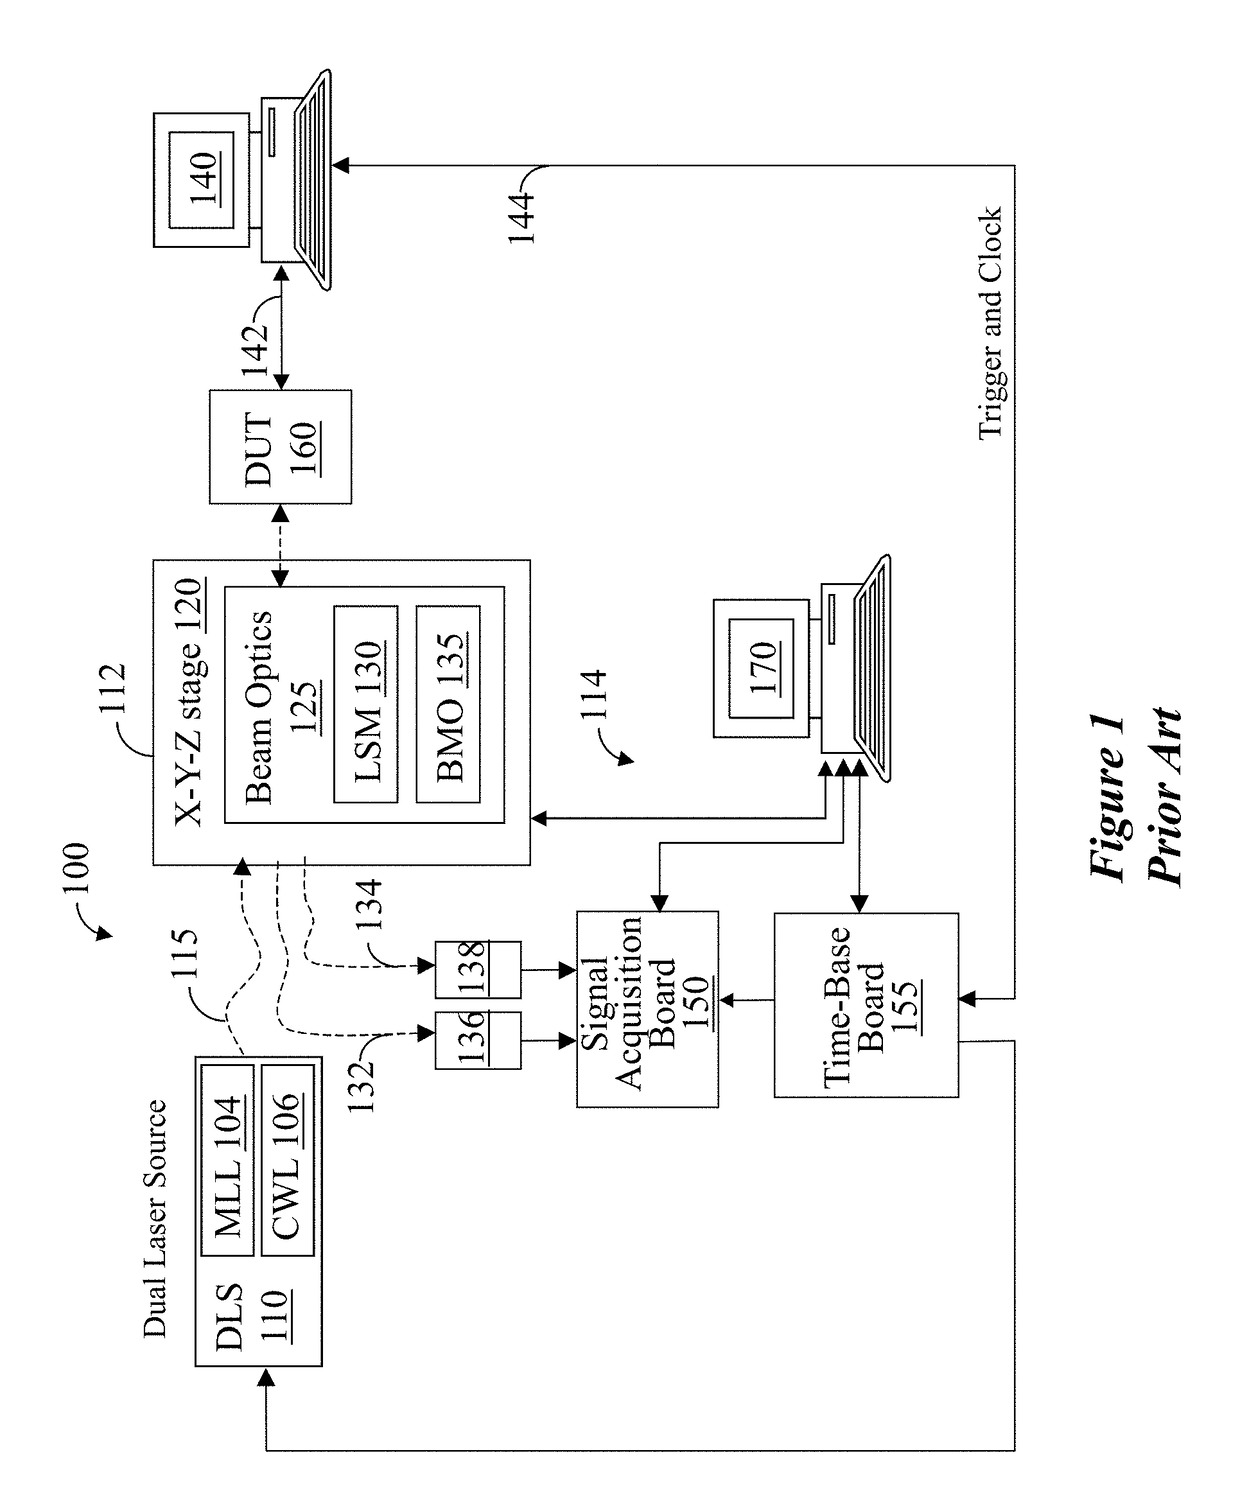
[0024]In essence, while in standard emission systems the collected light appears circular, inserting a diffraction element in the light collection path causes the spectra of the emission to be imaged and appear generally in a linear form, according to the amount of diffraction. Using the transmissive diffraction grating, a zero order is projected in registration with the image of the emission spot, and the first order is projected to the side of the emission spot. Thus, the user can identify the spot from which the first order diffraction corresponds to. Using these images, the user can analyze the image of the first order diffraction and determining whether the spot of the zero order diffraction is faulty. When using rotatable transmissive grating, the orientation of the spectra may appear different, i.e., the axis of the spectra oriented at different angle, depending on the rotation of the diffraction element. Additionally, the shape of the spectra itself may look different, e.g., as a linear streak, as a “comet tail,” as a “teardrop,” etc., depending on the type of fault. All these phenomena can help in identifying, localizing and classifying faulty devices. Also, when the emission appears as a streak, the distribution of frequencies along the axis of the streak can help identifying, localizing and classifying faulty devices.
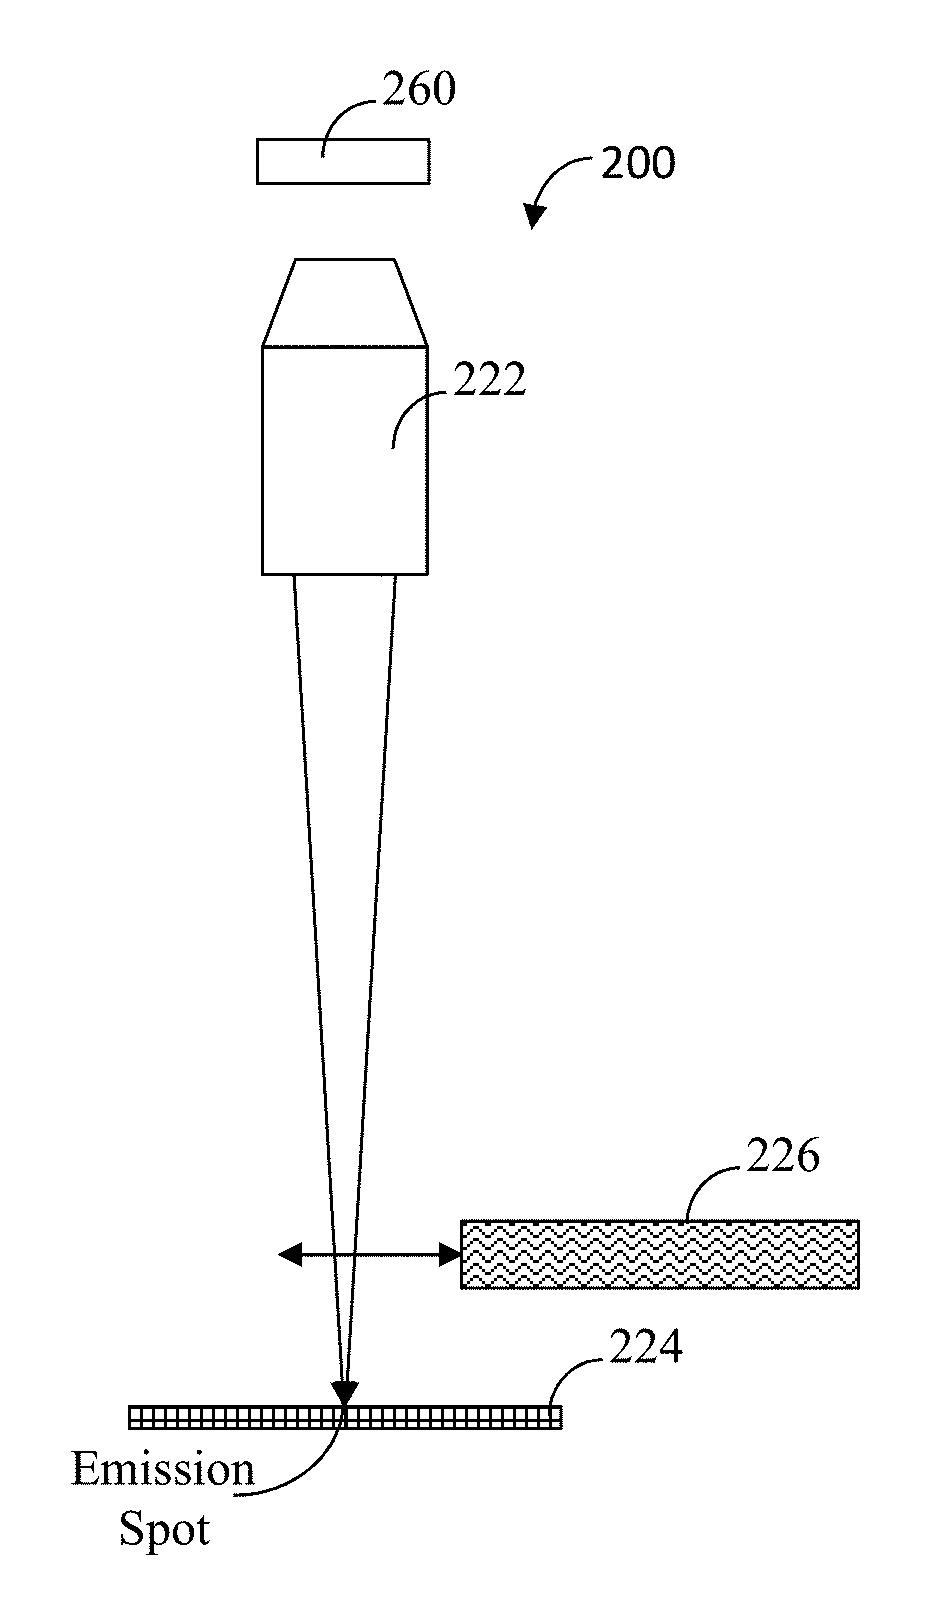
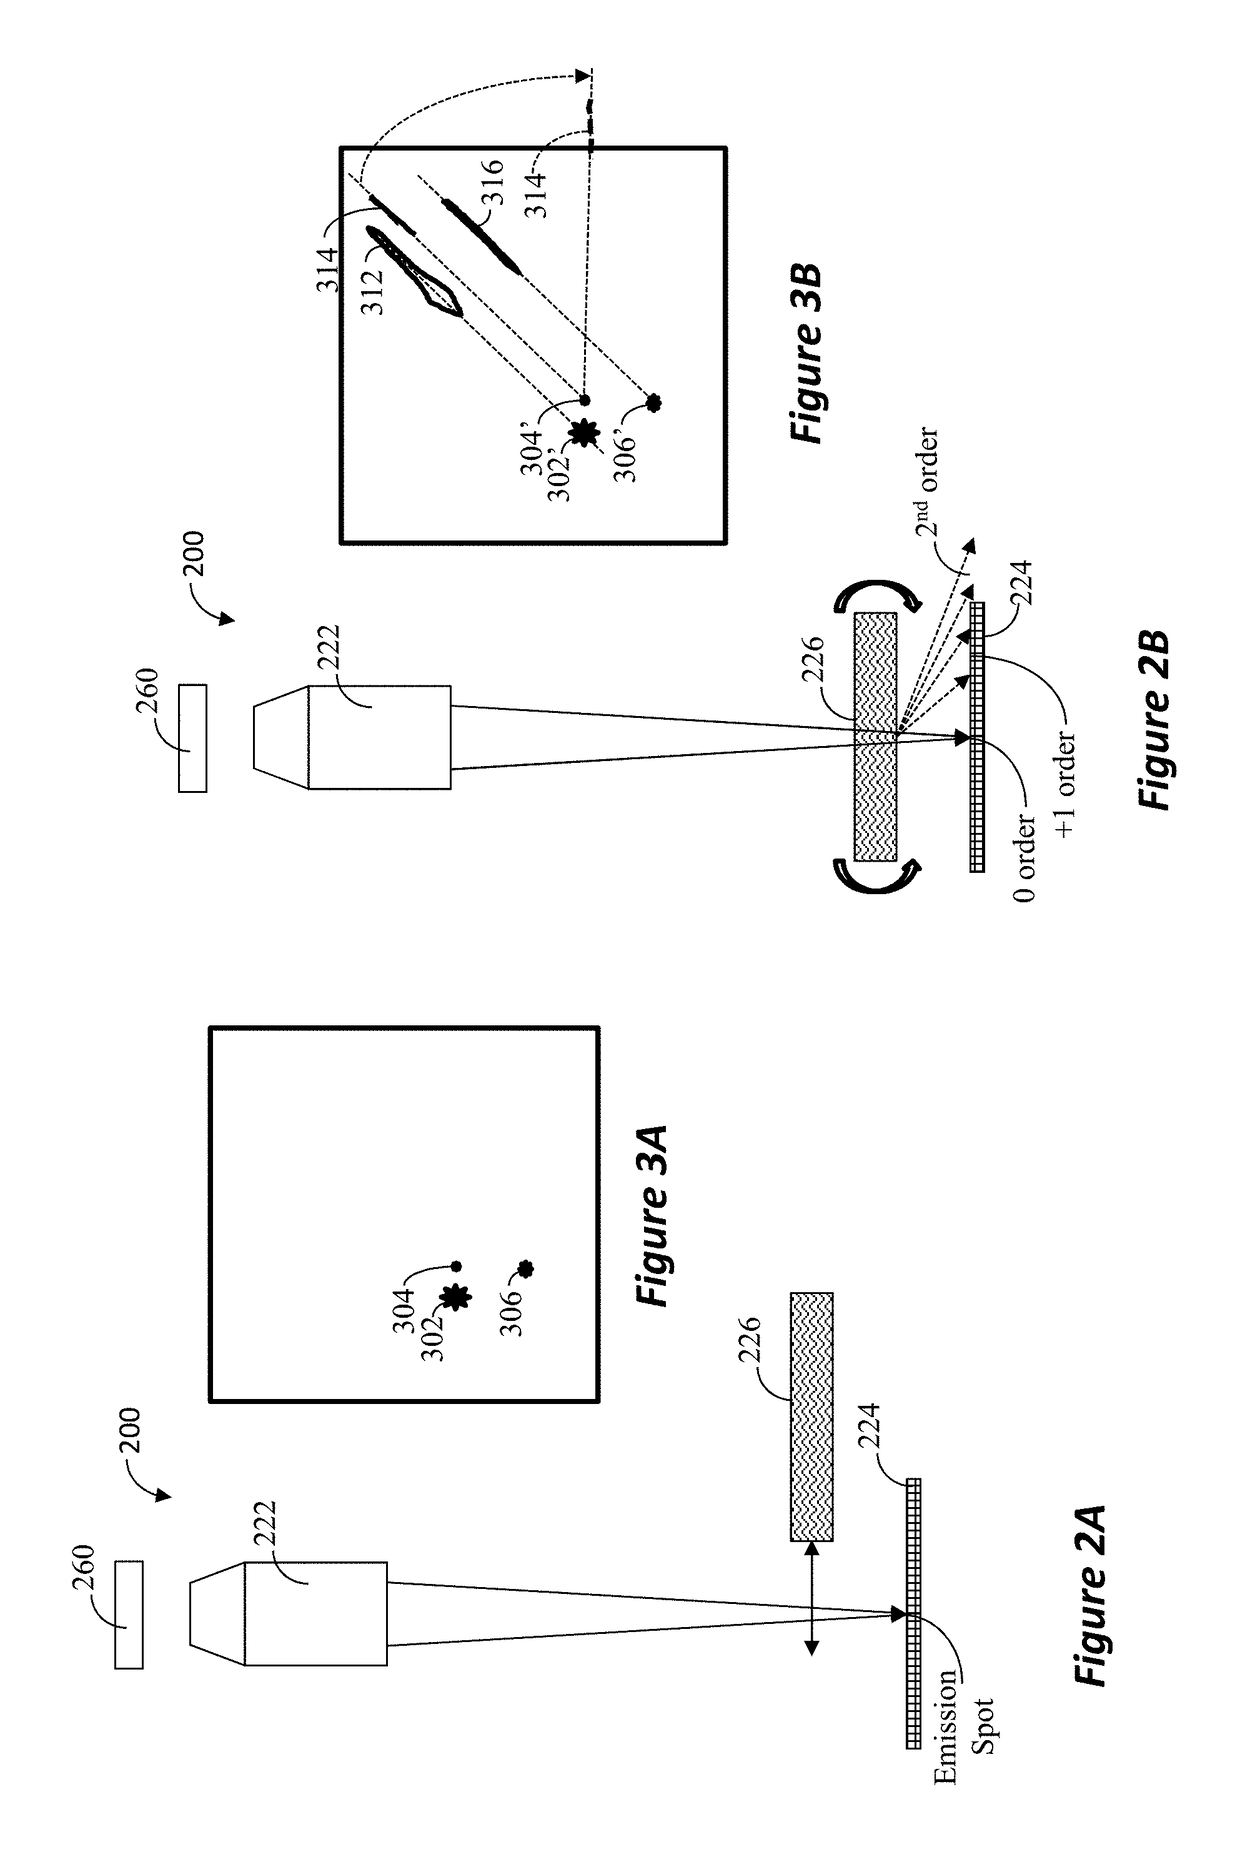
[0025]An apparatus and method for probing of a DUT is disclosed. The system enables optical probing and / or imaging and mapping of defective devices within the DUT. A selected area of the DUT is probed while the DUT is receiving either static or dynamic test signals, which would cause certain devices to emit light. The concept works for static emission as well as for dynamic emission, i.e., the active devices do not necessarily need to be switching to emit light. Light emitted or reflected from the DUT is collected and is converted into an electrical signal by a photosensor. The output of the photosensor is sampled and analyzed. Using techniques disclosed herein, a transmissive grating is then inserted in the optical path, such that the zero order diffraction is projected onto the sensor in registration with the original emission image. The first order is configured to be projected onto the sensor as a streak next to the zero order. The transmissive grating is also configured such that orders higher than the first order are projected outside the field of view of the sensor, such that they are not captured by the sensor. An image is then captured of the zero and first order, such that there is one-to-one correspondence between the zero and first order projection, making it easy to identify which first order diffraction corresponds to which emission point. This may be repeated for different rotational orientation of the grating that is placed in the optical path. Alternatively, data collection and analysis is performed when the best rotational orientation of the grating is achieved. In the analysis, the spectral response may be compared among different rotational orientation of the grating.

