Method and apparatus for seismic signal processing and exploration

a seismic signal and processing method technology, applied in the field of seismic exploration, can solve the problems of complex software, large computer resources and complex processing, and difficult to detect changes in stratigraphy on traditional seismic displays, and achieve the effect of quick visualization

Inactive Publication Date: 2003-08-19
CORE LAB GLOBAL
View PDF84 Cites 71 Cited by
  • Summary
  • Abstract
  • Description
  • Claims
  • Application Information

AI Technical Summary

Benefits of technology

Coupled with coherency, data cubes of the solid angle dip of coherent seismic reflection events allow one to quickly see structural as well as stratigraphic relationships (such as onlap and offlap) between the seismic data and interpreted sequence boundaries.

Problems solved by technology

Processing requires extensive computer resources and complex software to enhance the signal received from the subsurface and to mute accompanying noise which masks the signal.
However, changes in stratigraphy are often difficult to detect on traditional seismic displays due to the limited amount of information that stratigraphic features present in a cross-section view.
While working with both time slices and cross-sections provides an opportunity to see a much larger portion of faults, it is difficult to identify fault surfaces within a 3D volume where no fault reflections have been recorded.
Although the process invented by Bahorich and Farmer has been very successful, it has some limitations.
Shortening the window (e.g., to 32 ms results in higher vertical resolution, but often at the expense of increased artifacts due to the seismic wavelet.
Unfortunately, a more rigorous, non-zero mean running window cross correlation process is an order of magnitude more computationally expensive.
Moreover, if seismic data is contaminated by coherent noise, estimates of apparent dip using only two traces will be relatively noisy.

Method used


Image

  • Method and apparatus for seismic signal processing and exploration
  • Method and apparatus for seismic signal processing and exploration
  • Method and apparatus for seismic signal processing and exploration

Examples


examples

FIGS. 11A through 11C are displays of the 3D seismic attributes (.phi., c, d) corresponding to FIGS. 10A through 10C using the semblance based coherency algorithm expressed by equation (6), and the color display technique depicted in FIGS. 8 and 9. The input data were temporarily sampled at 4 ms, have an in-line trace spacing of .DELTA.x=12.5 m, and have a cross-line trace spacing of .DELTA.y=25 m, with the in-line acquisition oriented along a N-S axis. For FIGS. 11A through 11C, a circular analysis window or cell of a=b=60 m was used (See FIG. 4A), so as to include a total of 11 traces in the calculation. The maximum search dip (See FIG. 7C) was d.sub.max =0.25 ms / m, giving rise to 61 search angles. The temporal integration time used was w=16 ms, or K=4, thereby averaging the semblance calculation over 9 samples.

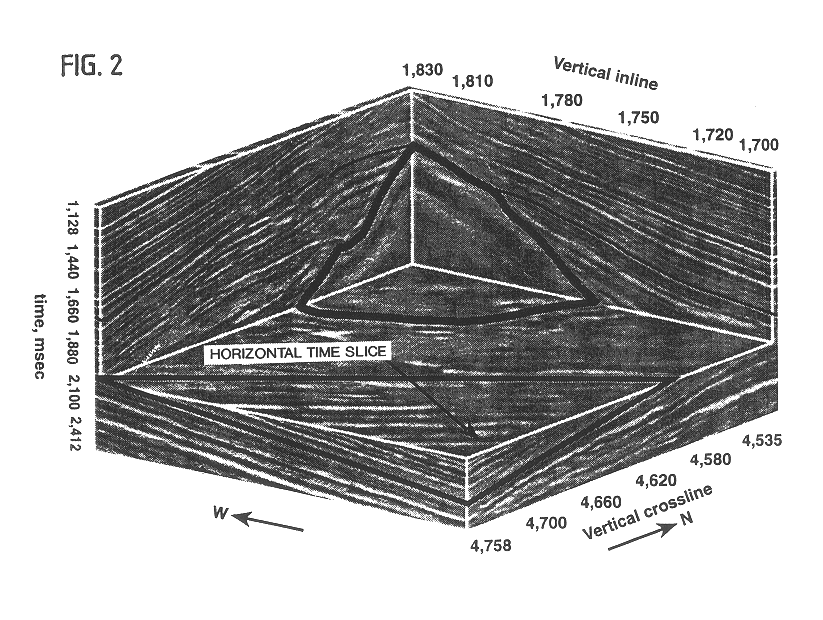
In FIGS. 10A and 10B lines AA' and BB' were chosen as S to N and W to E vertical slices through the center of a salt dome. Line CC" is an offset S to N line and illustrates...


PUM


Abstract

A method, a map and an article of manufacture for the exploration of hydrocarbons. In one embodiment of the invention, the method comprises the steps of: accessing 3D seismic data; dividing the data into an array of relatively small three-dimensional cells; determining in each cell the semblance/similarity, the dip and dip azimuth of the seismic traces contained therein; and displaying dip, dip azimuth and the semblance/similarity of each cell in the form a two-dimensional map. In one embodiment, semblance/similarity is a function of time, the number of seismic traces within the cell, and the apparent dip and apparent dip azimuth of the traces within the cell; the semblance/similarity of a cell is determined by making a plurality of measurements of the semblance/similarity of the traces within the cell and selecting the largest of the measurements. In addition, the apparent dip and apparent dip azimuth, corresponding to the largest measurement of semblance/similarity in the cell, are deemed to be estimates of the true dip and true dip azimuth of the traces therein. A color map, characterized by hue, saturation and lightness, is used to depict semblance/similarity, true dip azimuth and true dip of each cell; true dip azimuth is mapped onto the hue scale, true dip is mapped onto the saturation scale, and the largest measurement of semblance/similarity is mapped onto the lightness scale of the color map.

Description

TECHNICAL FIELDThis invention relates to the general subject of seismic exploration and, in particular, to methods and devices for identifying structural and stratigraphic features in three dimensions.BACKGROUND OF THE INVENTIONIn seismic exploration, seismic data is acquired along lines (see lines 10 and 11 of FIG. 1) that consist of geophone arrays onshore or hydrophone streamer traverses offshore. Geophones and hydrophones act as sensors to receive energy that is transmitted into the ground and reflected back to the surface from subsurface rock interfaces. Energy is often provided onshore by Vibroseis.RTM. vehicles which transmit pulses by shaking the ground at pre-determined intervals and frequencies on the surface. Offshore, airgun sources are usually often used. Subtle changes in the energy returned to surface often reflect variations in the stratigraphic, structural and fluid contents of the reservoirs.In performing three-dimensional (3D) seismic exploration, the principle is...

Claims


Application Information

Patent Timeline
Patent Type & Authority Patents(United States)
IPC IPC(8): G01V1/30G01V1/28
CPCG01V1/288G01V1/301G01V2210/65
Inventor MARFURT, KURT J.KIRLIN, R. LYNNFARMER, STEVEN L.BAHORICH, MICHAEL S.
Owner CORE LAB GLOBAL
Why Eureka
Try Eureka