Photoelectric detector amplitude versus frequency character test method for optical fiber peg-top

A photodetector, frequency characteristic testing technology, applied in optical instrument testing, single semiconductor device testing, machine/structural component testing, etc., can solve problems such as low efficiency, large noise impact, poor resolution, etc. , the effect of high measurement accuracy

Inactive Publication Date: 2008-02-20
ZHEJIANG UNIV
View PDF0 Cites 40 Cited by
  • Summary
  • Abstract
  • Description
  • Claims
  • Application Information

AI Technical Summary

Problems solved by technology

[0005] Originally, a commonly used method for testing the frequency characteristics of photodetectors used in optical communications is to use a step signal test method. This method is convenient for obtaining 3dB bandwidth indicators, but it cannot obtain detailed amplitude-frequency characteristics and phase-frequency characteristic curves, and the method The method is greatly affected by noise, the resolution is poor, and it is difficult to change the amplitude-frequency characteristics of 0.1dB or even smaller, and it is not suitable for accurate measurement of the frequency characteristics of the photodetector used in the fiber optic gyroscope; another method is to use an oscilloscope and a signal source to test method, but it also has the shortcomings of being unable to accurately quantify, affected by test noise, inconvenient testing, and low efficiency. It is also impossible to accurately measure the frequency characteristics of photodetectors used in fiber optic gyroscopes

Method used


Image

  • Photoelectric detector amplitude versus frequency character test method for optical fiber peg-top
  • Photoelectric detector amplitude versus frequency character test method for optical fiber peg-top
  • Photoelectric detector amplitude versus frequency character test method for optical fiber peg-top

Examples


Embodiment Construction

[0044] Below in conjunction with accompanying drawing and embodiment the present invention will be further described:

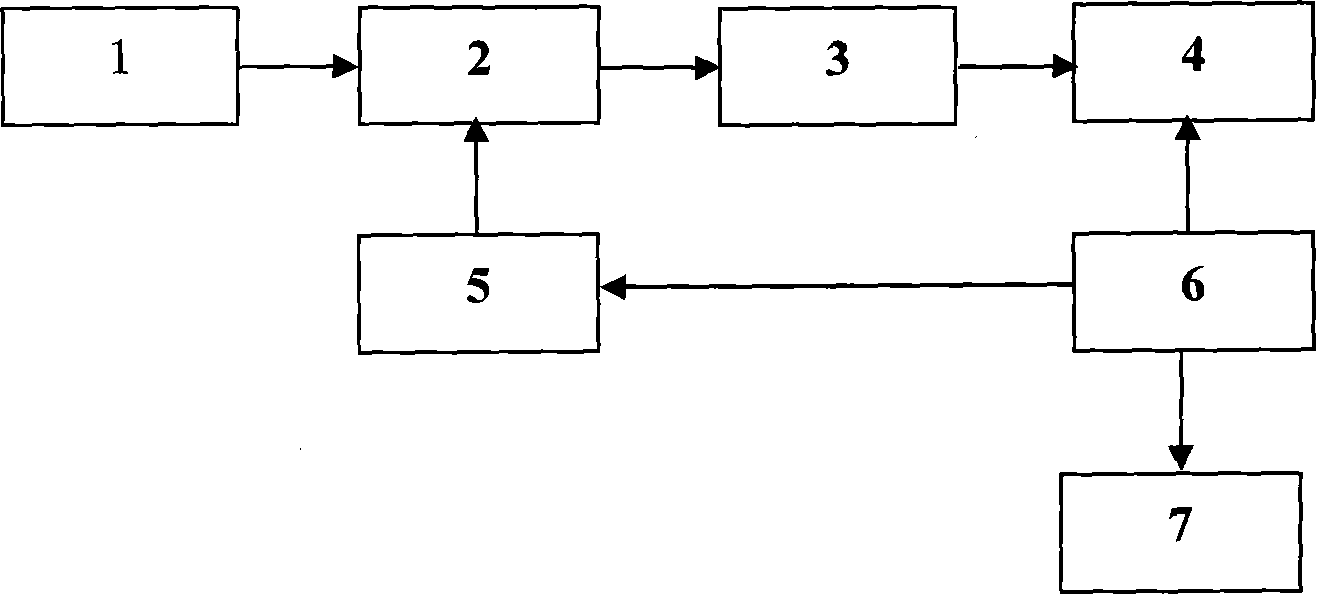
[0045] Figure 1 is a schematic block diagram of the composition of the evaluation device; the optical fiber light source 1 provides optical signals for the entire evaluation device, and injects the optical signal into the optical intensity modulator 2 through its pigtail; the power of the optical signal is received by the signal in the optical intensity modulator 2 The generator 5 modulates; the modulation signal is a sinusoidal signal, and the amplitude and frequency are controlled by the numerical control system 6. After the optical signal is sinusoidally modulated, it is input to the photodetector 3 through the output pigtail of the light intensity modulator 2; the photodetector under test The device 3 converts the optical signal into an electrical signal, and the high-speed acquisition card 4 performs digital-to-analog conversion and converts it into a dig...


PUM


Abstract

The utility model discloses a method for testing the frequency properties of the photoelectric detector used for fiber optic gyroscopes. A signal generator produces sinusoidal signals and adds the signal to a light intensity modulator to carry out sinusoidal modulation on the optical power of the optical signal from the fiber source in order to produce an optical signal with sinusoidal components. The measured photodetector converts the modulated optical signal into an electrical signal and samples the electric signal by means of high-speed data acquisition card, then conducts narrowband filter and signal processing over the collected samples and calculates the corresponding frequency response. The frequency sequence pre-selected by a numerical control system changes the frequency at which the sine wave generator (NC) system sends out signals , tests a series of frequency point responses, which can be combined into an amplitude frequency response curve of the measured photodetector, and the curve is transmitted to the terminal computer for displaying and storage. By controlling all the test processes by numerical control system, the utility model has the advantages of automatic measurement, fast testing speed, high testing precision, and therefore is suitable for carefully weighing the photodetector frequency performance in the whole operating frequency range.

Description

technical field [0001] The invention relates to a fiber optic gyro sensor technology, in particular to a method for testing the frequency characteristics of a photoelectric detector used in a fiber optic gyro. Background technique [0002] The amplitude-frequency characteristic curve refers to the numerical curve with the frequency as the abscissa and the gain of the system under the sinusoidal signal input at the frequency as the ordinate. This curve is used to evaluate the change characteristics of a system gain with frequency; The frequency is the abscissa, and the phase delay of the output signal of the system under the input of the frequency sinusoidal signal is the numerical curve of the ordinate. This curve is used to evaluate the variation characteristics of a system phase delay with frequency. The comprehensive amplitude-frequency characteristic curve and phase-frequency characteristic curve can describe the response mode of a system to any input signal, and charact...

Claims


Application Information

Patent Timeline
Patent Type & Authority Applications(China)
IPC IPC(8): G01R31/00G01R31/265G01M11/00G01M11/02G01C19/72
Inventor 陈杏藩刘承舒晓武胡慧珠
Owner ZHEJIANG UNIV
Why Eureka
Try Eureka