Method of designing anti-Doppler lower pair petal waveform

A design method and low sidelobe technology, applied in electrical components, synchronization devices, wireless communications, etc., can solve the problems of autocorrelation signal submersion, inapplicability, and can only reach -33dB, etc., achieve low sidelobe characteristics, improve self- Effects of Correlation Properties

Inactive Publication Date: 2008-04-09
CENT ACADEME OF SVA GROUP
0 Cites 0 Cited by

AI-Extracted Technical Summary

Problems solved by technology

[0003] The chirp signal has good anti-Doppler effect, and it still has good autocorrelation characteristics at the Doppler frequency up to several thousand Hz (one of the measures of the Doppler effect), but due to the The spectral component is linear, so...

Abstract

The invention provides a design method for anti-Doppler lower side lobe waveform. The design method for the waveform superimposes an interference signal r(Tau) on the spectrum component Beta Tau of the linear FM signal, thus obtaining a waveform with the characteristic of anti-Doppler lower side lobe. The method can further reduce the side lobes of the self-related waveform of the lineary FM signal without changing the anti-Doppler characteristic of the linear FM signal, so that the self-related characteristics of the linear FM signal is enhanced.

Application Domain

Synchronisation arrangementTransmission

Technology Topic

Spectral componentEngineering +4

Image

  • Method of designing anti-Doppler lower pair petal waveform
  • Method of designing anti-Doppler lower pair petal waveform
  • Method of designing anti-Doppler lower pair petal waveform

Examples

  • Experimental program(1)

Example Embodiment

[0033] The design method of the anti-Doppler low sidelobe waveform of the present invention will be further described in detail below.
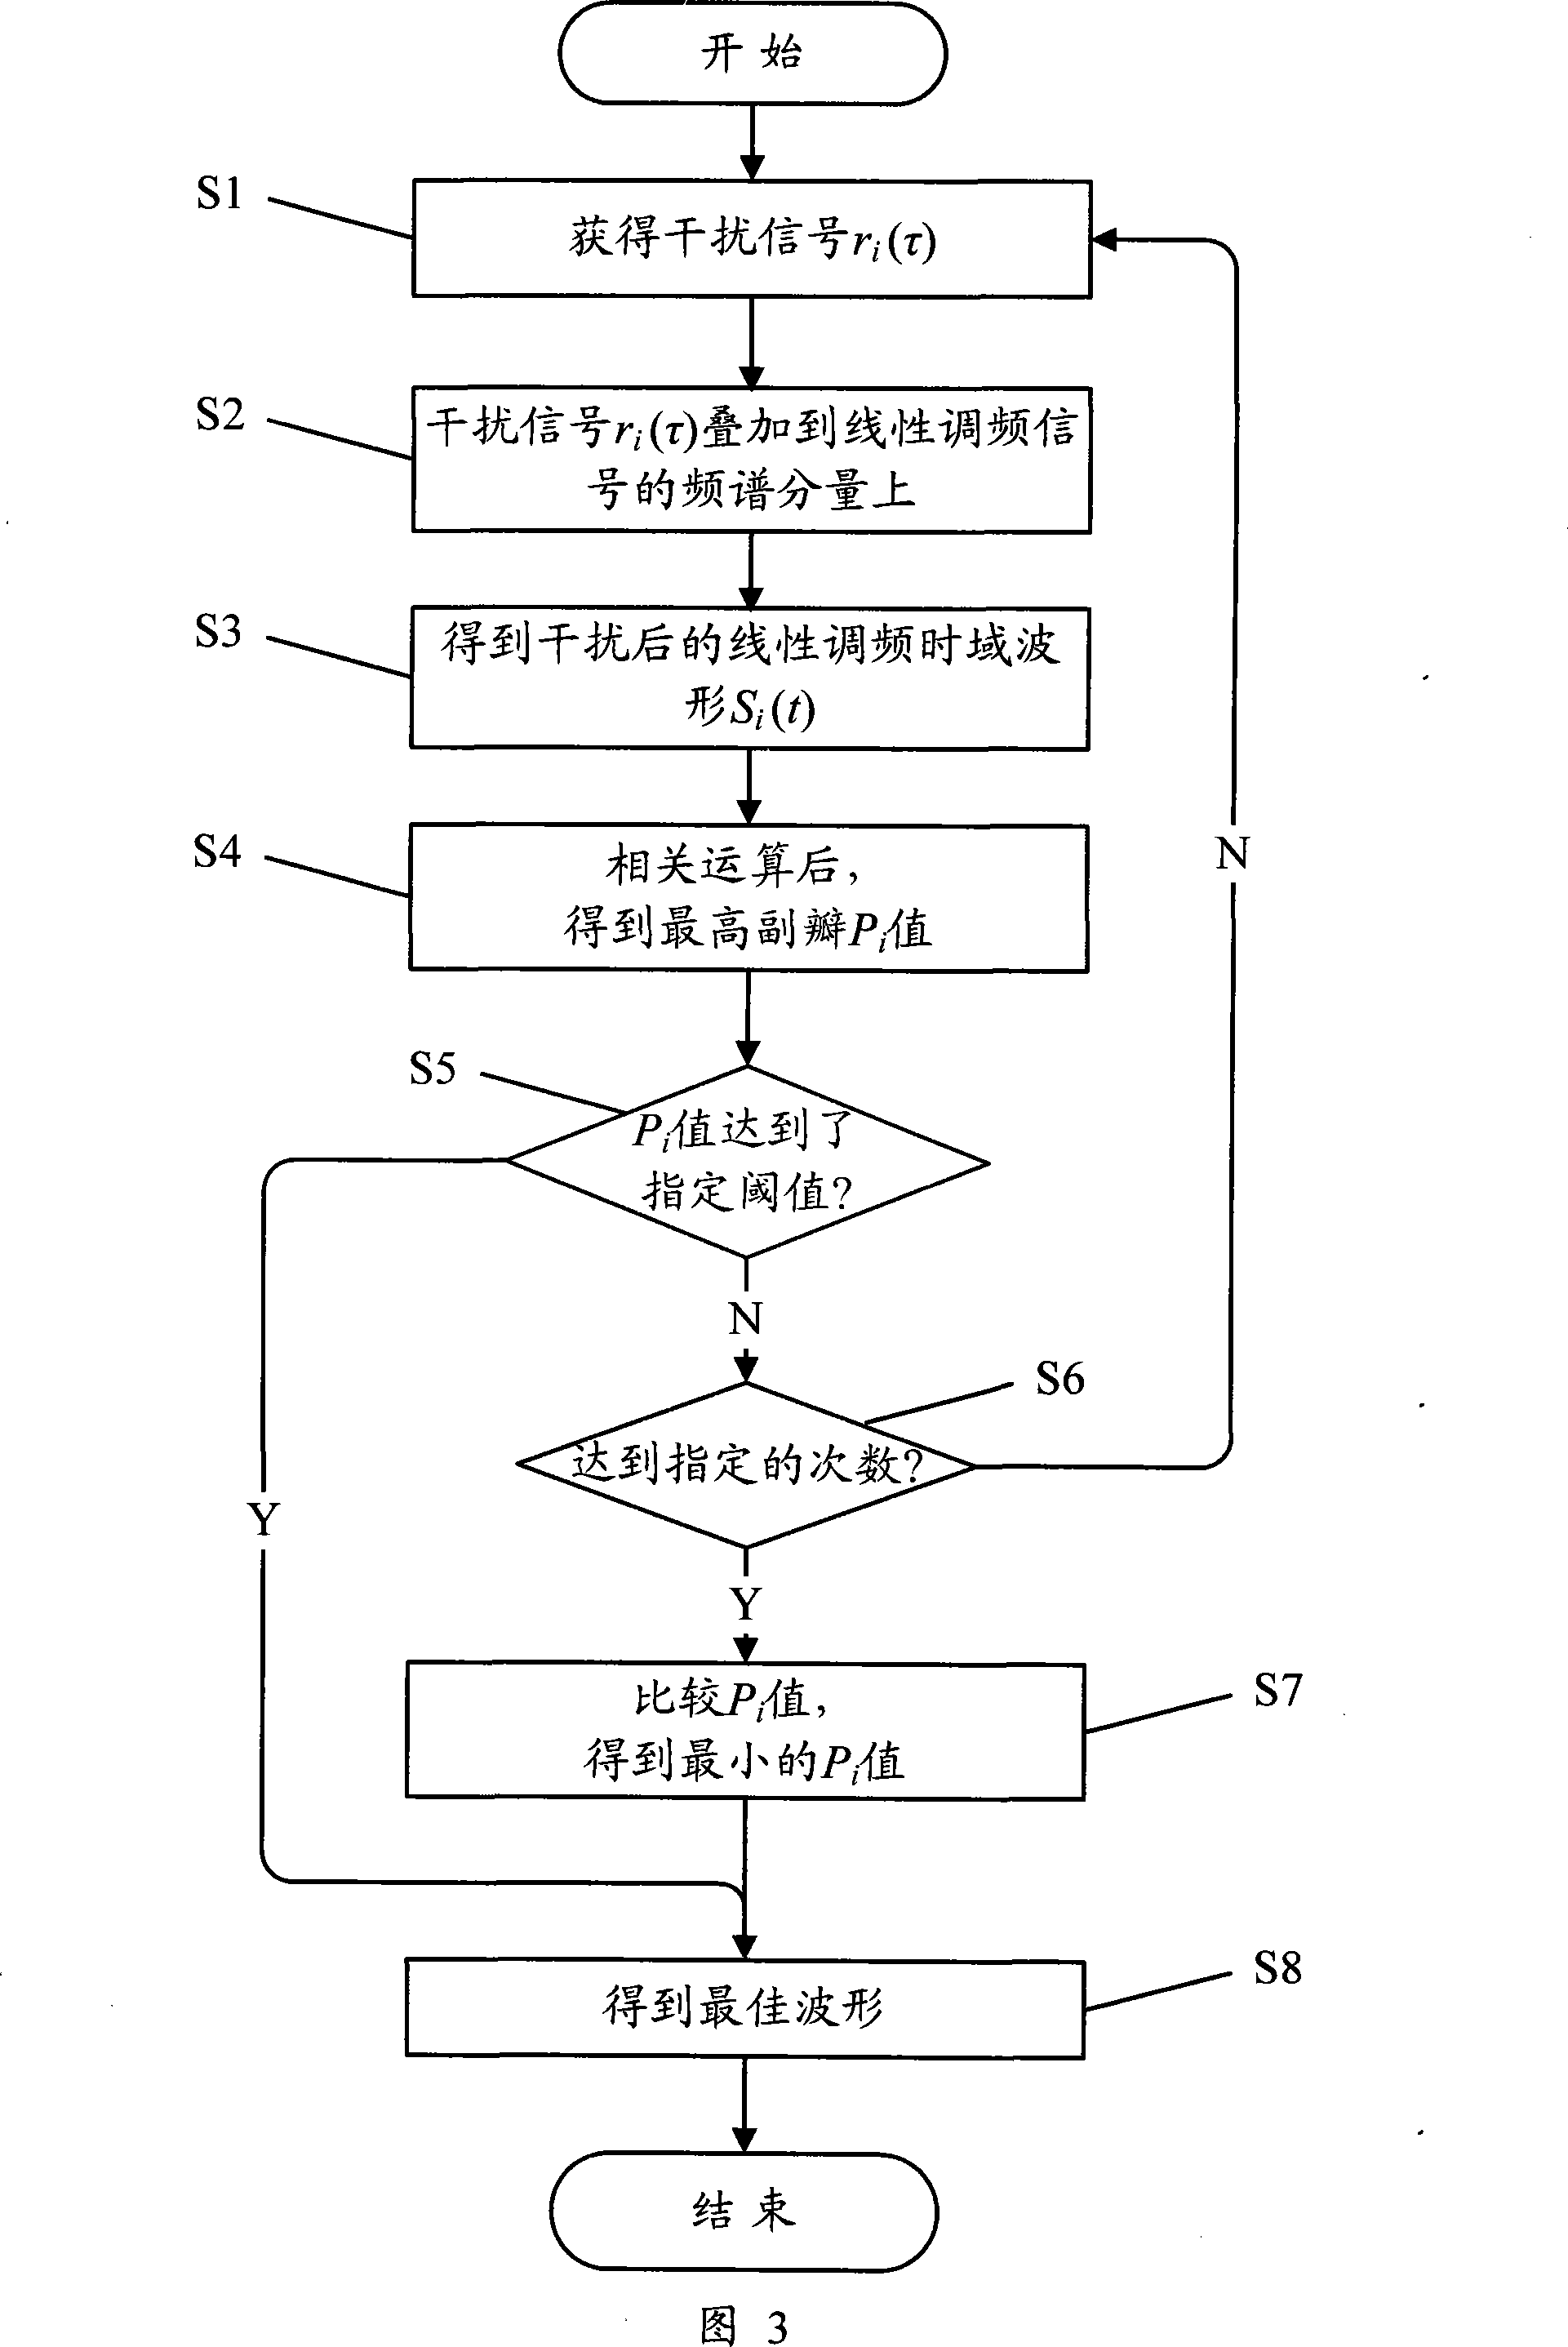
[0034] Fig. 3 shows the flow process of a kind of design method of anti-Doppler low sidelobe waveform of the present invention, according to this flow process, the specific steps of this embodiment are as follows:
[0035] Step S1: Initialize i=0; generate a random signal A with Gaussian distribution i (τ)(τ>=0), take the interference signal r i (τ)=A i (τ)(τ>=0), r i (τ)=-A i (-τ)(τ<0), where i=0, 1, 2, ...;
[0036] Step S2: The interference signal r i (τ) is arithmetically added to the frequency (β*τ) of the chirp signal to obtain an improved spectral component F i (τ);
[0037] Step S3: Calculate the time-domain waveform S of the improved chirp according to the following formula i (t), i=0, 1, 2, ...
[0038] S i ( t ) = e j 2 π ∫ - t t f ( βτ , r ( τ ) ) dτ - - - ( 4 ) ;
[0039] Step S4: Calculate the time-domain waveform S of the improved chirp according to formula (3) i (t) autocorrelation waveform R i (τ), and through the method of mathematical extremum, calculate R i (τ) the highest sidelobe value P i , i=0, 1, 2, ...; (if it is the first time to get P i value, then i=0, if it is the second time to get P i value, then i=1, and so on. )
[0040] Step S5: Judging P i Whether the value is less than the specified threshold-40dB, if not, then enter step S6, if so, then enter step S8;
[0041] Step S6: Judging whether the specified number of cycles has been reached, if yes, proceed to step S7, if not, return to step S1;
[0042] Step S7: Compare P i value to get the smallest P i value;
[0043] Step S8: Minimum one P i The waveform corresponding to the value is the best waveform.
[0044] According to the optimal waveform obtained by the above design method, the real part of the waveform function is shown in Figure 4, and the imaginary part is shown in Figure 5. The autocorrelation effect diagram of the optimal waveform is shown in Figure 6, in which the first sidelobe of the autocorrelation waveform reaches -41dB. The autocorrelation effect of the optimal waveform under the influence of the 10 kHz Doppler frequency shift effect is shown in Figure 7, which shows that the first sidelobe of the autocorrelation waveform reaches -39dB. The optimal waveform is not sensitive to Doppler effect, but also has the characteristics of very low autocorrelation sidelobe.

PUM

no PUM

Description & Claims & Application Information

We can also present the details of the Description, Claims and Application information to help users get a comprehensive understanding of the technical details of the patent, such as background art, summary of invention, brief description of drawings, description of embodiments, and other original content. On the other hand, users can also determine the specific scope of protection of the technology through the list of claims; as well as understand the changes in the life cycle of the technology with the presentation of the patent timeline. Login to view more.
Why Eureka
Try Eureka