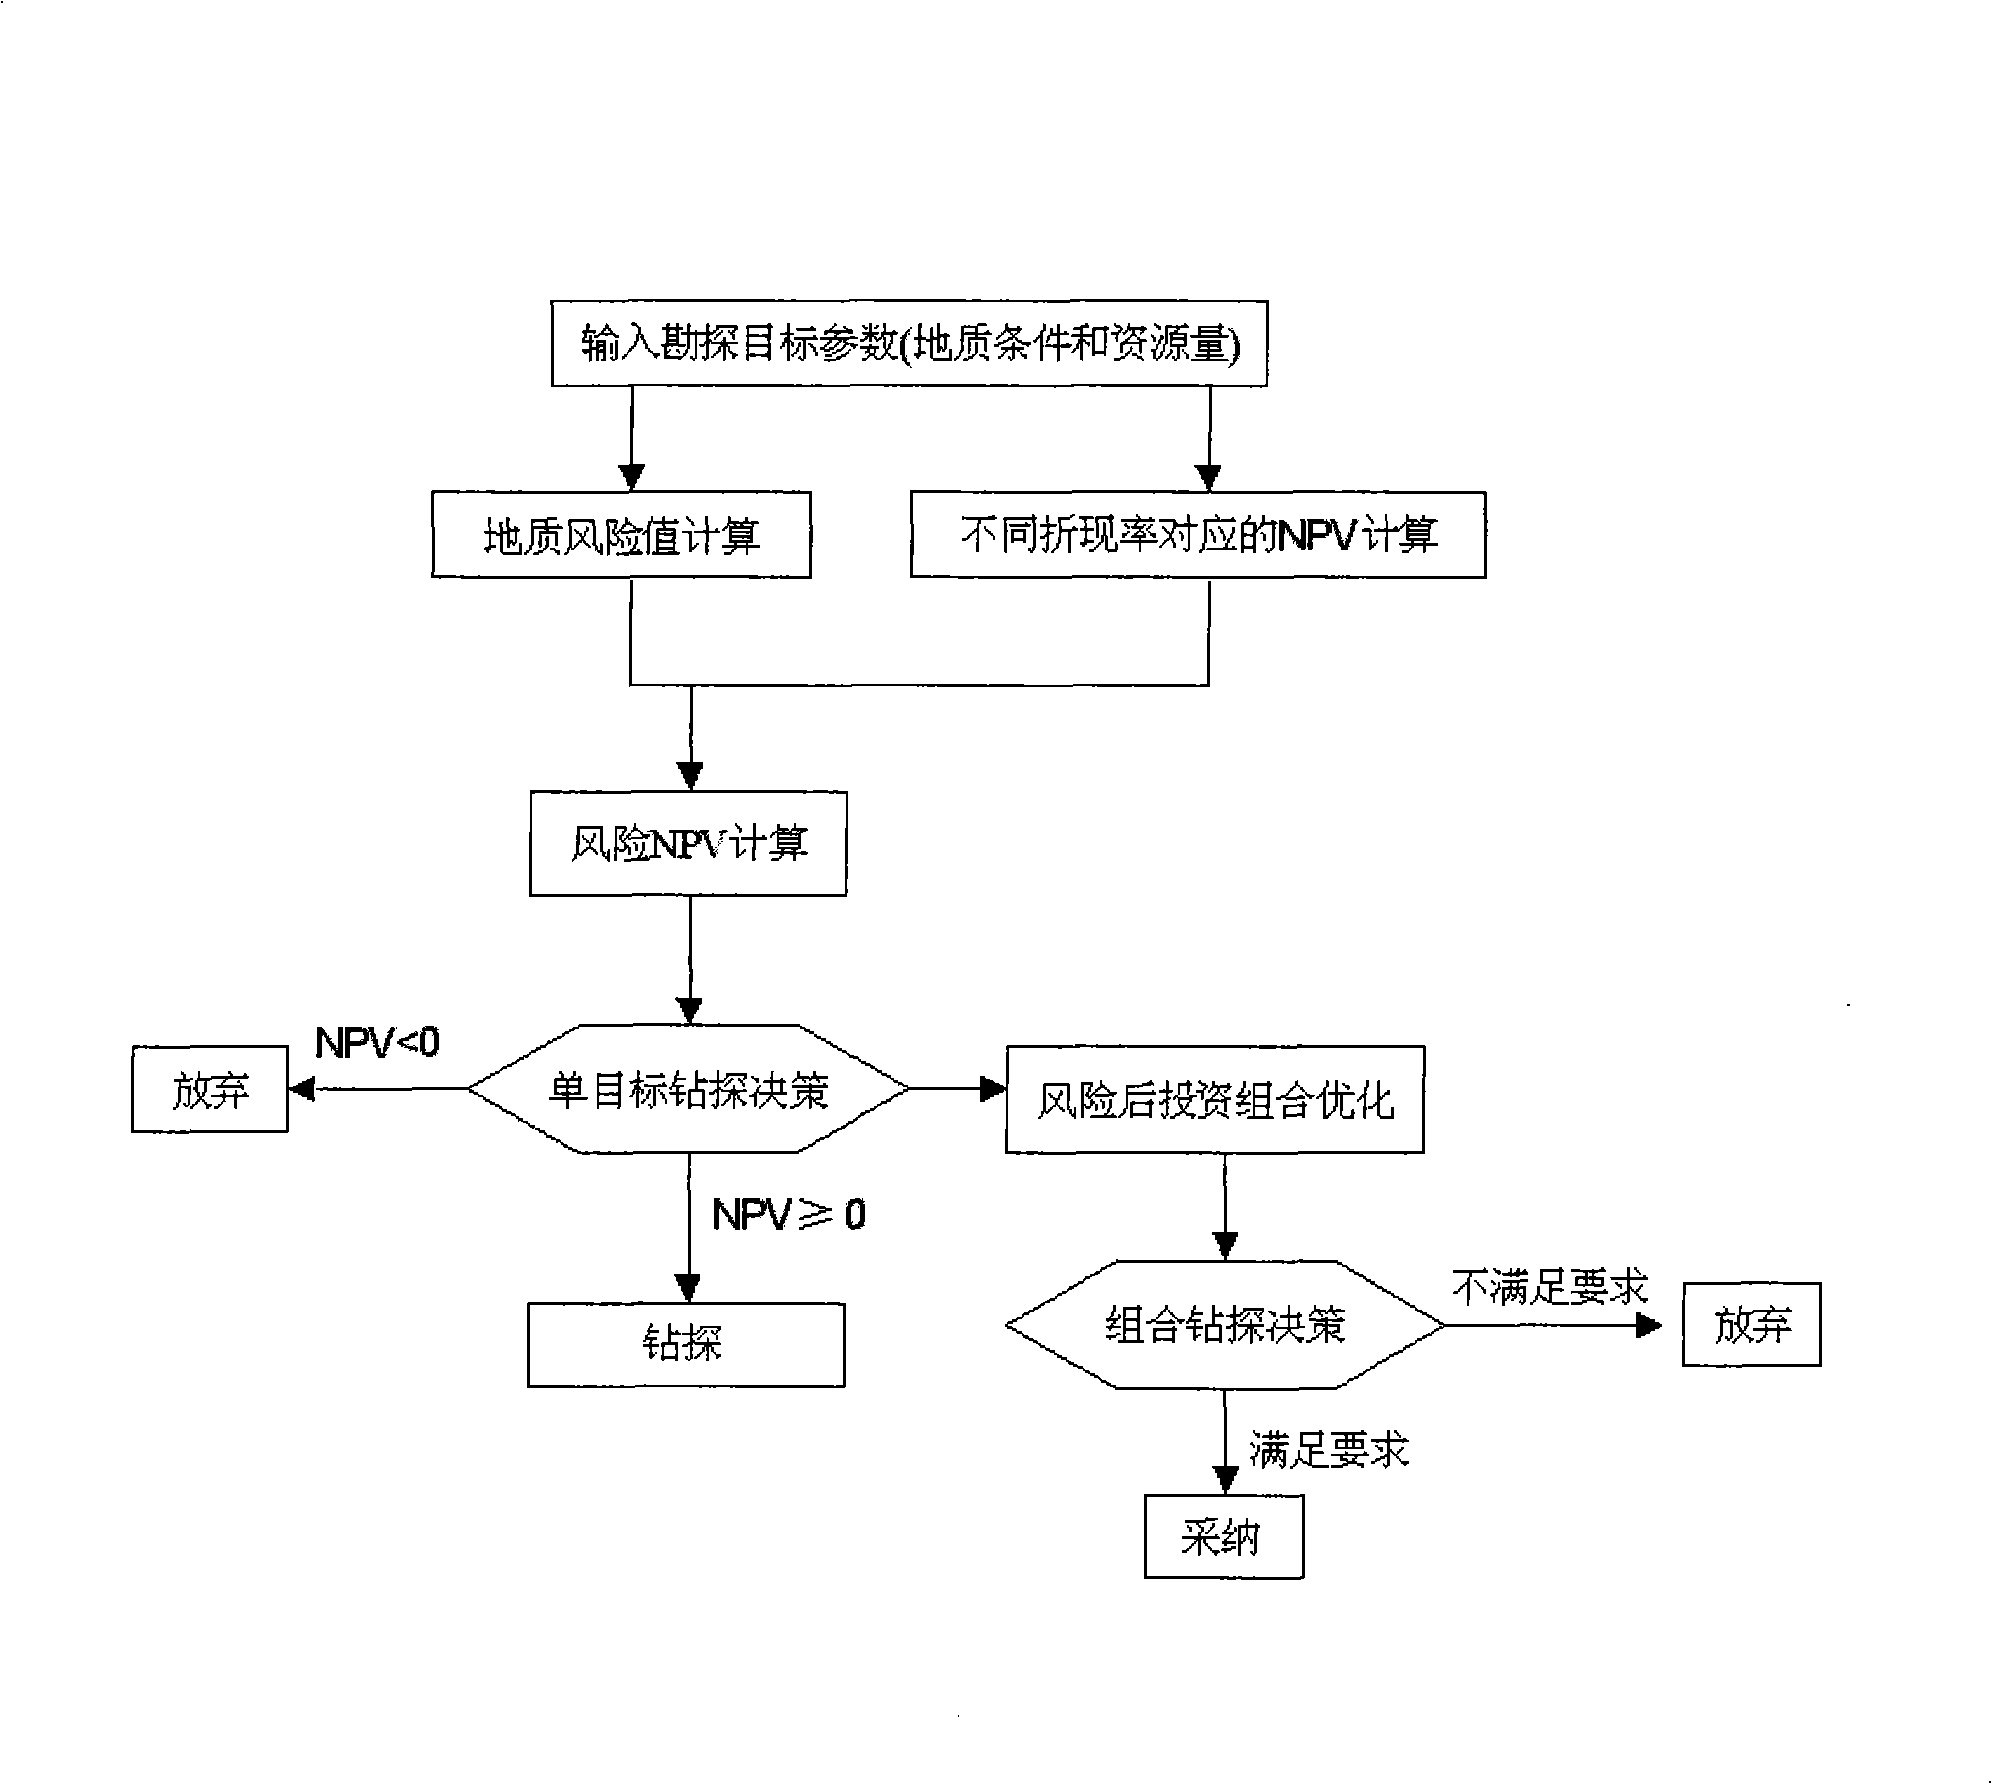
Method for deciding oil gas drilling by net present value after geologic risk
A net present value and risk technology, applied in data processing applications, instruments, forecasting, etc., can solve the problems of neglecting geological risks, reducing the credibility of investment portfolio results, not considering important risks of oil exploration, etc., to eliminate market non-systematic risk, increased credibility, increased success
- Summary
- Abstract
- Description
- Claims
- Application Information
AI Technical Summary
Benefits of technology
Problems solved by technology
Method used
Image
Examples
Embodiment 1
[0042] Calculation of post-risk economic indicators for the Tai 3 trap evaluation project of Daqing Oilfield:
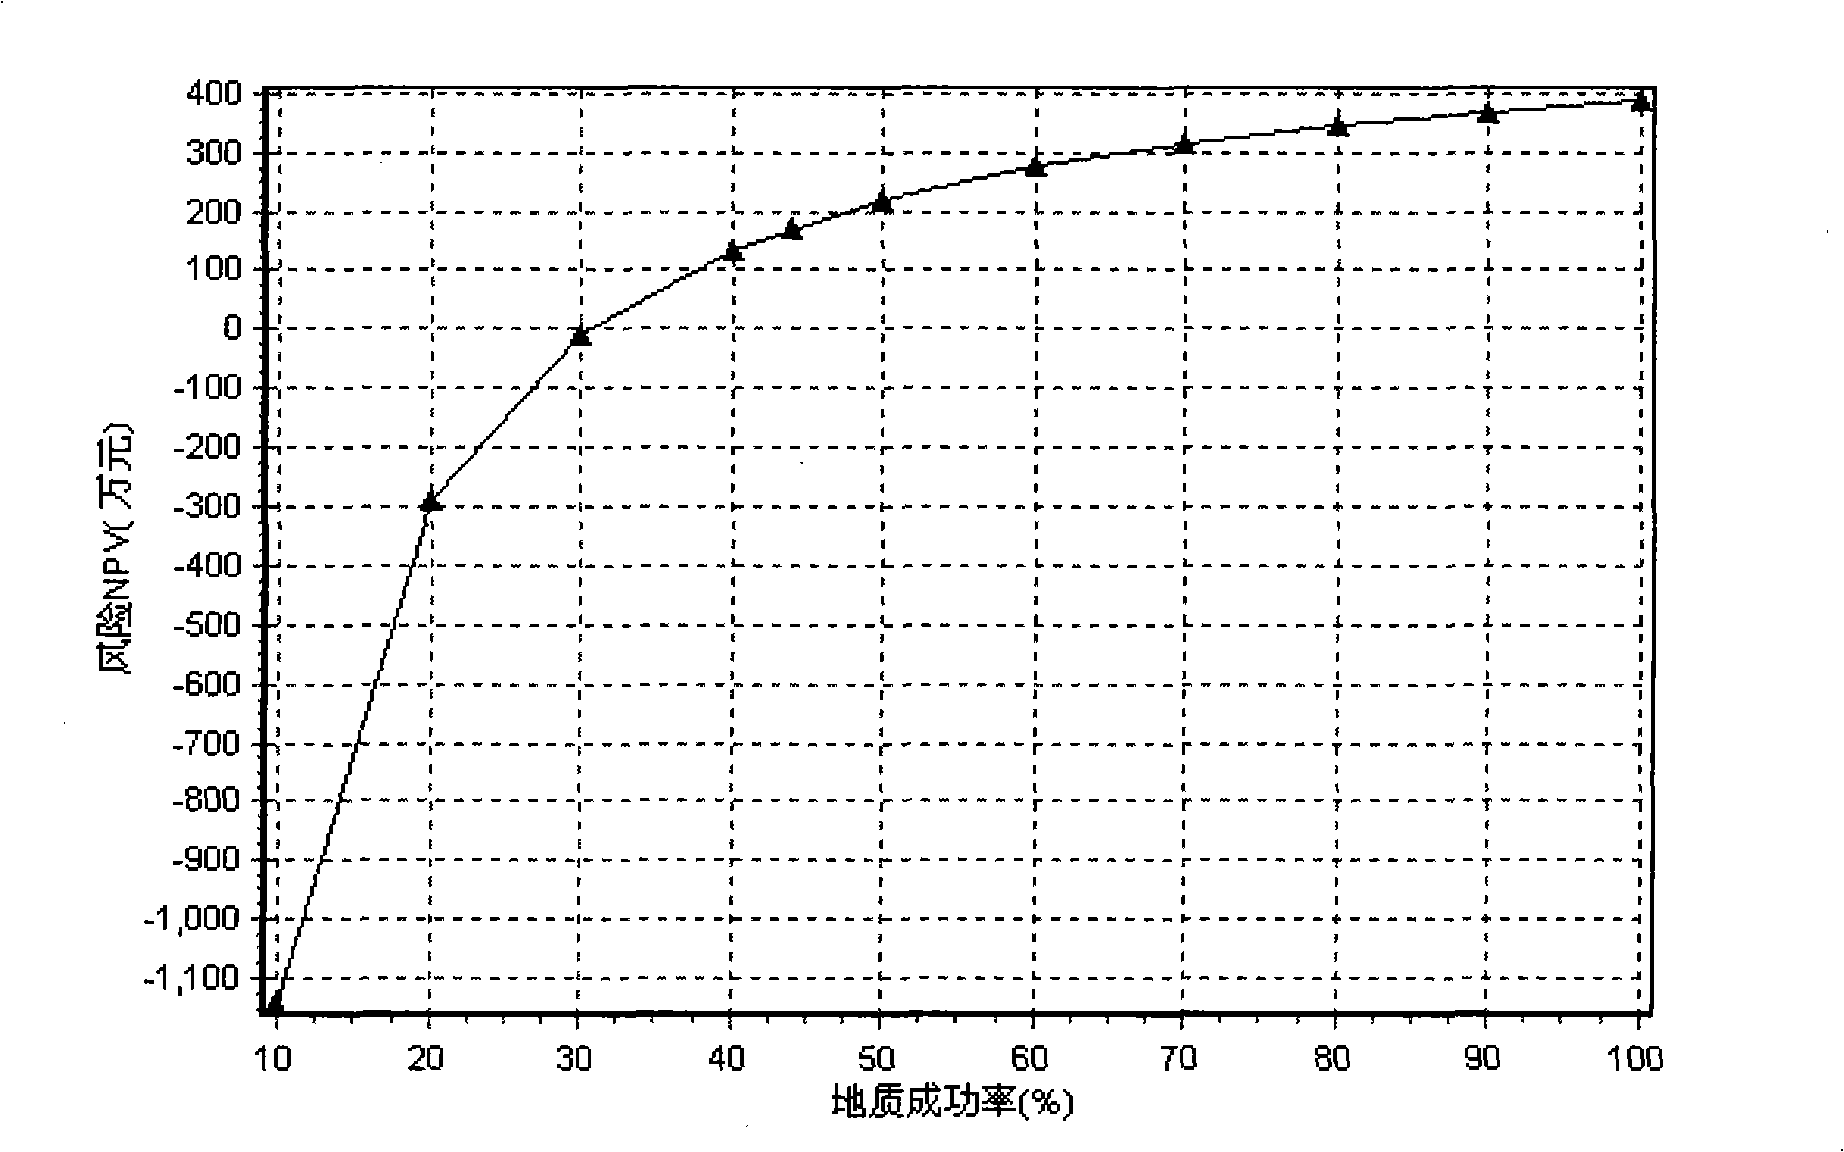
[0043] The net present value (NPV) of the Tai 3 trap evaluation project calculated in the conventional economic evaluation is 3.883 million yuan, and the geological risk is determined to be 56% after comprehensive geological evaluation, that is, the geological success rate is 44%. The calculation method of net present value after risk is used to calculate the Tai 3 trap evaluation project. figure 1 It is a graph of risk NPV results corresponding to different success rates calculated by the post-risk net present value calculation method. The calculation results show that when the geological success rate is 44%, the risk IRR is equal to 13.07%, and the risk NPV is equal to 1.71 million yuan, indicating that the Tai 3 trap can be drilled after considering the geological risk. The calculation results of risk IRR and risk NPV corresponding to each success rate are shown in T...
Embodiment 2
[0045]Use the post-risk optimization portfolio model to optimize the portfolio of 26 trap evaluation projects in Daqing Oilfield:
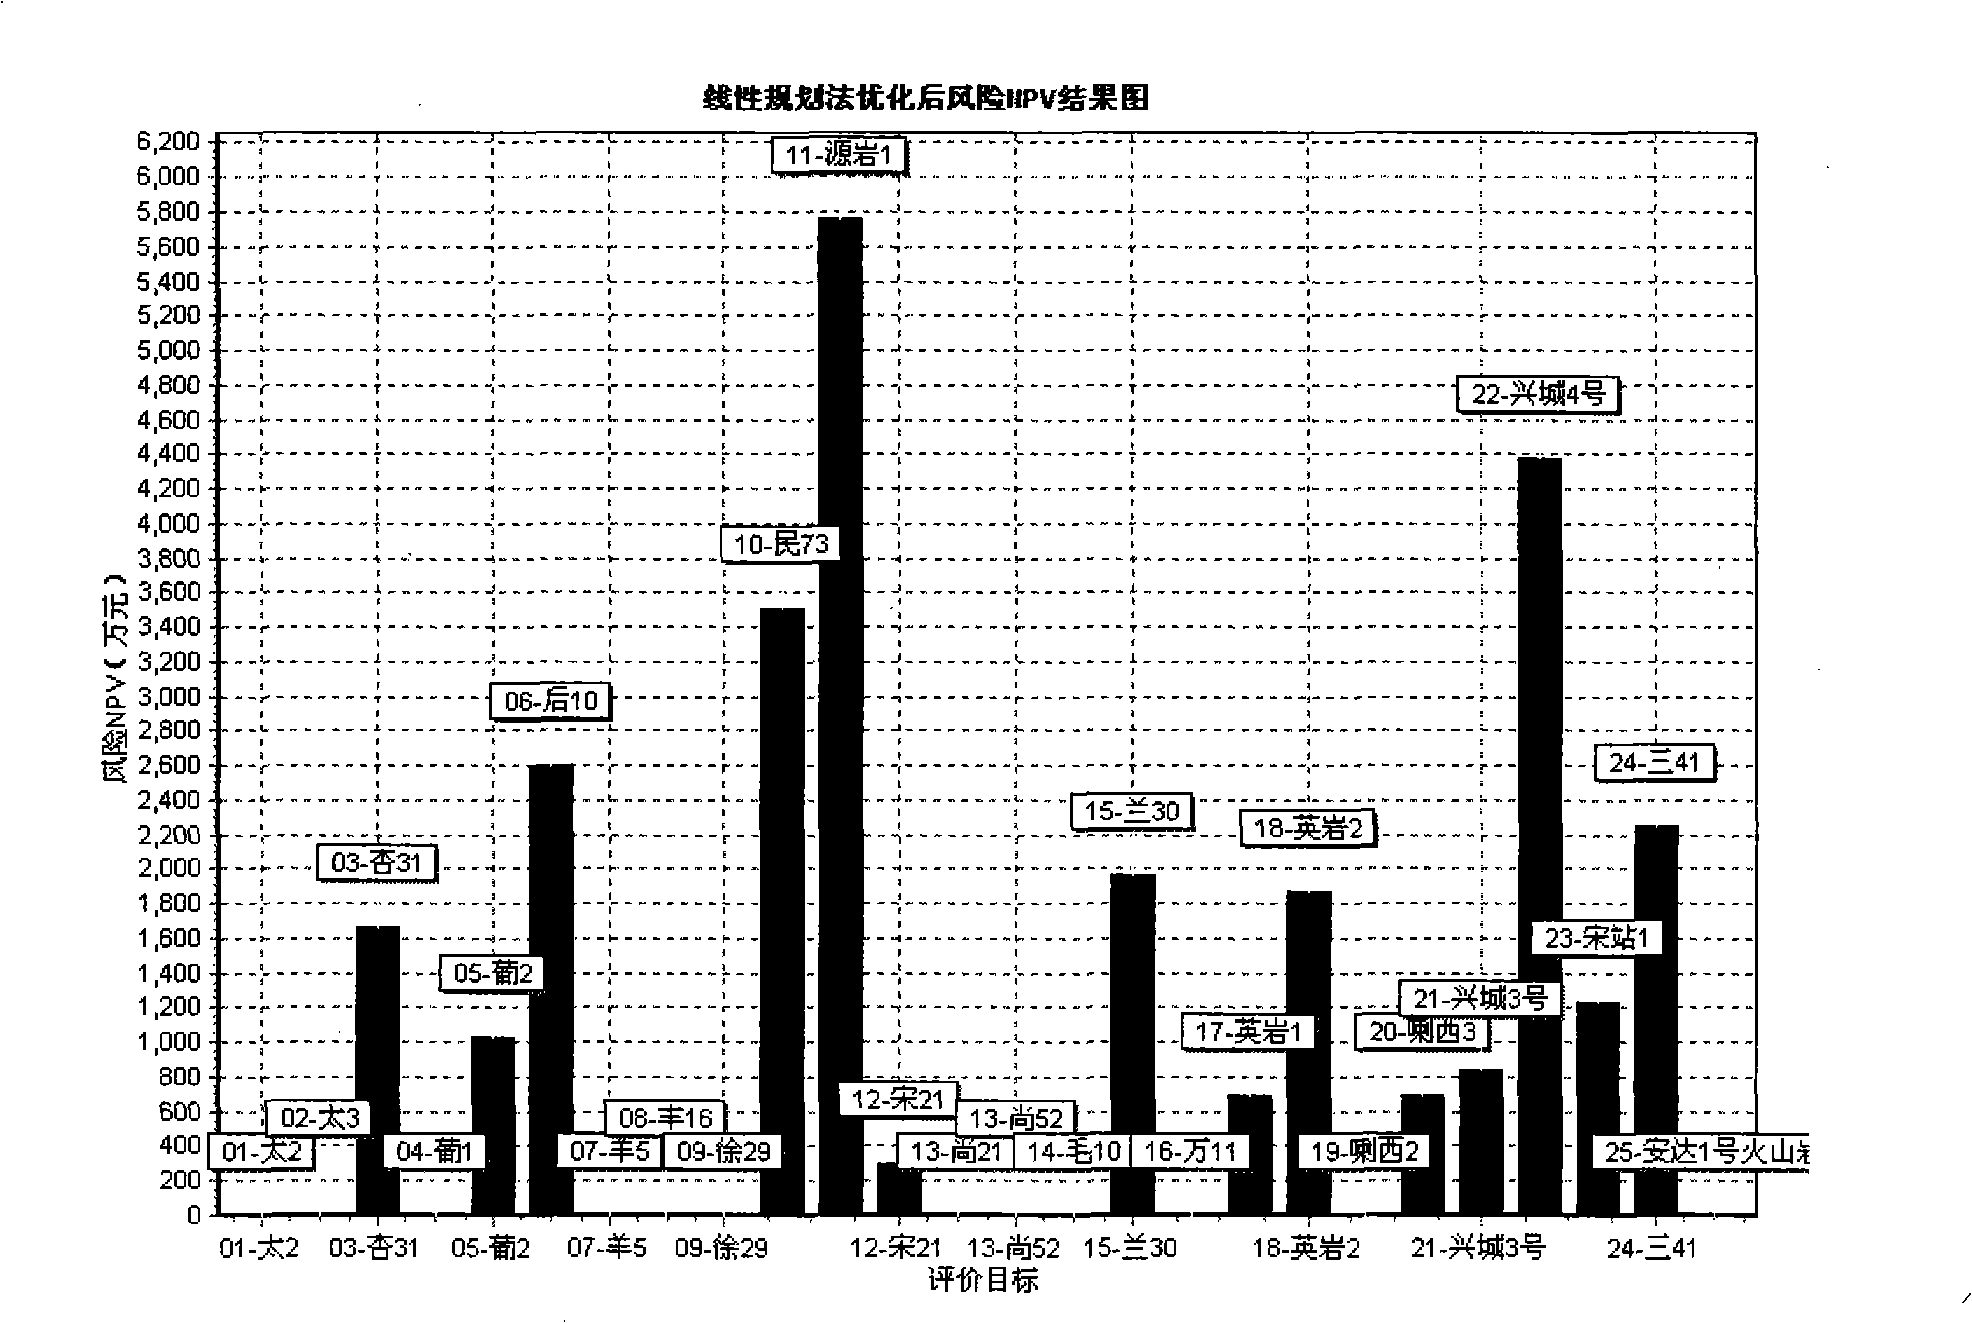
[0046] The 26 trap evaluation projects in Daqing Oilfield were selected, and the 26 trap evaluation projects were first subjected to post-risk economic evaluation to obtain the risk NPV and risk reserves of each trap, and then the post-risk optimization portfolio calculation was performed. figure 2 It is the result graph of risk NPV after optimization by linear programming method of optimized portfolio model after risk, image 3 It is a post-risk optimization portfolio model to optimize the investment efficient portfolio diagram. See Table 2 for the post-risk portfolio optimization results of linear programming. The calculation results show that the various exploration indicators (exploration investment, development investment, total investment and risk reserves) of the investment portfolio meet the requirements, indicating that the investment por...
PUM
 Abstract
Description
Claims
Application Information
 - R&D
- Intellectual Property
- Life Sciences
- Materials
- Tech Scout
- Unparalleled Data Quality
- Higher Quality Content
- 60% Fewer Hallucinations
Browse by: Latest US Patents, China's latest patents, Technical Efficacy Thesaurus, Application Domain, Technology Topic, Popular Technical Reports.
© 2025 PatSnap. All rights reserved.Legal|Privacy policy|Modern Slavery Act Transparency Statement|Sitemap|About US| Contact US: help@patsnap.com


