
Method and system for implementing statistical forms customization

A technology of statistical reports and reports, applied in two-way working systems, calculations, instruments, etc., can solve problems such as single form of result documents, affect system performance, increase server load, etc., and achieve the effect of simple and fast generation

Inactive Publication Date: 2009-07-08
ZTE CORP
View PDF0 Cites 46 Cited by
  • Summary
  • Abstract
  • Description
  • Claims
  • Application Information

AI Technical Summary

Problems solved by technology

[0004] In the prior art, the process of obtaining a statistical report for a certain type of business information is that the system manager first puts forward the requirements, defines the elements and specific display methods that the required report should contain, and then, due to the existing operation database records of the enterprise To extract useful data information, it is necessary to understand the underlying data structure of the system, which requires the participation of technical personnel. After receiving the statistical requirements, the professional technical personnel will connect to the operation database server to perform operations one by one. Obtain the query results of each type of information, and then manually classify and organize according to statistical requirements, and then fill the data into professional report generation software to generate result chart documents. Obviously, the process from obtaining the result data to completing the report is very complicated and cumbersome
In the process of obtaining the statistical report of a certain business, the user must have a better understanding of the basic specifications of the system data and its storage form in the database. For non-professional technicians, the technical difficulty is relatively large, which increases the daily work of the system. Operational overhead, when users directly perform database operations on the IPTV system server, it is easy to increase the server load and affect system performance
In addition, users cannot intuitively customize the elements and specifications of the report, and the output result document has a single format

Method used


Image

  • Method and system for implementing statistical forms customization
  • Method and system for implementing statistical forms customization
  • Method and system for implementing statistical forms customization

Examples


no. 2 example

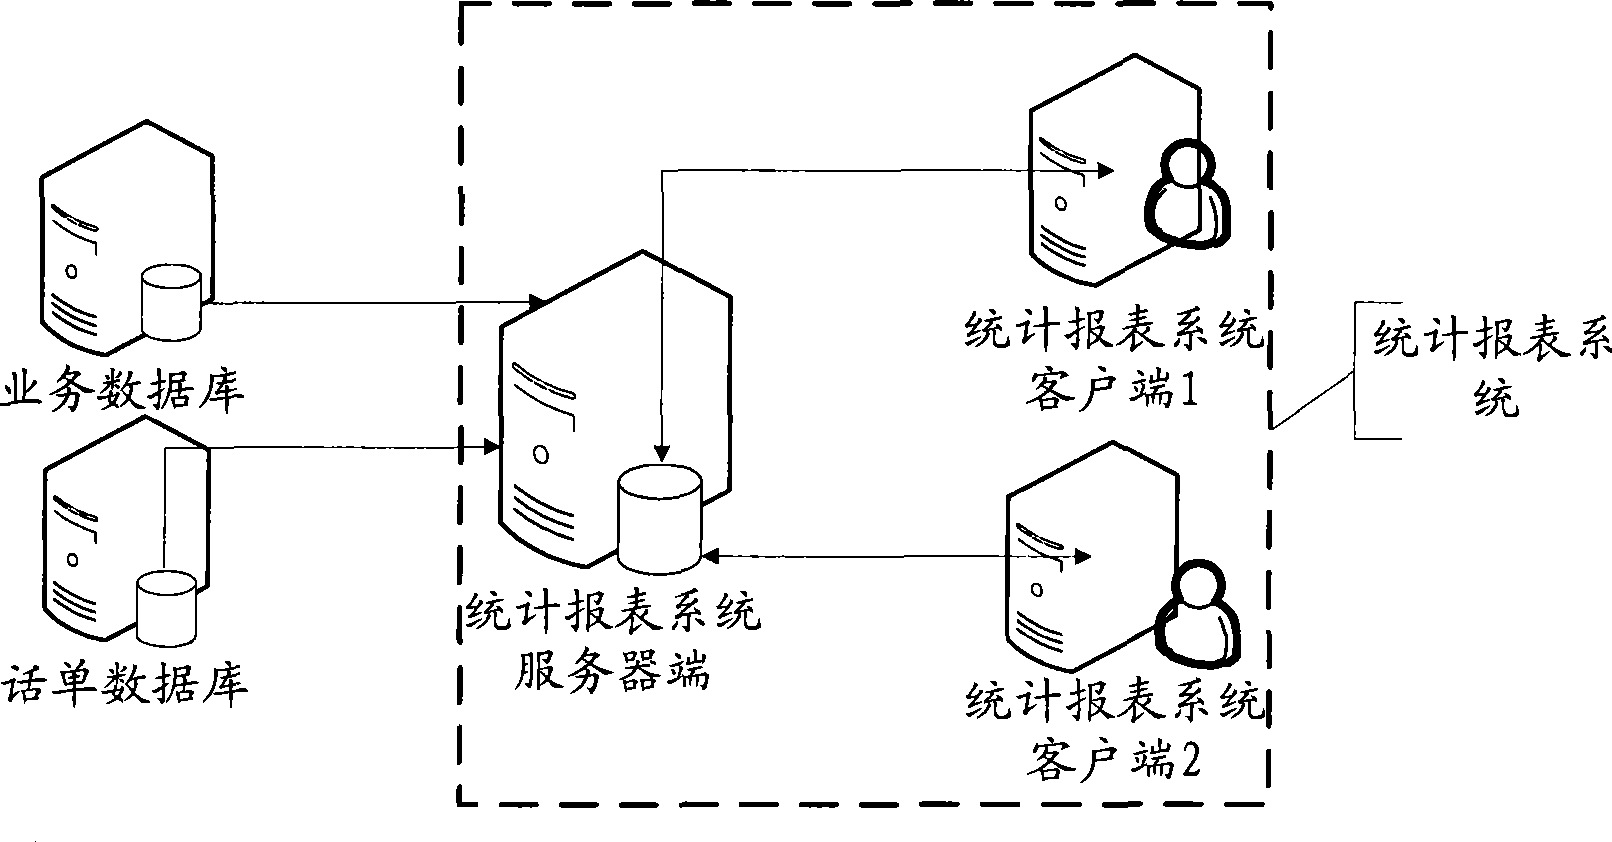
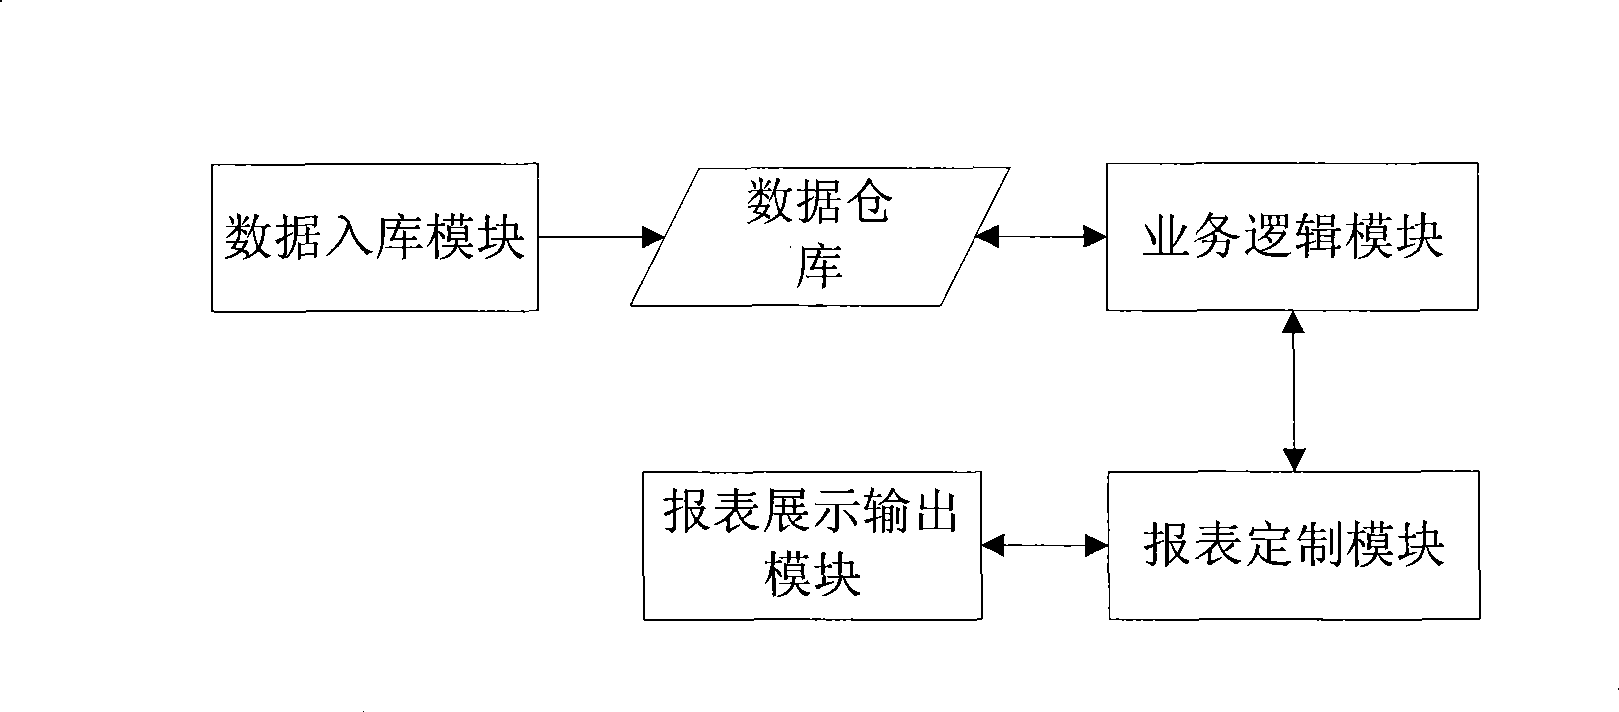
[0040] The second embodiment of the present invention is a system for customizing statistical reports, including a statistical report system server and a statistical report system client. The statistical report system server is deployed on a high-performance server, and the statistical report system server is connected to the business The database is connected to the bill database, and the statistical report system client and the data warehouse perform data interaction in the form of Client / Server architecture. The server side of the statistical report system includes a data storage module, a data warehouse and a business logic module, and the client side of the statistical report system includes a report customization module and a report display output module;

[0041] The data storage module is used to obtain the original business data of the IPTV system, and import the original business data into the data warehouse module after processing;

[0042] The data warehouse module...


PUM


Abstract

The invention discloses a method for realizing statistical report customization. The method comprises the following steps: step one, obtaining original business data in an IPTV (Internet Protocol TV) system, and forming a data warehouse after processing; step two: receiving visit of users to the data warehouse through a visualization interface; and step three: linking the parameter information set by the user and the data warehouse, so as to produce data warehouse inquiry statement needed by a report and carry out inquiry, and obtaining result report. The invention further discloses a system for realizing statistical report customization, and the system comprises a data loading module, a data warehouse module, a business logic module, a report customization module, and a report display and output module. The invention shields an underlying data structures in the prior operation database, so that when carrying out data inquiry, a user does not need to understand the underlying data structure of the system. The invention ensures that the user can conduct customization to report theme, element and display mode through the visualization interface, and report documents can be simply and quickly generated.

Description

technical field [0001] The present invention relates to the field of IPTV (Internet Protocol Television, Internet TV) system operation, in particular to a method and system for realizing customization of statistical reports. Background technique [0002] The statistical report of the IPTV system refers to the result document formed after the summary and analysis of the business data generated during the operation of the IPTV system. These documents usually need to be submitted to the management personnel intuitively in the form of charts, etc., so as to understand the operation of the entire system in a timely manner. situation and provide decision support. For example, it is possible to make statistics on the VOD (Video On Demand, video on demand) viewing status of all users in a certain live network site within a day, so as to distinguish popular programs and unpopular programs in the resources operated by the current IPTV system, and then according to the established The...

Claims


Application Information

Patent Timeline
IPC IPC(8): G06F17/30H04N7/173
Inventor 王德超张恩波王智王国俊
Owner ZTE CORP
Learn More