Method and device for analyzing acceleration response of rail vehicles

An acceleration response, rail vehicle technology, applied in the field of rail vehicle test data analysis, to achieve the effect of easy implementation, simple algorithm, strong engineering application value

Active Publication Date: 2010-06-16
LOCOMOTIVE & CAR RES INST OF CHINA ACAD OF RAILWAY SCI
View PDF0 Cites 22 Cited by
  • Summary
  • Abstract
  • Description
  • Claims
  • Application Information

AI Technical Summary

Problems solved by technology

[0006] However, there is currently no method that can directly use vehicle dynamics line tests or even vehicle dynamics monitoring dat

Method used


Image

  • Method and device for analyzing acceleration response of rail vehicles
  • Method and device for analyzing acceleration response of rail vehicles
  • Method and device for analyzing acceleration response of rail vehicles

Examples


Embodiment 1

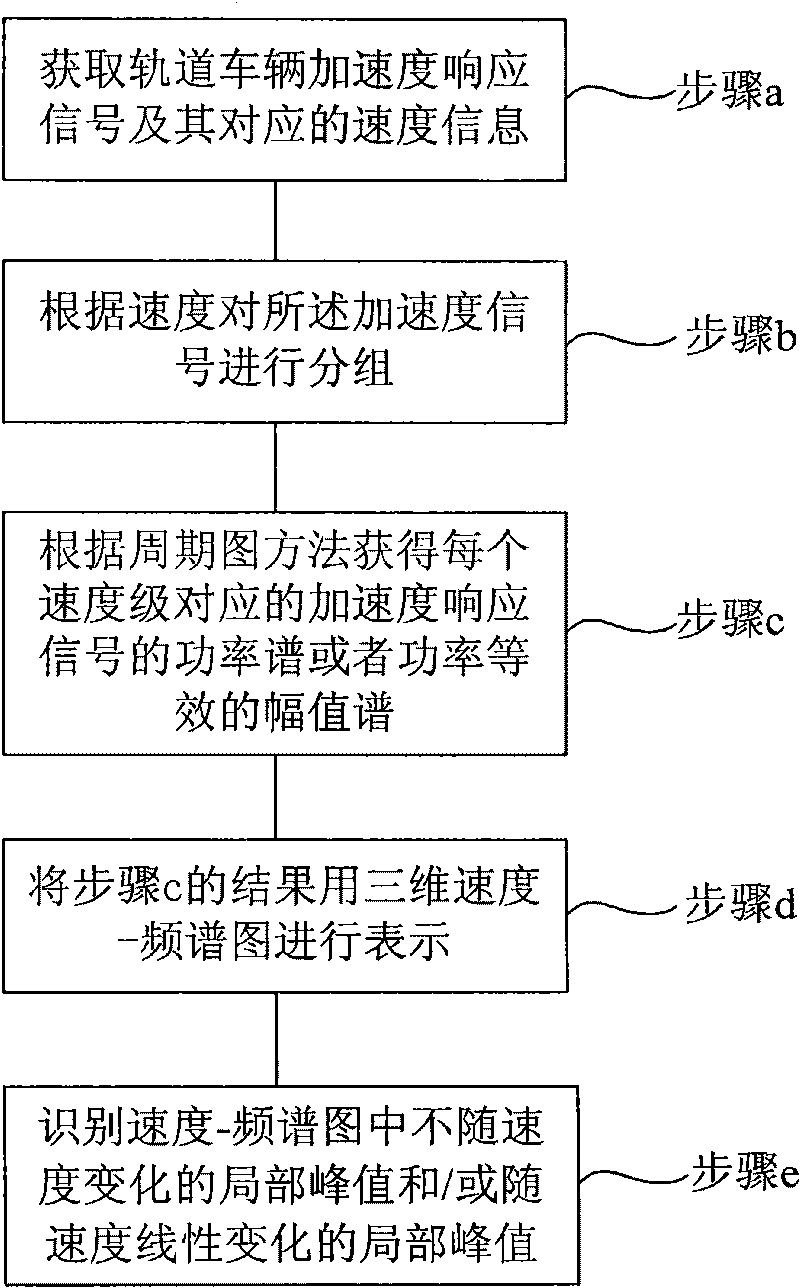
[0070] Such as figure 1 Shown is a schematic flow chart of a method for analyzing the acceleration response of a rail vehicle provided by an embodiment of the present invention. The embodiment of the present invention performs relatively comprehensive vertical and lateral characteristics on a high-speed train with a speed class of 350km / h on the Beijing-Tianjin line. And input analysis. This analysis is based on the speed-frequency domain. The method includes the following steps:

[0071] Step a: Obtain the acceleration response signal of the rail vehicle and its corresponding speed information.

[0072] In order to correctly obtain the acceleration response signal of the rail vehicle and its corresponding speed information, an acceleration sensor and a speed sensor can be installed on the rail vehicle. In this embodiment, a more comprehensive vertical and lateral characteristics and input analysis are required. Vertical and lateral acceleration sensors and speed sensors are instal...

Embodiment 2

[0125] Such as Figure 13 This is a schematic flowchart of another method for analyzing acceleration response of rail vehicles provided by an embodiment of the present invention. The embodiment of the present invention also analyzes a high-speed train with a speed class of 350km / h on the Beijing-Tianjin line. In the method, step a- Step e is similar to that in the foregoing embodiment, and will not be repeated here. The difference from the first embodiment above is that this embodiment also includes step f-step i. The premise of performing these steps is that at least two acceleration signals are obtained at the same time in step a and there is input-output between the acceleration signals. Relationship, step f-step i specifically includes:

[0126] Step f: At each speed level, obtain the nominal transfer between the acceleration signals according to the power spectrum or amplitude spectrum obtained in step c, and the algorithm of step f and the amplitude estimation of the transf...

Embodiment 3

[0148] This embodiment provides the reasons for the abnormal vertical vibration of a subway rail vehicle and proposes directions for maintenance and improvement, including the following steps:

[0149] Step 1: Correctly obtain the digital signal in response to the acceleration of the rail vehicle and its corresponding speed information.

[0150] The JL-W4 rail vehicle operation quality meter was used to measure the vertical, horizontal and vertical acceleration near the traction pin of a subway rail vehicle, and the relevant information such as speed and operating conditions were matched according to the train monitoring data. The sampling frequency was 256 Hz. , The original signal filtering frequency is 20Hz.

[0151] Step 2: Group the acceleration signals at equal speed intervals, and obtain the amplitude spectrum equivalent to the power of each speed level acceleration signal and the maximum value of the amplitude spectrum according to the periodogram method.

[0152] In this embo...


PUM


Abstract

The invention provides a method and device for analyzing the acceleration response of rail vehicles. The method comprises the following steps: a. acquiring acceleration response signals of the rail vehicles and the corresponding speed information thereof; b. grouping the acceleration signals according to speeds; c. obtaining a power spectrum or a power equivalent amplitude spectrum of the corresponding acceleration response signal of each speed stage by a periodogram method; d. representing the result of step c by a three-dimensional speed-frequency spectrogram; and e. identifying local peak values not changing with speed and/or local peak values changing with speed in the three-dimensional speed-frequency spectrogram. The method and the device for analyzing the acceleration response of the rail vehicles of the embodiment of the invention can comprehensively, visually and effectively obtain the characteristics of the rail vehicles and input of fixed wavelength vehicles.

Description

Technical field [0001] The invention relates to an analysis method of rail vehicle test data, in particular to a method and device for analyzing the acceleration response of a rail vehicle. Background technique [0002] The analysis of the vibration characteristics of rail vehicles is an important means of design optimization, operation and maintenance of rail vehicles. It is generally completed through vehicle dynamics simulation calculations and vehicle indoor vibration or rolling vibration tests. Due to software capabilities, model parameters, laboratory incentive characteristics and incentive level limitations, the results of simulation calculations and laboratory tests are often different from the actual operation of the vehicle on the road, and sometimes large deviations may occur. [0003] It is one of the long-term research directions of the majority of railway researchers to directly use the vehicle dynamics line test and even the dynamics monitoring data during actual ope...

Claims


Application Information

Patent Timeline
IPC IPC(8): G01P15/18G01M17/08
Inventor 曾宇清甘敦文董孝卿倪纯双于卫东扈海军刘秀波王卫东黄强
Owner LOCOMOTIVE & CAR RES INST OF CHINA ACAD OF RAILWAY SCI
Why Eureka
Try Eureka