Method for calculating apparent formation water resistivity spectrum and parameters by applying electric imaging data of point-by-point calibration

A technology of formation water resistivity and electrical imaging, which is applied in the fields of electrical/magnetic exploration, electrical/magnetic detection for well logging records, water resources assessment, etc., and can solve the problem of large software workload, large scale effect, many steps, etc. question

Active Publication Date: 2011-04-27
PETROCHINA CO LTD
View PDF2 Cites 19 Cited by
  • Summary
  • Abstract
  • Description
  • Claims
  • Application Information

AI Technical Summary

Problems solved by technology

[0007] For the preprocessing of electrical imaging logging data, in order to overcome the problems of many steps, heavy software workload and calibration effect in the existing shallow resistivity data calibration electrical imaging data method, the shallow resistivity point-by-point scale imaging data was invented. method, and on this basis, calculate the resistivity spectrum and parameters of electrical imaging data to evaluate the reservoir fluid properties

Method used


Image

  • Method for calculating apparent formation water resistivity spectrum and parameters by applying electric imaging data of point-by-point calibration
  • Method for calculating apparent formation water resistivity spectrum and parameters by applying electric imaging data of point-by-point calibration
  • Method for calculating apparent formation water resistivity spectrum and parameters by applying electric imaging data of point-by-point calibration

Examples


Embodiment Construction

[0037] In Schlumberger Geoframe (1) 3.8 Environment and Cifsun (4) The above-mentioned content of the invention is realized in the environment, and corresponding program modules are developed.

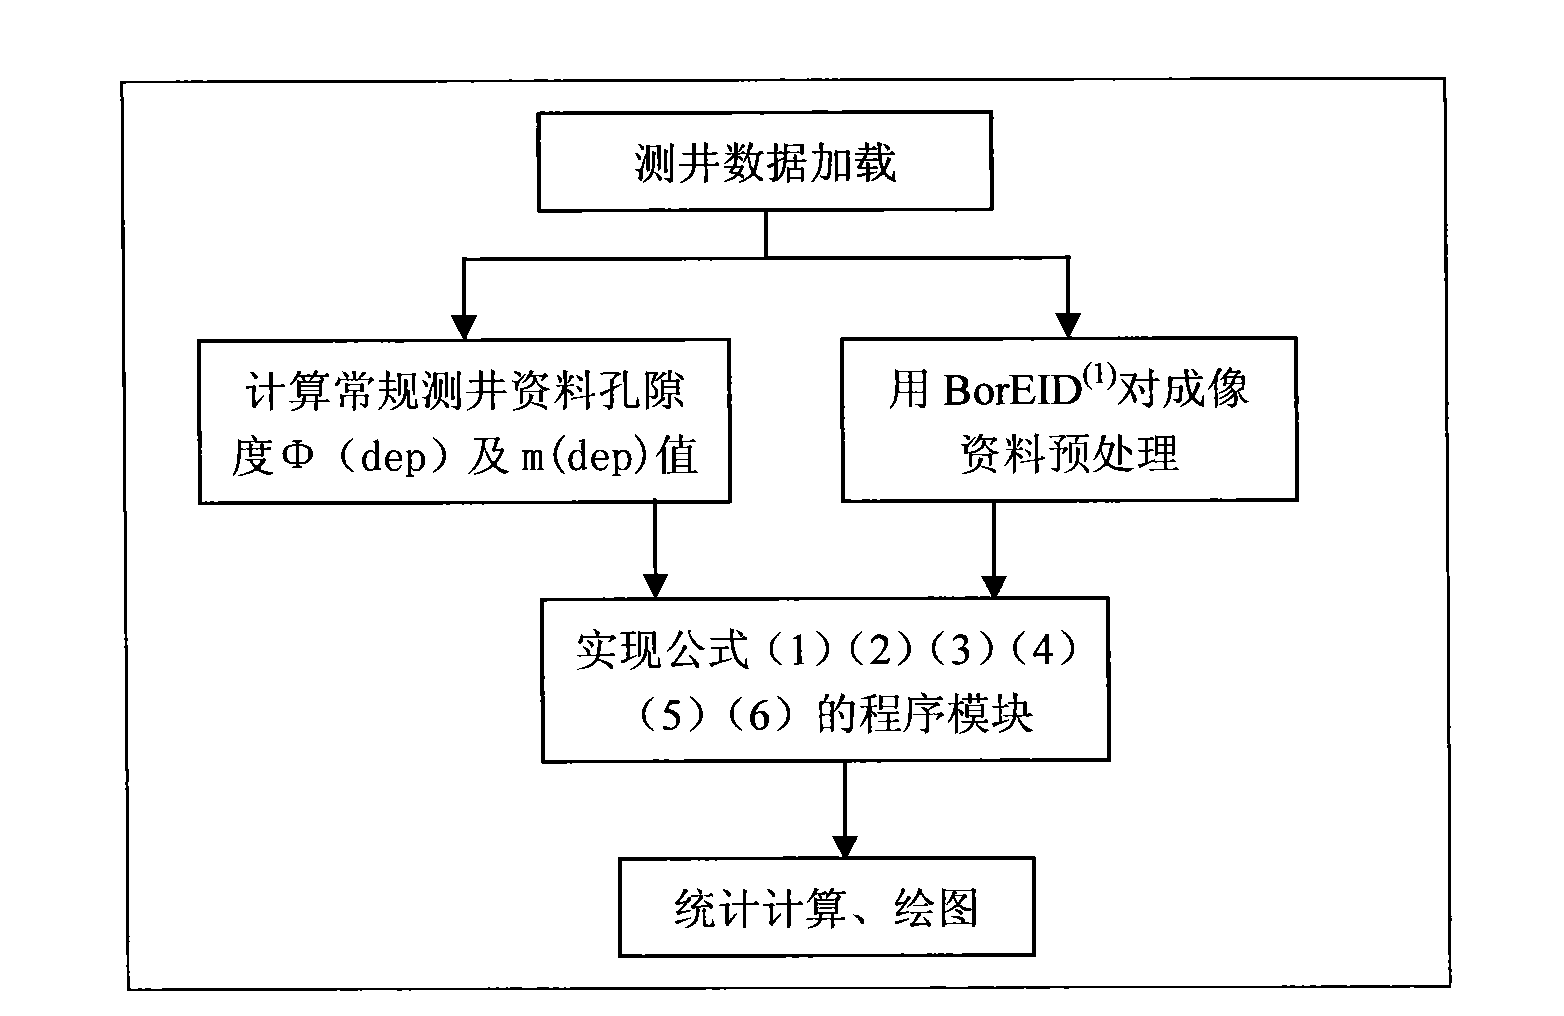
[0038] in Geoframe (1) Environment implementation steps are attached figure 2 shown.

[0039] 1) In Geoframe (1) Load conventional and imaging logging data into the software;

[0040] 2) Using the three-porosity model to calculate the porosity Φ(dep) and m(dep) values ​​of conventional logging data;

[0041] 3) Use Geoframe (1) BorEID in software (1) The module preprocesses the imaging data;

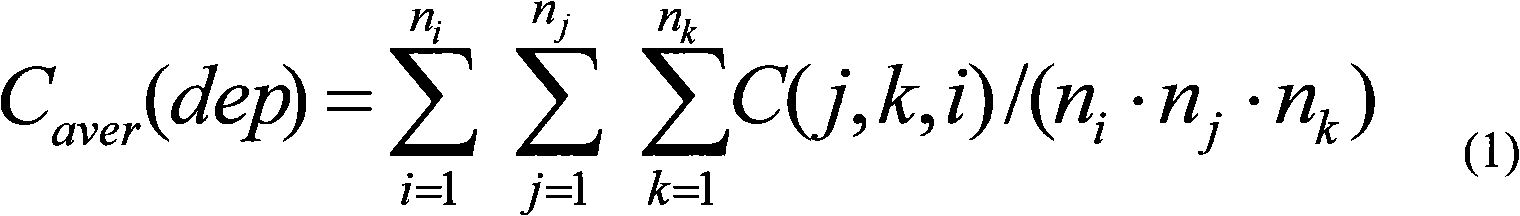
[0042] 4) Realize the formula (1)(2)(3)(4)(5) on the basis of the previous calculation and processing results

[0043] (6) program modules;

[0044] 5) Perform statistical calculation and drawing on the processing results depending on the formation water resistivity spectrum and parameters.

[0045] The way to realize the above step 4) is as follows.

[0046] I) FMI data processing, ...


PUM


Abstract

The invention relates to a method for calculating apparent formation water resistivity spectrum and parameters by applying electric imaging data of point-by-point calibration. The point-by-point calibration comprises the following steps: using a logging data editing tool to lead the electric imaging data to be consistent with the shallow resistivity depth; calculating the average current value of images of the electric imaging data; for each image frame, calculating a calibration coefficient by a conductivity value corresponding to the shallow resistivity value at the same depth point; carrying out calculation of the apparent formation water resistivity spectrum by applying the electric imaging data; according to the fact that the electric imaging of the shallow resistivity calibration is substantially a conductivity image of a well-wall flushed zone, defining the apparent formation water resistivity of one pixel point of the electric imaging data; calculating the apparent formation water resistivity spectrum parameters by applying the electric imaging data; introducing the average value to express the deviation degree of a main peak from a base line in the apparent formation water resistivity spectrum; using variance to express the width of the apparent formation water resistivity distribution spectrum; carrying out point-by-point calibration on the electric imaging data by applying shallow resistivity, calculating the apparent formation water resistivity spectrum of the electric imaging data, wherein the extracted average value and extracted variance of the apparent formation water resistivity spectrum have obvious application effect on evaluating the performance of reservoir fluid.

Description

technical field [0001] The invention relates to well logging technology for petroleum geological exploration and underground water exploration. In particular, it is a method for identifying fluid properties of carbonate reservoirs, igneous reservoirs and low-porosity fractured sandstone reservoirs based on electrical imaging logging data in petroleum logging measurements. Background technique [0002] The electrical imaging logging tool measures the micro-resistivity image information of the formation near the wellbore with depth through the measurement of the button electrode installed on the plate in the wellbore. The measured multiple curves reflect the change of the micro-conductivity of the formation. Because the electrical conductivity of different geological bodies near the borehole wall is different, the imaging logging data reflects geological phenomena such as bedding, fractures, and dissolved pores in the formation near the borehole wall in the form of images. Th...

Claims


Application Information

Patent Timeline
Patent Type & Authority Applications(China)
IPC IPC(8): G01V3/38G01V3/18
CPCY02A90/30
Inventor 肖承文刘瑞林杨海军李宁刘兴礼张承森吴兴能冯周信毅郭秀丽
Owner PETROCHINA CO LTD
Why Eureka
Try Eureka