A Contour Interpolation Method

A contour and interpolation technology, applied in special data processing applications, instruments, electrical digital data processing, etc., can solve the problem of no attribute information, contour lines can not be non-aliased seamless border clipping, slow speed, etc.

Inactive Publication Date: 2011-12-21
北京清流技术股份有限公司
View PDF2 Cites 17 Cited by
  • Summary
  • Abstract
  • Description
  • Claims
  • Application Information

AI Technical Summary

Problems solved by technology

[0005] 2. The generation of contour lines cannot be clipped without non-jaggy seamless borders or the speed is

Method used


Image

  • A Contour Interpolation Method
  • A Contour Interpolation Method
  • A Contour Interpolation Method

Examples


Embodiment 1

[0040] For example, for the contour map of annual precipitation, the interpolation area is the east-west cross hilly landform.

[0041] Use the existing grid method contour generation method to generate contour maps, the steps are as follows:

[0042] (1) Specify the contour area, which is a rectangular range [MinX, MinY], [MaxX, MaxY];

[0043] (2) Define the rectangular area as (m-1)×(n-1) grids, and the sequence numbers of each grid point are arranged as follows: horizontal j=1, 2, 3...n; vertical i=1 , 2, 3...m, the length of the horizontal side of each grid is Dx, and the length of the vertical side is Dy;

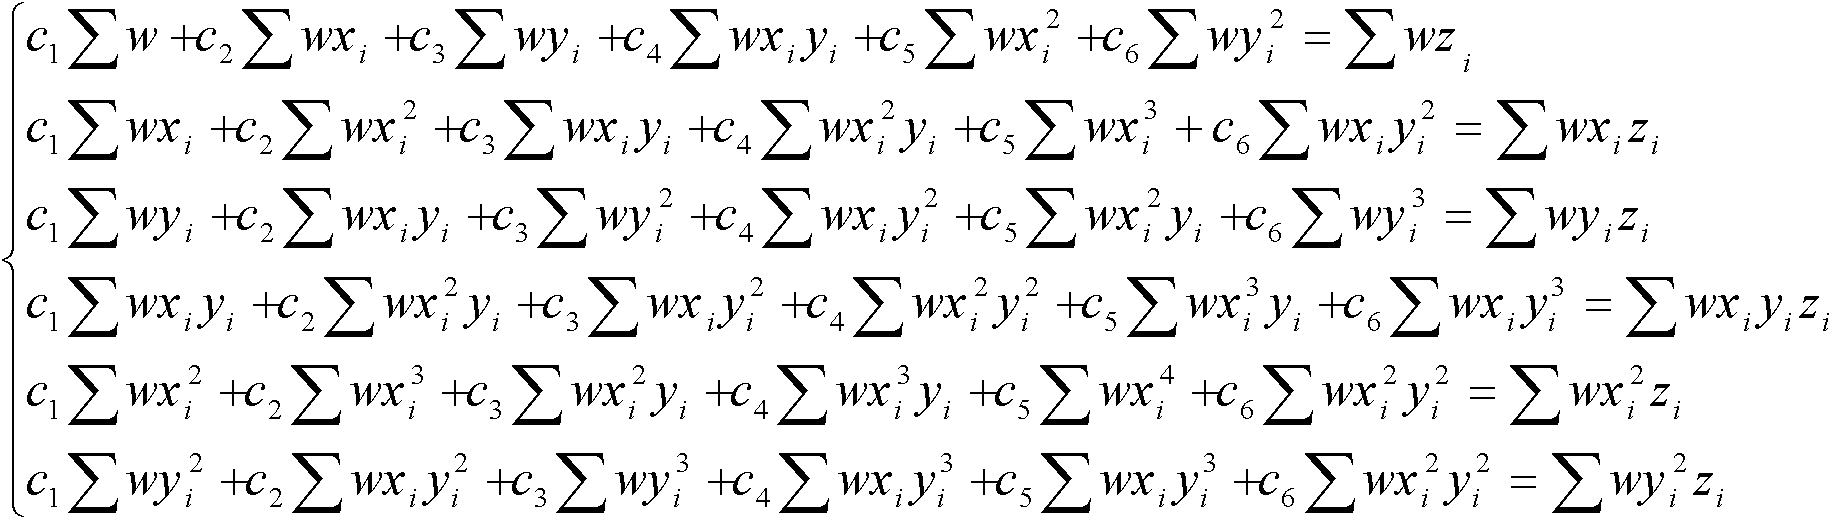
[0044] (3) Use the weighted quadratic polynomial algorithm to interpolate the value of each grid point;

[0045] (4) Find out each isovalue point and connect and generate the isovalue line in the rectangular area;

[0046] (5) Given the effective area polygon in the actual work, clip the contour line in the rectangular area, and finally obtain the contour map in th...

Embodiment 2

[0063] Interpolate the groundwater level isomap for a northeast-southwest-trending piedmont area. The interpolation method is the same as that in Example 1, but since the groundwater level usually has an obvious northwest-southeast trend, the direction correction coefficient can be set as:

[0064] 10 5 1

[0065] 5 10 5

[0066] 1 5 10

[0067] The value of the point to be interpolated F(a, b) is similarly obtained.


PUM


Abstract

The invention relates to a method for modifying the contour after changing the contour interpolation point in the contour picture, by obtaining the coordinates of n points in the plane point in the contour picture, and treating the interpolation point p(x, y) Perform hyperboloid interpolation. The method of the invention can effectively improve the interpolation error caused by the obvious trend of the data and the inconsistency of the spatial distribution of the data because the weight is quoted in the polynomial interpolation algorithm. The invention also relates to the establishment of a non-degenerate straight line method, and on this basis, a new algorithm for the relationship between points and polygons (points within polygons) is developed, and the algorithm is used in isoline boundary clipping to reduce computing time.

Description

technical field [0001] The invention relates to an interpolation method in the process of real-time generation of contour lines. Background technique [0002] Contour is derived from the contour line in surveying and cartography, and is a method of using a set of smooth curves to represent the gradual change of the quantitative characteristics of the cartographic phenomenon of continuous planar distribution. In the field of engineering applications, contour lines are widely used as the most intuitive tool to use a set of monitoring data to reflect the actual state of nature changes, such as rainfall range, temperature change, soil moisture change, pest distribution, etc. [0003] Currently available methods for contour analysis and drawing include various methods involved in Surfer, Matlab, and ArcGis software, or the methods disclosed in Chinese invention patent application CN 200710016657.7 and Chinese invention patent ZL 200510066109.6. In these methods, the contour calc...

Claims


Application Information

Patent Timeline
IPC IPC(8): G06F19/00
Inventor 薛伟焦中志翟彩霞
Owner 北京清流技术股份有限公司
Why Eureka
Try Eureka