Method for making omega event interval control chart for high quality process statistics control

A technology of event interval and production method, applied in the direction of adaptive control, general control system, control/regulation system, etc., can solve the problems of high probability of false alarm and inapplicability of traditional control charts, so as to reduce false alarm rate and improve practicality degree of effect

Inactive Publication Date: 2012-02-15
BEIHANG UNIV
View PDF6 Cites 18 Cited by
  • Summary
  • Abstract
  • Description
  • Claims
  • Application Information

AI Technical Summary

Problems solved by technology

[0004] (1) Purpose of the present invention: for the high probability of false alarms in the high-quality monitoring process, the problem that the traditional control chart is not applicable, the present invention provides a new control chart-a high-quality process statistical control Ω event How to make an interval control chart

Method used


Image

  • Method for making omega event interval control chart for high quality process statistics control
  • Method for making omega event interval control chart for high quality process statistics control
  • Method for making omega event interval control chart for high quality process statistics control

Examples


Embodiment Construction

[0048] The present invention will be further described in detail below with reference to the drawings and examples.

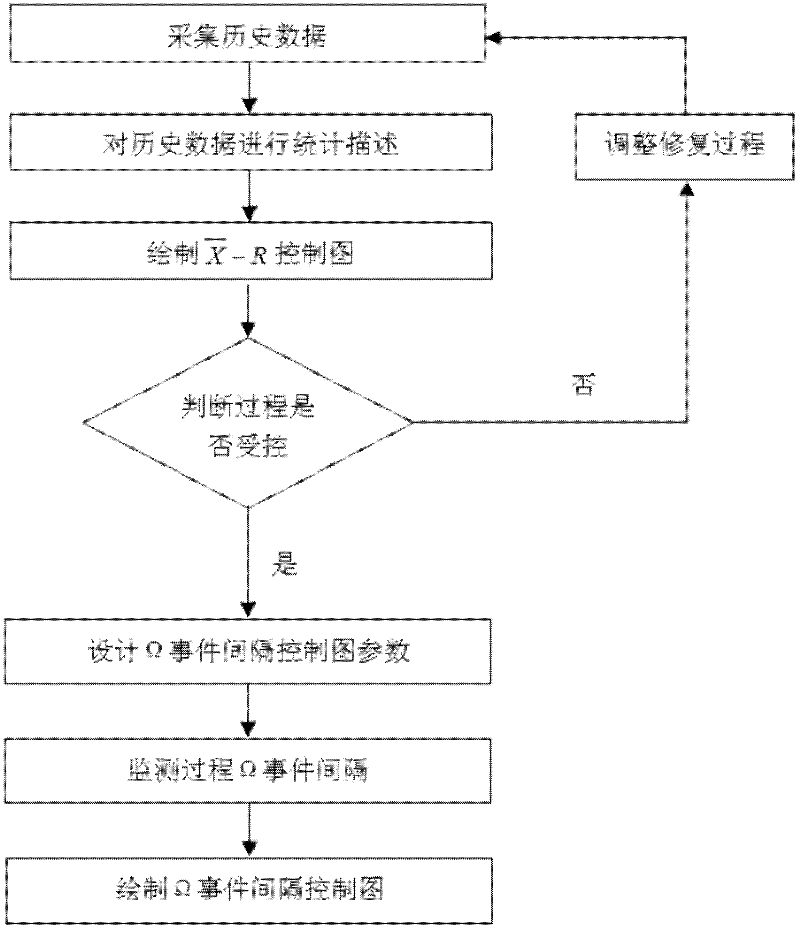
[0049] The Ω event interval control chart in the following example is based on figure 1 The production process shown below will be described in detail:

[0050] The method for making a high-quality process statistical control Ω event interval control chart of the present invention has the following steps:

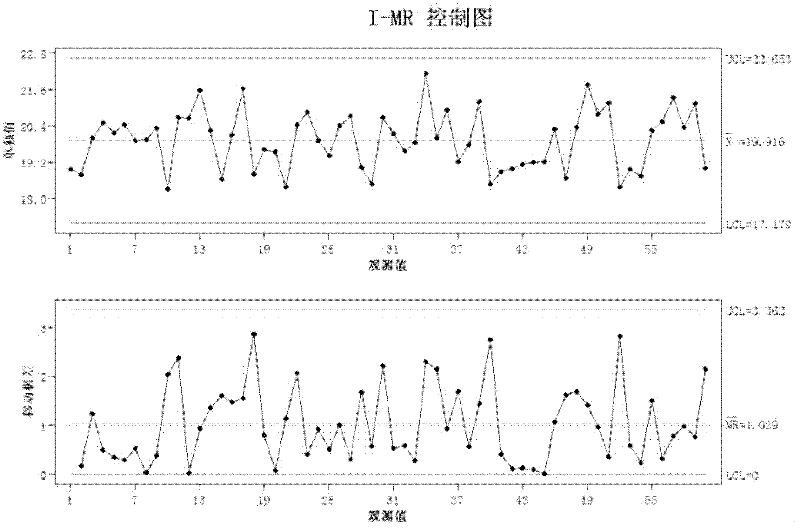
[0051] Step 1 Collect historical data. Usually, you can query past quality records. The amount of data collected is usually between 20-70. For example, 60 historical time series data of a certain quality characteristic are collected as shown in Table 1 below:

[0052] Table 1 instance data

[0053] 18.938 18.761 19.998 20.501 20.155 20.439 19.910 19.946 20.331 18.285 20.662 20.636 21.573 20.223 18.622 20.097 21.654 18.786 19.592 19.515 18.366 20.433 20.839 19.918 19.396 20.401 20.712 19.024 18.448 20.663 20.138 19.554 19.832 2...


PUM


Abstract

The invention discloses a method for making an omega event interval control chart for high quality process statistics control. In the method, a production process is supposed to be complied with normal distribution, and the production process and the normal distribution are independent; as a high quality process is sensitive to a false alarm rate, a time interval of an omega event is monitored in order to reduce the false alarm rate; and if the time interval is abnormal, the process is abnormal and is out of control. The method specifically comprises the following steps of: 1, acquiring historical data; 2, performing statistical description on the historical data; 3, designing parameters of the omega event interval control chart; 4, monitoring the process by using the omega event interval control chart; 5, judging whether the process is really out of control; and 6, analyzing a reason why the process is out of control, and adjusting and repairing the process to make the process reenter a controlled state. By the method, the problems of high false alarm rate of the conventional control chart in high quality process monitoring application and the like can be solved; furthermore, the method has high reference value for process alarm diagnosis and has a wide application prospect in the technical field of statistical process control technologies.

Description

Technical field [0001] The invention provides a method for making an Ω event interval control chart for high-quality process statistical control, which belongs to the technical field of statistical process control. Background technique [0002] Statistical process control is one of the most popular and effective quality improvement methods today. Statistical process control technology mainly refers to the use of Shewhart’s process control theory, control chart, to monitor the quality characteristics of products at various stages (procedures) in the production process. According to the distribution of points on the control chart, analyze the trend of quality characteristics and adopt Preventive measures to ensure that the production process is always under statistical control, so as to achieve the purpose of improvement and quality assurance. [0003] In the high-quality production process, the possibility of process abnormalities is very low, making traditional control charts unsu...

Claims


Application Information

Patent Timeline
Patent Type & Authority Applications(China)
IPC IPC(8): G05B13/04
Inventor 何益海米凯武春晖
Owner BEIHANG UNIV
Why Eureka
Try Eureka