Three layer color visualization method of hyperspectral remote sensing image

A hyperspectral remote sensing and hyperspectral image technology, applied in the field of three-layer color visualization of hyperspectral remote sensing images, can solve the problems of loss of spatial information, inability to highlight objects of interest, confusion of pie layers, etc. Feature independence and visual intuitiveness, avoiding cluttered effects

Inactive Publication Date: 2012-04-11
HARBIN ENG UNIV
View PDF2 Cites 9 Cited by
  • Summary
  • Abstract
  • Description
  • Claims
  • Application Information

AI Technical Summary

Problems solved by technology

However, these five layers of images are all displayed using the linear interpretation results of the spectrum, not only the spatial information is lo

Method used

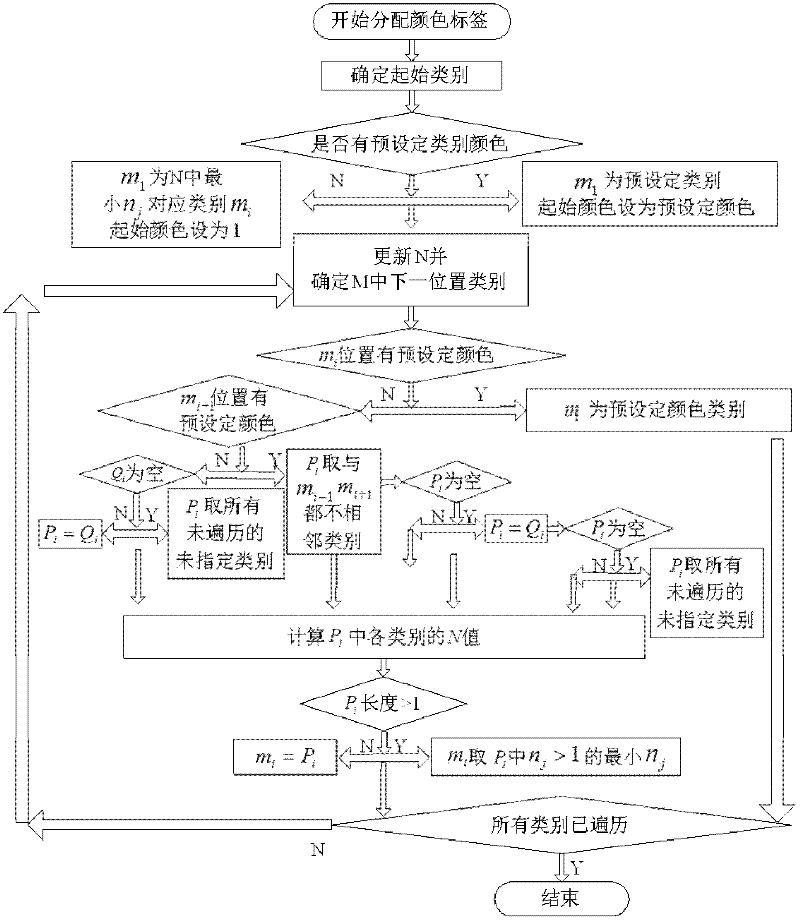
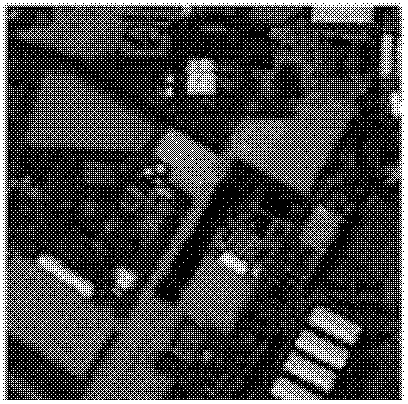
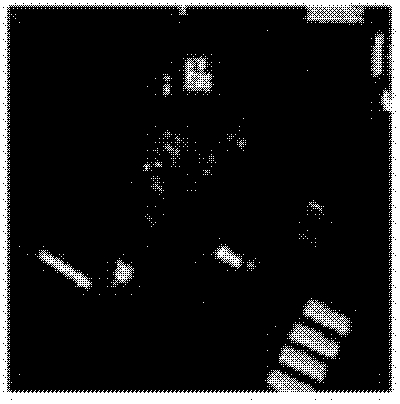

Image

  • Three layer color visualization method of hyperspectral remote sensing image
  • Three layer color visualization method of hyperspectral remote sensing image
  • Three layer color visualization method of hyperspectral remote sensing image

Examples


Example Embodiment

[0036] The present invention is a novel multi-layer visualization method for hyperspectral remote sensing images. The detailed implementation of the present invention is given below:

[0037] 1) The color visualization method of spatial information

[0038] The bilateral filtering described in step 2 fuse each level of fusion image I F Calculated as follows:

[0039]

[0040] In the above formula, I(x, y, λ 1 ) To I(x, y, λ M ) Is represented as a subset of the hyperspectral image cube with M bands. I BF For bilateral filtered images: among them

[0041] The hierarchical fusion method is as follows: For hyperspectral data with dimension (XλYλN), the number of bands is N. At the first level, divide the data into equal parts A continuous subset, whose dimension of the subset is (XλYλM), uses bilateral filtering to fuse each subset, and finally generates P different images. These P images are used as the input images of the next stage, and the (XλYλP)-dimensional data is merged...


PUM


Abstract

The invention provides a three layer color visualization method of a hyperspectral remote sensing image. The method is characterized by: firstly, using a full-wave band image to blend and realize a three-channel space information color visualization image with a high spatial resolution; simultaneously based on a spatial correlated pie chart matrix layer, using a spectrum unmixing result and a display splinter texture layer to display local and concrete spectrum information; finally, using a combination form of three layers: a space information layer, the display splinter texture layer and thepie chart matrix layer to express the hyperspectral image. The image generated by using the method possesses good characteristic independence and visual intuition. Confusion of color expression can be avoided. By using the method, a plurality of types can be simultaneously or individually displayed and a target object can be highlighted so as to satisfy different observation needs.

Description

technical field [0001] The invention relates to a hyperspectral image visualization method, in particular to a three-layer color image display method that fully utilizes hyperspectral data information sources. Background technique [0002] Hyperspectral data not only contains rich spatial information but also rich spectral information. In the traditional hyperspectral image visualization method, for the original hyperspectral data, the image cube is used to express the whole hyperspectral data, the spectral curve is used to express its two-dimensional spectral information, the spectral surface is used to express its three-dimensional spectral information, and the grayscale An image is used to represent a certain band or a certain type of feature information. However, the increase in the number of bands will inevitably lead to the redundancy of information and the increase in the complexity of data processing, which is not conducive to visual expression. [0003] The three-...

Claims


Application Information

Patent Timeline
IPC IPC(8): G06T7/00
Inventor 王立国刘丹凤王群明
Owner HARBIN ENG UNIV
Why Eureka
Try Eureka