

Markov chain based method for accurately forecasting power system loads
An accurate forecasting and power system technology, applied in forecasting, instrumentation, data processing applications, etc., and can solve problems such as troublesome computing, long time, and large sampling volume.
- Summary
- Abstract
- Description
- Claims
- Application Information
AI Technical Summary
Problems solved by technology
Method used
Image

Examples
Embodiment 1
[0031] Now it is necessary to predict the load data L at time t t , predict L t The premise is that the forecast data L at time t-1 has been obtained t-1 , according to the Markov property to predict the data L t only with L t-1 relevant.
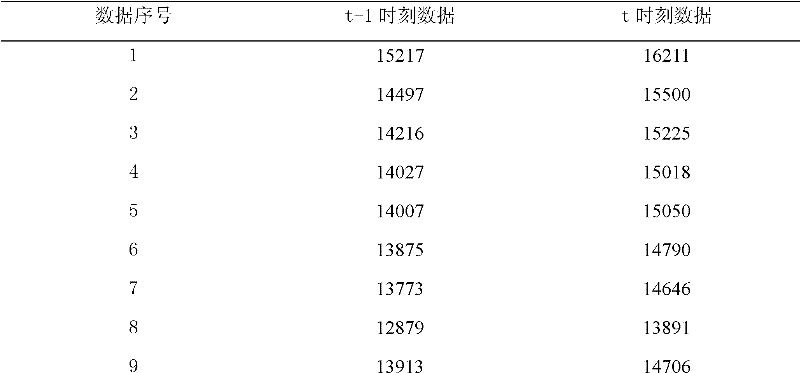
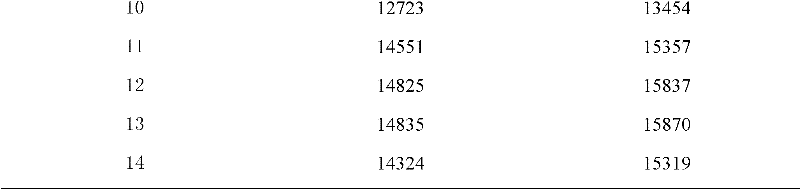
[0032] In the first step, 14 sets of historical load data are taken, and each set has one data at time t-1 and one at time t, as shown in Table 1 below:
[0033] Table 1
[0034]
[0035]
[0036] Assuming the first group of data as the data to be predicted, it can be known that L t-1 =15217, what needs to be predicted is L t , that is, the first group of data at time t.
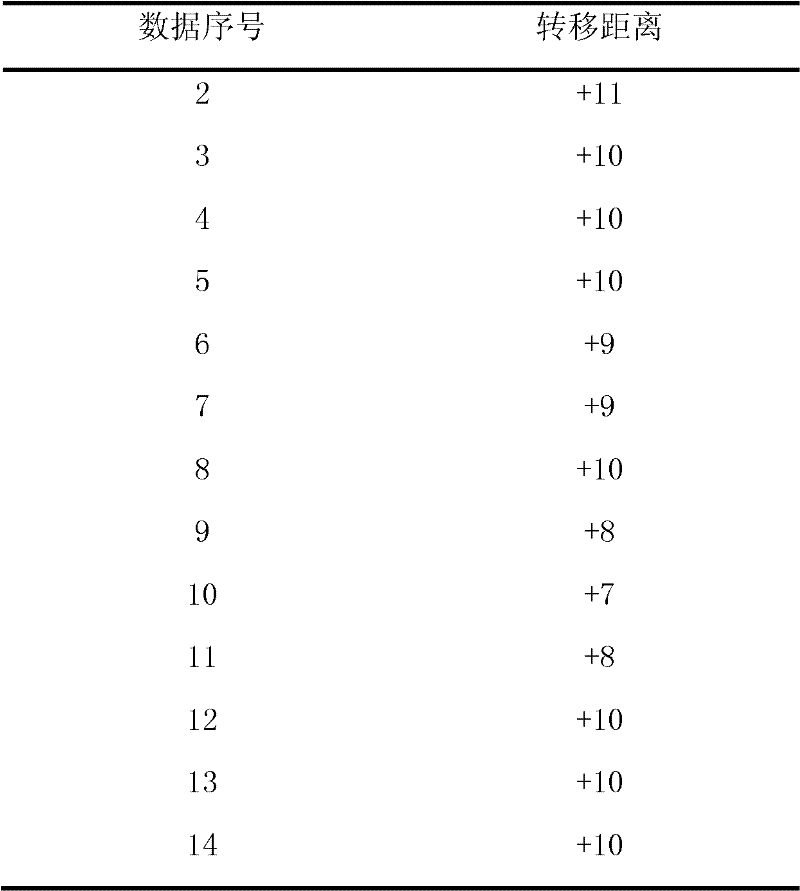
[0037] The second step is to set the state set E={1, 2, . . . , N}. Among them, state 1 indicates that the load is a value between 0 and 100, and state 2 indicates that the load is a value between 100 and 200. From the nature of the state matrix, it can be known that the historical data and the data to be predicted can be mapped to the values in the state ...
Embodiment 2
[0047] Now it is necessary to predict the load data L at time t t , predict L t The premise is that the forecast data L at time t-1 has been obtained t-1 , according to the Markov property to predict the data L t only with L t-1 relevant.
[0048] In the first step, 14 sets of historical load data are taken, and each set has one data at time t-1 and one at time t, as shown in Table 1 below:
[0049] table 3
[0050]
[0051]
[0052] Assuming the first group of data as the data to be predicted, it can be known that L t-1 =16226, what needs to be predicted is L t , that is, the first group of data at time t.
[0053] The second step is to set the state set E={1, 2, . . . , N}. Among them, state 1 indicates that the load is a value between 0 and 100, and state 2 indicates that the load is a value between 100 and 200. From the nature of the state matrix, it can be known that the historical data and the data to be predicted can be mapped to the values in the state ...
Embodiment 3
[0063] Now it is necessary to predict the load data L at time t t , predict L t The premise is that the forecast data L at time t-1 has been obtained t-1 , according to the Markov property to predict the data L t only with L t-1 relevant.
[0064] In the first step, 14 sets of historical load data are taken, and each set has one data at time t-1 and one at time t, as shown in Table 1 below:
[0065] table 5
[0066]
[0067] Assuming the first group of data as the data to be predicted, it can be known that L t-1 =14125, what needs to be predicted is L t , that is, the first group of data at time t.
[0068] The second step is to set the state set E={1, 2, . . . , N}. Among them, state 1 indicates that the load is a value between 0 and 100, and state 2 indicates that the load is a value between 100 and 200. From the nature of the state matrix, it can be known that the historical data and the data to be predicted can be mapped to the values in the state set. a stat...
PUM
 Abstract
Description
Claims
Application Information