Two-dimensional computable target detection, recognition and identification performance predicting method
A target detection and performance prediction technology, applied in the field of target recognition, can solve the problems of randomness, subjectivity, intelligence, flexibility and knowledge that are difficult to quantify, single parameter, etc., and achieve the effect of strong operability
- Summary
- Abstract
- Description
- Claims
- Application Information
AI Technical Summary
Problems solved by technology
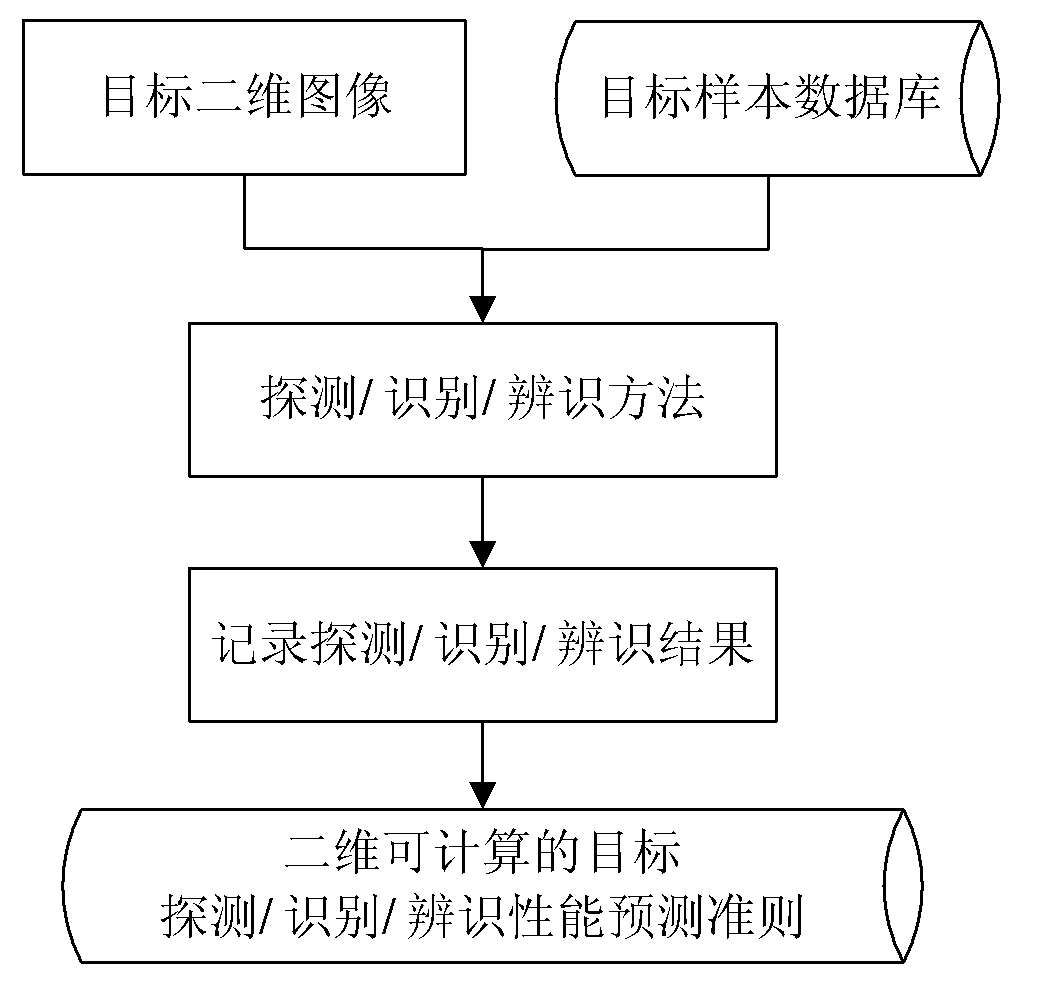
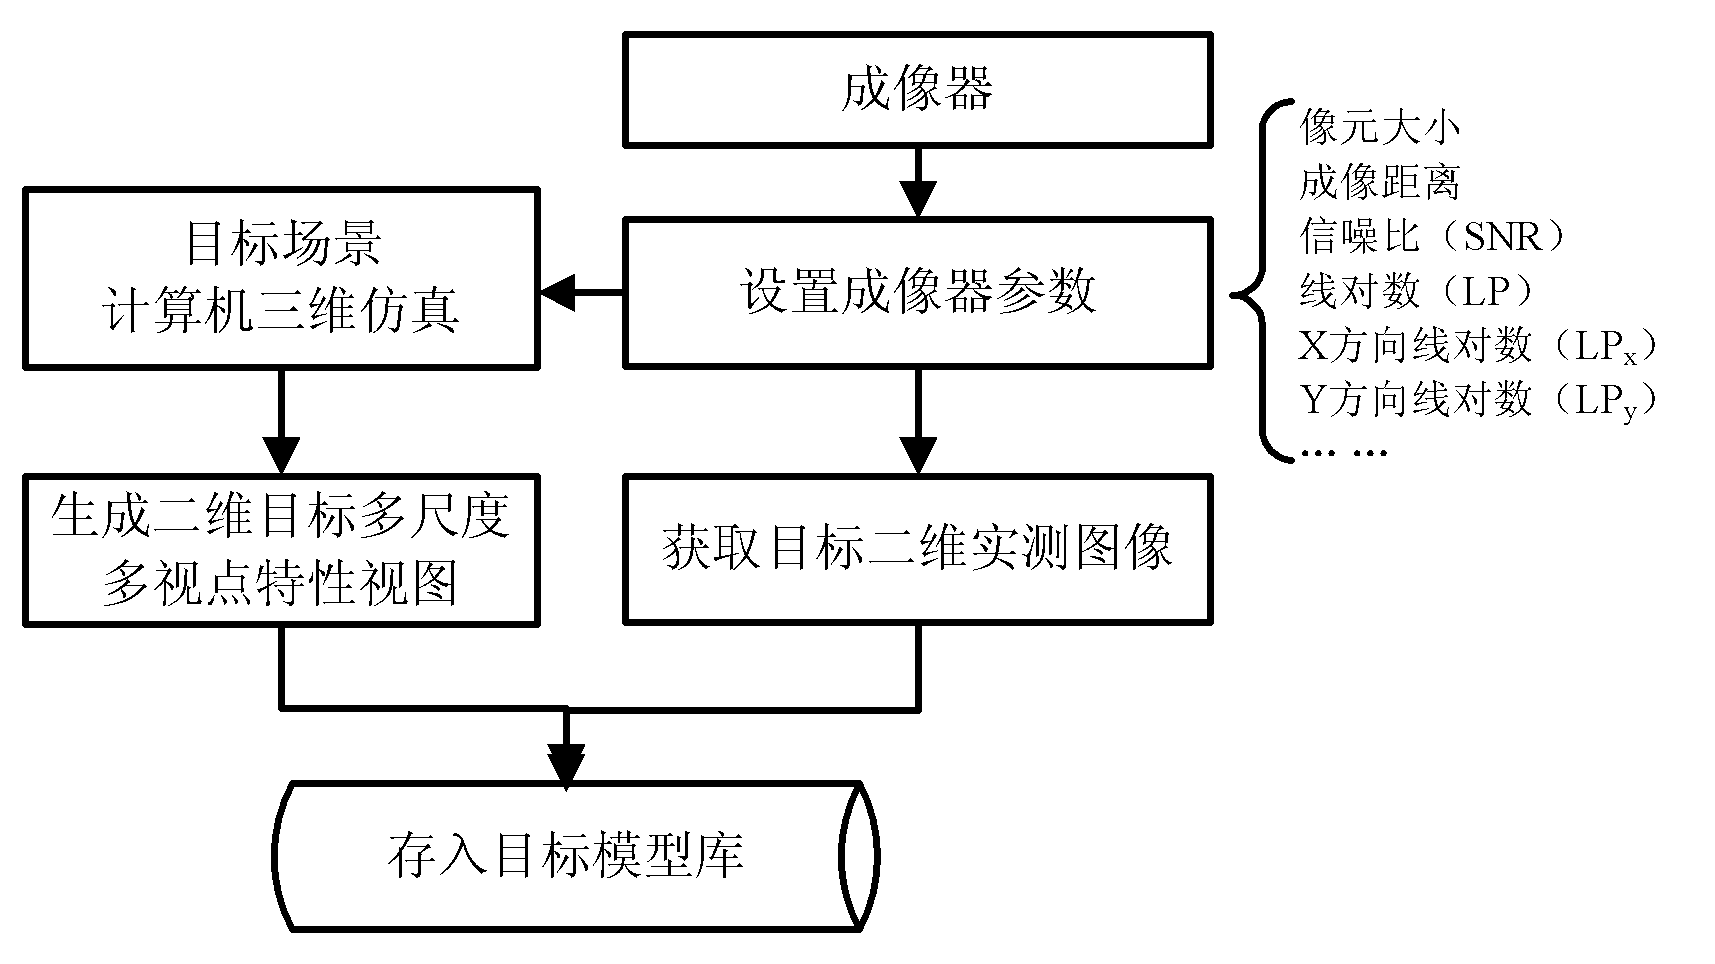
Method used
Image

Examples
example 1
[0074] Detection example 1: SNR=5, imaging distance is a variable
[0075] Obtain the two-dimensional measured image or two-dimensional simulated image of the rotor helicopter 500D under the condition of signal-to-noise ratio SNR=5 from the target sample database, and then use the multi-stage filtering and binary segmentation method to detect the target in turn on the obtained image, Then the target detection results are analyzed to obtain the detection probability of the target two-dimensional image under different imaging distance conditions.
[0076] In this example, the exponential form is used to perform two-dimensional curve fitting on the detection results, such as Figure 7 As shown, the specific expression form of the exponential fitting curve function of f(X) is given in the figure, in this example b 3 =0,b 2 =0,b 1 =1.778,b 0 =-0.0008503,
[0077] That is, f(X)=1.778*exp(-0.0008503*X). It can be seen from the figure that under the condition of SNR=5, the detec...
example 2
[0078] Detection example 2: SNR=100, imaging distance is a variable
[0079] Obtain the two-dimensional measured image or two-dimensional simulation image of the rotor helicopter 500D under the condition of signal-to-noise ratio SNR=100 from the target sample database, and then use the multi-stage filtering and binary segmentation method to detect the target in sequence. Then the target detection results are analyzed to obtain the detection probability of the target two-dimensional image under different imaging distance conditions.
[0080] In this example, the 4th-order polynomial form is used to perform two-dimensional curve fitting on the detection results, such as Figure 8 As shown, the specific expression form of the 4th order polynomial fitting curve function of f(X) is given in the figure, in this example a 4 =0,a 3 =0,a 2 =0,a 1 =0.00028,a 0 =0.90211, that is, f(X)=0.00028×X+0.90211. It can be seen from the figure that under the condition of SNR=100, the detecti...
example 3
[0082] Detection example 3: Signal-to-noise ratio SNR=5, the number of line pairs is a variable
[0083] Obtain the two-dimensional measured image or two-dimensional simulated image of the fixed-wing aircraft F117 under the condition of signal-to-noise ratio SNR=5 from the target sample database. The detection probability of the two-dimensional image of the target under different logarithm conditions is obtained by analyzing the target detection results.
[0084] In this example, a 5th-order polynomial is used to fit the two-dimensional curve to the detection results, such as Figure 9 As shown, the specific expression form of the 5th order polynomial fitting curve function of f(X) is given in the figure, in this example
[0085] a 5 =0,a 4 =0,a 3 =0,a 2 =-0.0008,a 1 =0.0015,a 0 =0.2839, namely f(X)=-0.0008×X 2 +0.0015×X 1 +0.2839. It can be seen from the figure that under the condition of SNR=5, the detection probability of the target sample can be obtained under di...
PUM
 Abstract
Description
Claims
Application Information
 - R&D
- Intellectual Property
- Life Sciences
- Materials
- Tech Scout
- Unparalleled Data Quality
- Higher Quality Content
- 60% Fewer Hallucinations
Browse by: Latest US Patents, China's latest patents, Technical Efficacy Thesaurus, Application Domain, Technology Topic, Popular Technical Reports.
© 2025 PatSnap. All rights reserved.Legal|Privacy policy|Modern Slavery Act Transparency Statement|Sitemap|About US| Contact US: help@patsnap.com