Method and device for measuring lateral magnification of optical system
A technology of lateral magnification and optical system, applied in the field of metrology equipment, can solve the problem of low repeatability of lateral magnification measurement, achieve the effect of improving the repeatability of measurement results, reducing errors, and improving repeatability
- Summary
- Abstract
- Description
- Claims
- Application Information
AI Technical Summary
Problems solved by technology
Method used
Image

Examples
Embodiment Construction
[0052] The specific embodiments of the present invention will be further described in detail below in conjunction with the accompanying drawings.
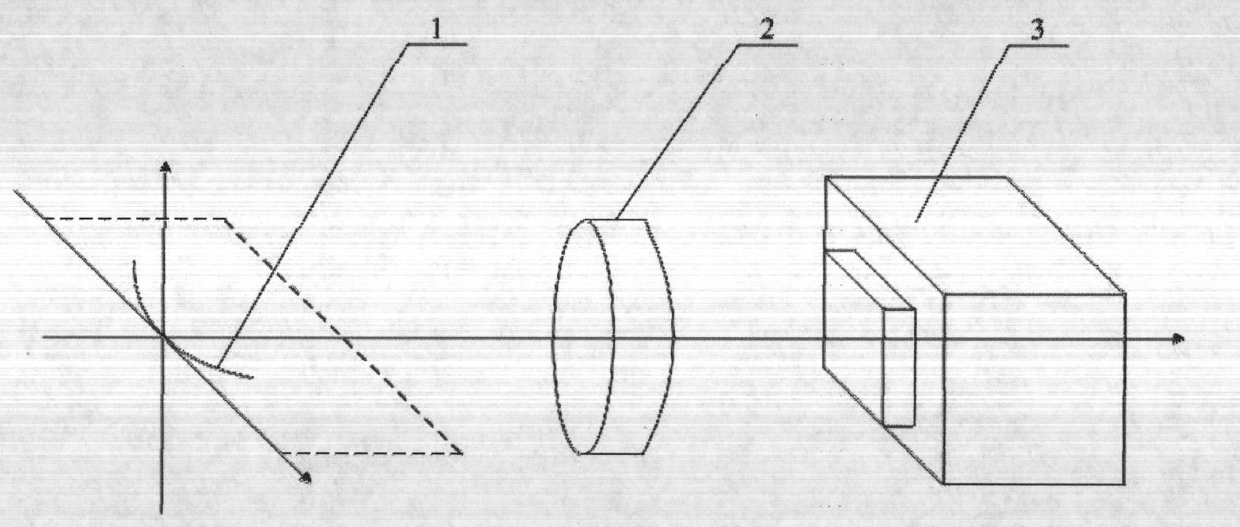
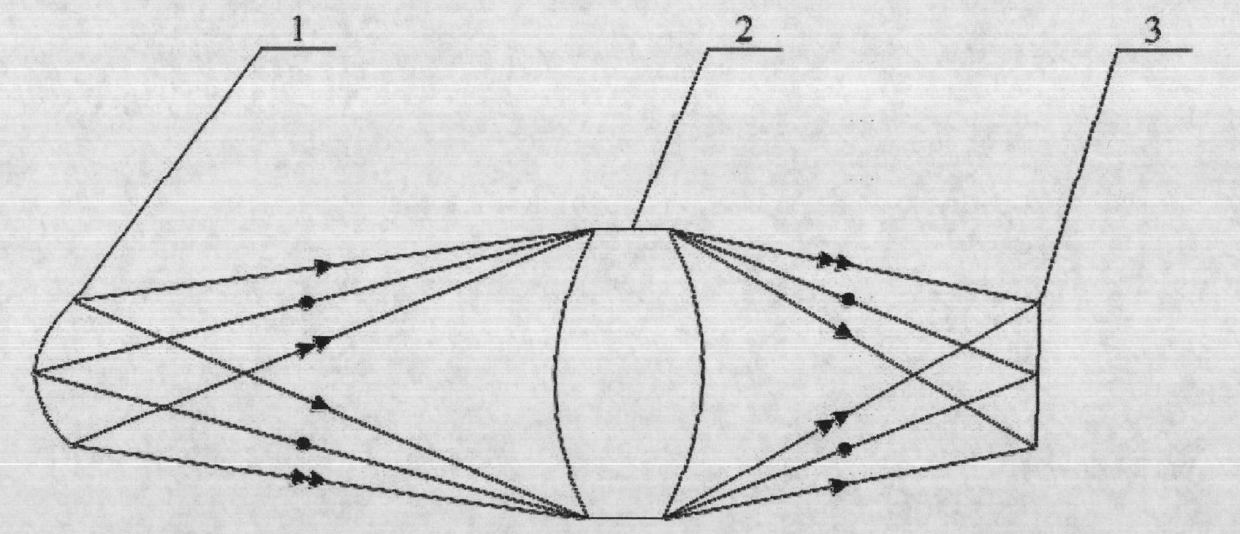
[0053] figure 1 It is a schematic structural diagram of an optical system lateral magnification measurement device using a line light source, and its planar light path diagram is as follows figure 2 As shown; the device includes a line light source 1, an optical system 2, and an image sensor 3, and the line light source 1 is imaged to the surface of the image sensor 3 through the optical system 2, and, in the direction of the optical axis of the device and the row direction of the image sensor 3 In a determined plane, the line light source 1 is curved, and any position on the line light source 1 is quasi-focused and imaged on the surface of the image sensor 3; wherein, the lateral length of the line light source 1 is 3 mm, and the pixel pitch of the image sensor 3 is 5.6 μm.
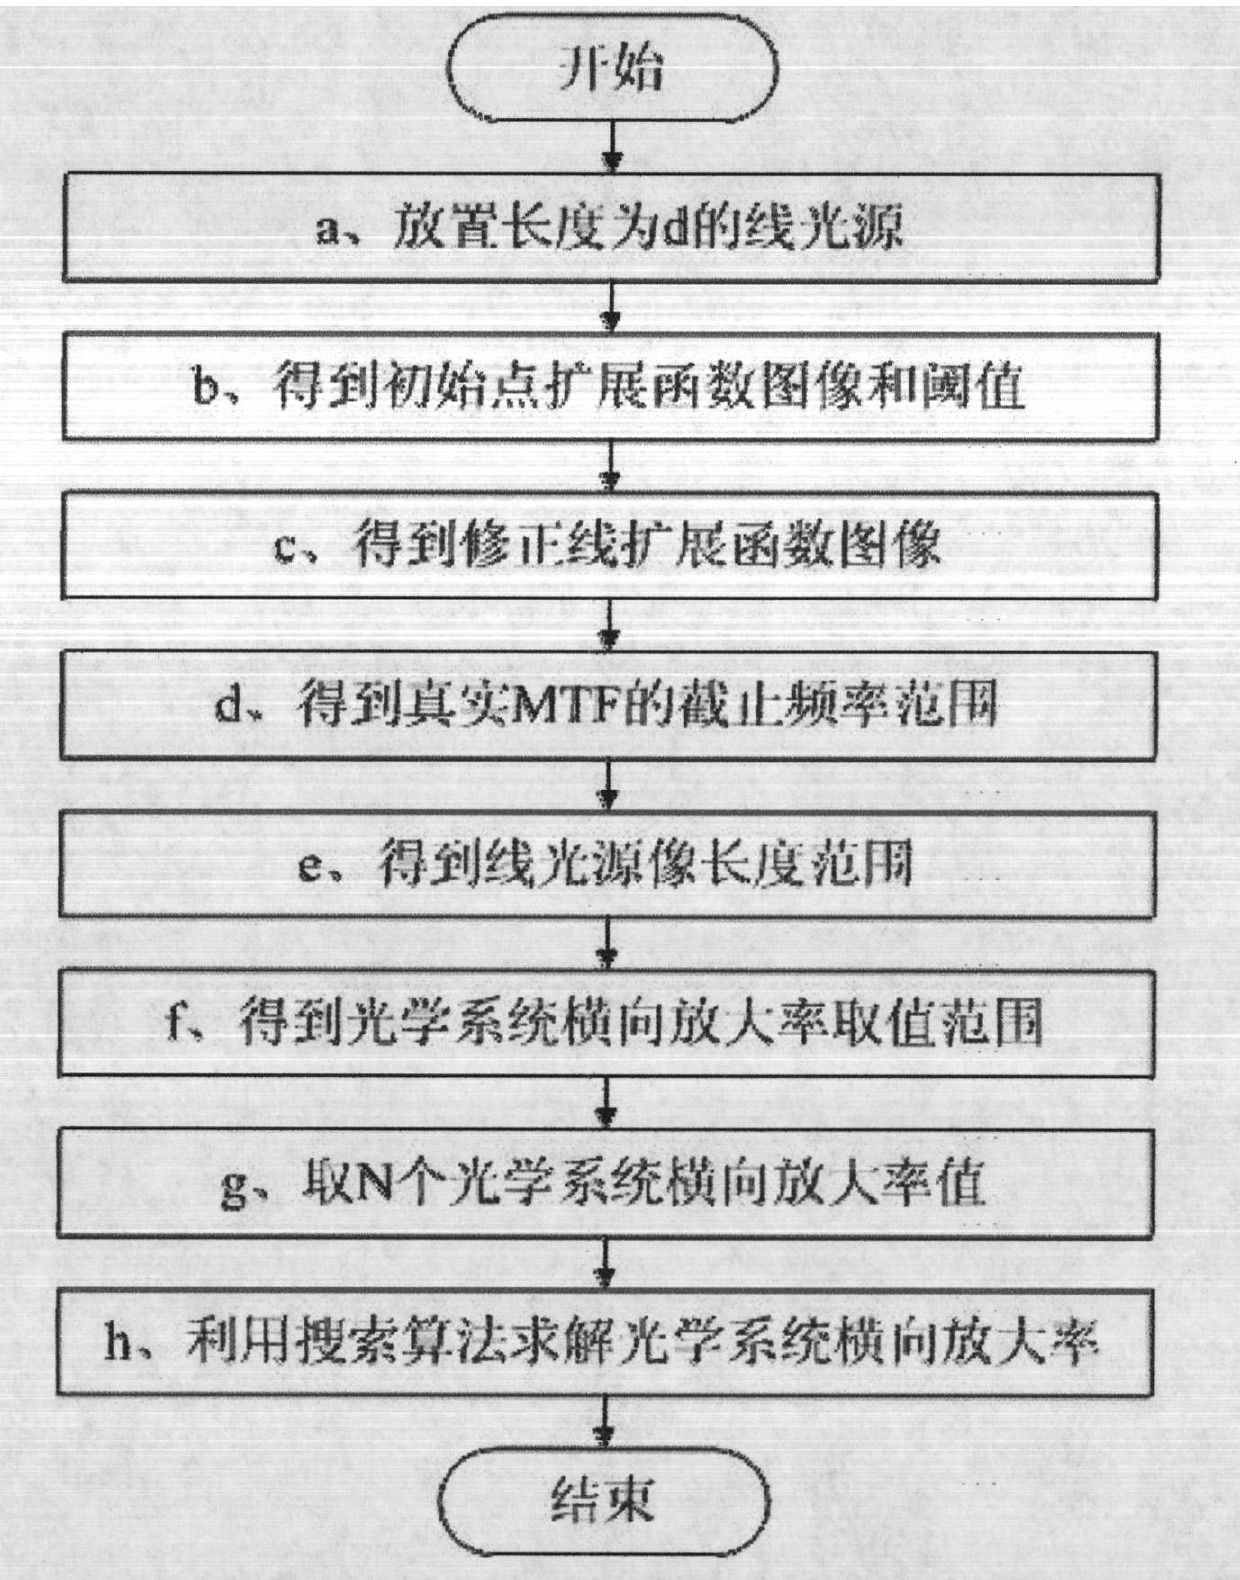
[0054] A method for measuring the lateral magnificat...
PUM
 Abstract
Description
Claims
Application Information