Determination method of probability density of sunshine temperature difference acquisition sample

A technology for collecting samples and measuring methods, which is applied in the direction of thermometers that give differences, and can solve problems such as poor feasibility, poor applicability, and non-uniqueness and accuracy of distribution parameters.

Inactive Publication Date: 2013-04-17
SOUTHEAST UNIV
View PDF5 Cites 6 Cited by
  • Summary
  • Abstract
  • Description
  • Claims
  • Application Information

AI Technical Summary

Problems solved by technology

[0003] At present, there are several methods for the determination of the probability density parameters of samples collected by sunshine temperature difference in various disciplines: ① hypothesis testing and parameter analysis method: this method needs to assume in advance that the probability density of collected samples obeys a certain distribution, and determines the distribution through samples. parameters, and finally use the test method to verify the distribution. This method requires a certain empirical basis and is less feasible; ②Probability density histogram method: This method first establishes the probability density histogram of the collected samples, and performs curve fitting on the histogram , and finally use the test method to determine the distribution parameters closest to the fitting curve. This method will result in different shapes of probability density histograms due to different temperature interval divisions, making the distribution parameters not unique and accurate; ③ Probability and statistics toolbox method : This method directly imports the collected samples into the probability and statistics toolbox, uses the distribution function in the toolbox to analyze the collected samples one by one, and finds the best distribution parameters. This method is limited by the distribution function in the probability and statistics toolbox. Applicability is not strong

Method used


Image

  • Determination method of probability density of sunshine temperature difference acquisition sample
  • Determination method of probability density of sunshine temperature difference acquisition sample
  • Determination method of probability density of sunshine temperature difference acquisition sample

Examples


Embodiment

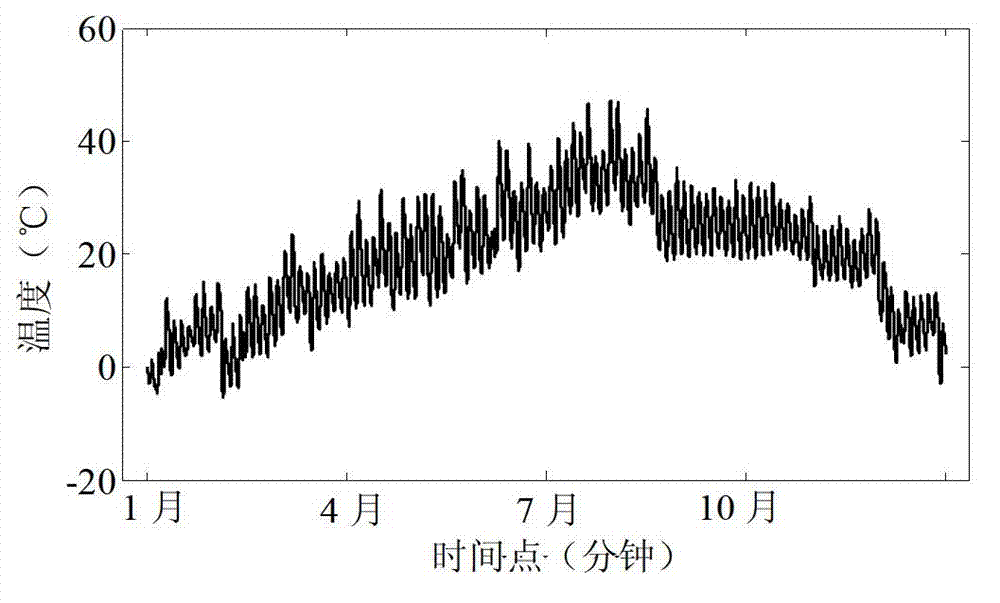
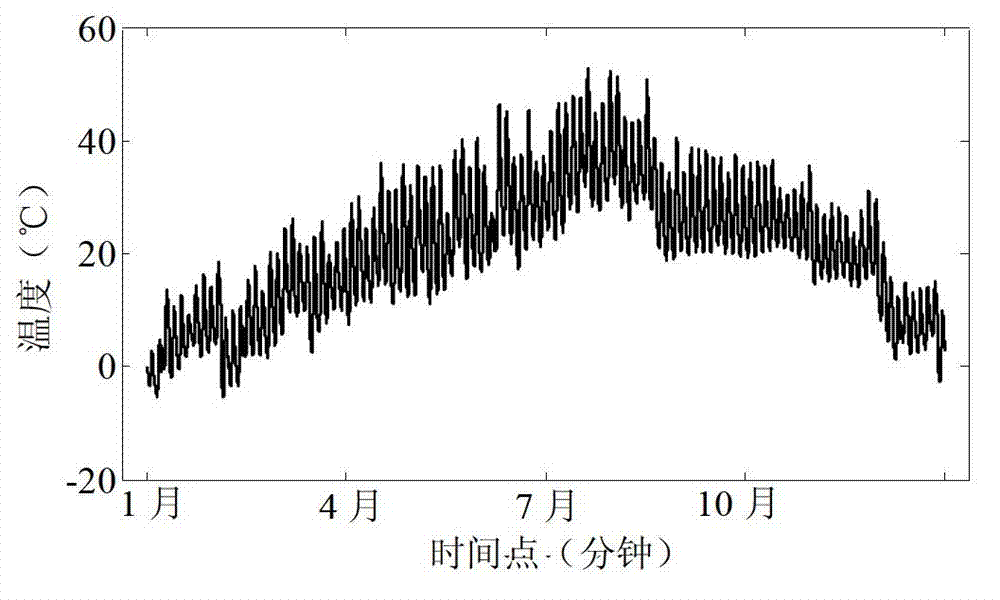
[0082] The following takes the sunlight temperature collection result of the steel bridge slab of the north branch cable-stayed bridge of Jiangsu Runyang Bridge as an example to illustrate the specific implementation process of the present invention.

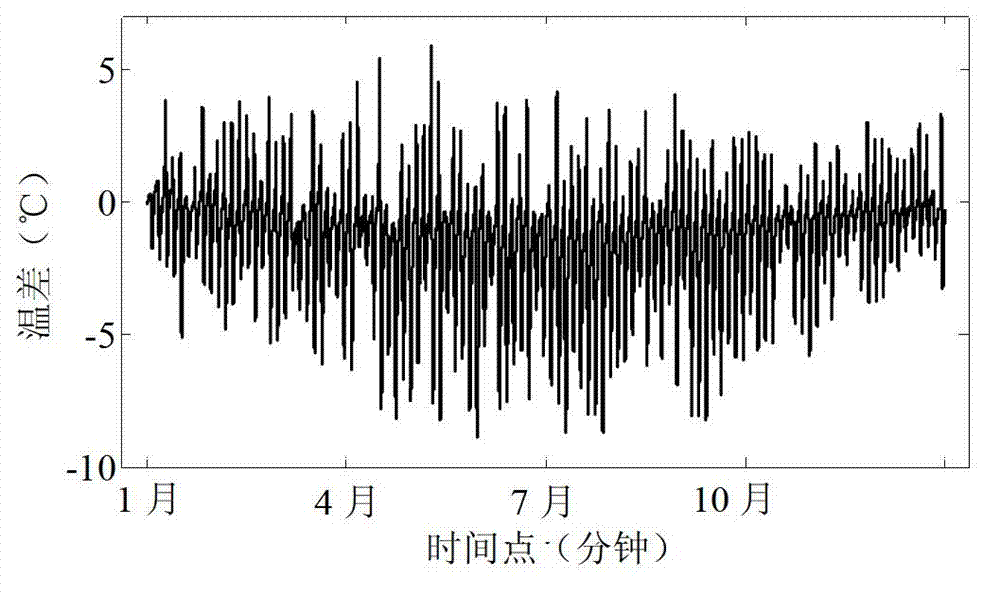
[0083] Use two temperature sensors to obtain the sunlight temperature collection sample T at two measuring points of the steel bridge deck 1 , T 2 The change trend in 2006, such as figure 1 with figure 2 Shown. in figure 1 with figure 2 In, the ordinate represents temperature, the unit is °C, the abscissa represents the time point, the unit: minutes. In other words, the temperature sensor collects a temperature value every minute. Subtract the temperature values ​​of the two sunlight temperature collection samples at the same time to obtain the sunlight temperature difference collection sample T 12 ,Such as image 3 Shown. in image 3 In the middle, the ordinate represents the temperature difference between the two measuring poi...


PUM


Abstract

The invention discloses a determination method of probability density of a sunshine temperature difference acquisition sample. The determination method comprises the following steps of 10: determining a sunshine temperature difference acquisition sample; 20: determining a positive temperature difference acquisition sample and a negative temperature difference acquisition sample; 30: determining the cumulative probability value corresponding to each temperature difference value in the positive temperature difference acquisition sample and the negative temperature difference acquisition sample; 40: fitting the cumulative distribution of the positive temperature difference sample; 50: fitting the cumulative distribution of the negative temperature difference sample; 60: determining the probability density parameter of the positive temperature difference sample; 70: determining the probability density parameter of the negative temperature difference sample; and 80: determining the probability density of the sunshine temperature difference acquisition sample. The probability density of the sunshine temperature difference acquisition sample can be accurately determined by the determination method.

Description

Technical field [0001] The present invention relates to a method for measuring the parameters of samples collected by the solar temperature difference, in particular to a method for measuring the probability density of samples collected by the solar temperature difference. Background technique [0002] Sunshine temperature difference is one of the important climatic and environmental factors. The probability and statistics characteristics of the collected samples are involved in research in important fields such as agricultural science, biological science, environmental science, and construction science in my country. The probability and statistics characteristics of the collected samples are in Probability density is commonly used in various disciplines [1-5] For example, Xiao Jianzhuang and others used the maximum daily temperature difference from June to August each year from 1973 to 2002 from the Shanghai Meteorological Archives as a sample to establish a probability density hi...

Claims


Application Information

Patent Timeline
Patent Type & Authority Applications(China)
IPC IPC(8): G01K3/10
Inventor 王高新丁幼亮宋永生
Owner SOUTHEAST UNIV
Why Eureka
Try Eureka