Visual display method for power distribution network

A technology of distribution network and distribution network, applied in the direction of closed-circuit television system, electrical components, transmission system, etc., can solve the problems that are not suitable for expressing the real-time characteristics of the power grid

Active Publication Date: 2013-10-02
STATE GRID CORP OF CHINA +3
View PDF3 Cites 6 Cited by
  • Summary
  • Abstract
  • Description
  • Claims
  • Application Information

AI Technical Summary

Problems solved by technology

However, this method is not very suitable for expressing the real-time characteristics of the grid

Method used


Image

  • Visual display method for power distribution network

Examples


Embodiment 1

[0021] Embodiment 1: A distribution network-oriented visual display method for displaying real-time data during distribution network operation.

[0022] This method is mainly used in five scenarios: distribution network topology visualization, live area visualization, pilot area visualization, voltage level visualization, and line load rate visualization.

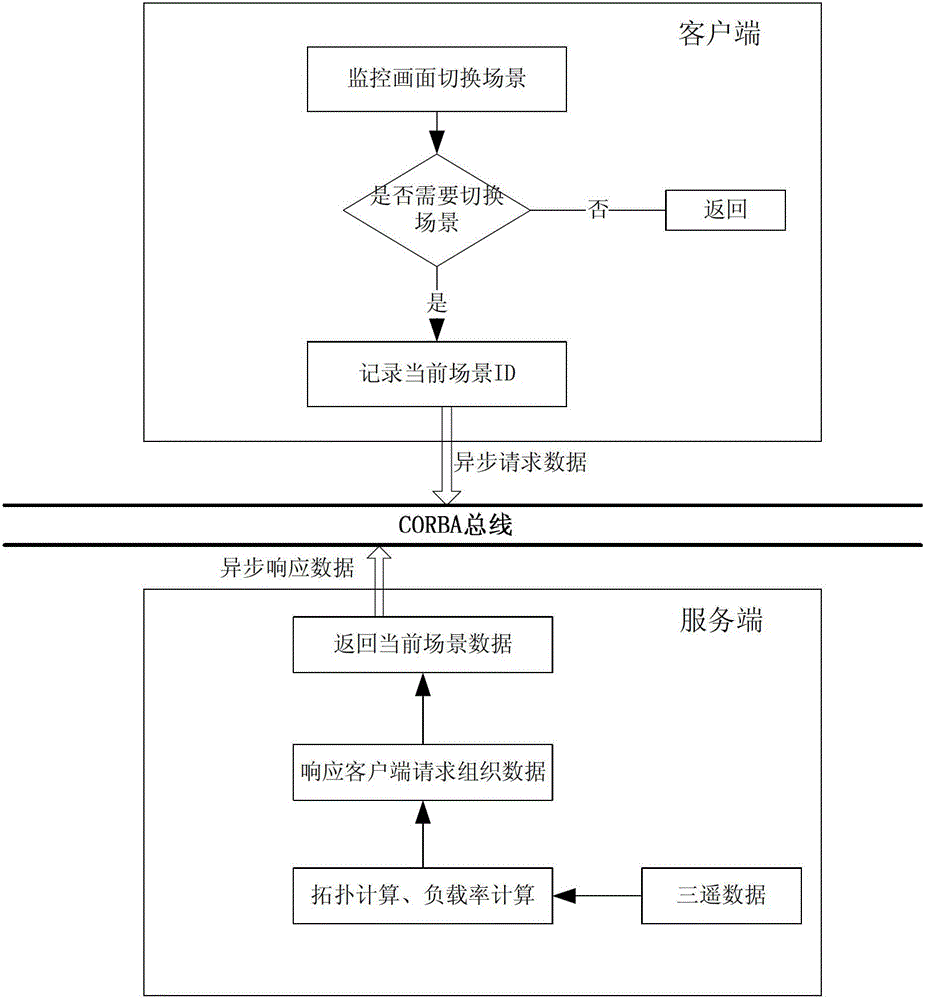
[0023] In the above scenario, the method is implemented between the connected client and the server, wherein the client and the server are connected through a CORBA bus.

[0024] The client first obtains the current visualization scene and judges whether the scene changes. If the scene changes, the client submits a corresponding visualization scene request to the server. Specifically, the client judges whether the current application scene is switched by giving the current visualization scene ID without any manual intervention. According to the characteristics of the scene, the client requests the data that needs to be expr...


PUM


Abstract

The invention relates to a visual display method for a power distribution network. The method is implemented between a client side and a server side and comprises the following steps: acquiring a current visual scene and judging whether the current visual scene is changed or not by the client side; submitting a corresponding visual scene request to the server side if the visual scene is changed; acquiring whole data of the power distribution network and calculating characteristics of the whole network by the server side; disposing the data required by the scene and then sending the data to the client side by the server side when the visual scene request is received sent by the client side; adopting different color display according to the data received to carry out visual display to the scene by the client side. The method is applied to the following five scenes: (1) distribution network topology visualization, (2) electrified area visualization, (3) pilot area visualization, (4) voltage grade visualization, and (5) circuit load rate visualization. The visual display method of power distribution network provides a uniform solution to visual scene of different distribution networks, can be configured and expanded, and can suitable for visual scene requirements of new distribution networks.

Description

technical field [0001] The invention relates to a visualization method for displaying characteristics of a distribution network. Background technique [0002] With the further improvement of the data collection capability of the DMS system and the continuous improvement of the application level of various online application software, the amount of real-time and analysis data that the power grid dispatching operation and analysis personnel need to master is increasing, and the traditional means of displaying data is even more scarce. , so that the operation analysts do not have a global view of the data, thus affecting the power grid dispatching operation and control decisions. In this context, the research on the visualization analysis and intelligent display of power grid dispatching automation system will become more and more urgent. The crossover and extension of other disciplines is an expansion of power grid dispatching automation technology and a development trend. ...

Claims


Application Information

Patent Timeline
IPC IPC(8): H04N7/18H04L29/06
Inventor 赵家庆沈浩东孙国城杜红卫韩韬周养浩邵嗣杨孙保华周宇植苏大威杨洪朱海兵田江钱科军
Owner STATE GRID CORP OF CHINA
Why Eureka
Try Eureka