Realization method of visualization framework based on distribution network

An implementation method and technology of distribution network, applied in the field of power distribution network, can solve the problems of not being able to fully understand the operation characteristics of the distribution network, poor real-time effect, and inability to intuitively reflect the operation status of the power grid, so as to achieve guaranteed efficiency and scalability Sexuality, convenience of expression, and the effect of expressing image

Active Publication Date: 2016-06-08
STATE GRID CORP OF CHINA +2
View PDF4 Cites 0 Cited by
  • Summary
  • Abstract
  • Description
  • Claims
  • Application Information

AI Technical Summary

Problems solved by technology

[0003] The existing data visualization processing methods usually adopt the following methods: (1) Express the collected or processed data in the form of tables, pie charts, curves, histograms, etc. The effect is poor, and it cannot intuitively reflect the current operating status of the power grid; (2) The power flow of the grid is expressed in the form of animation such as running arrows. Overall operating characteristics of the distribution network

Method used


Image

  • Realization method of visualization framework based on distribution network

Examples


Embodiment Construction

[0026] The present invention will be described in further detail below in conjunction with the accompanying drawings.

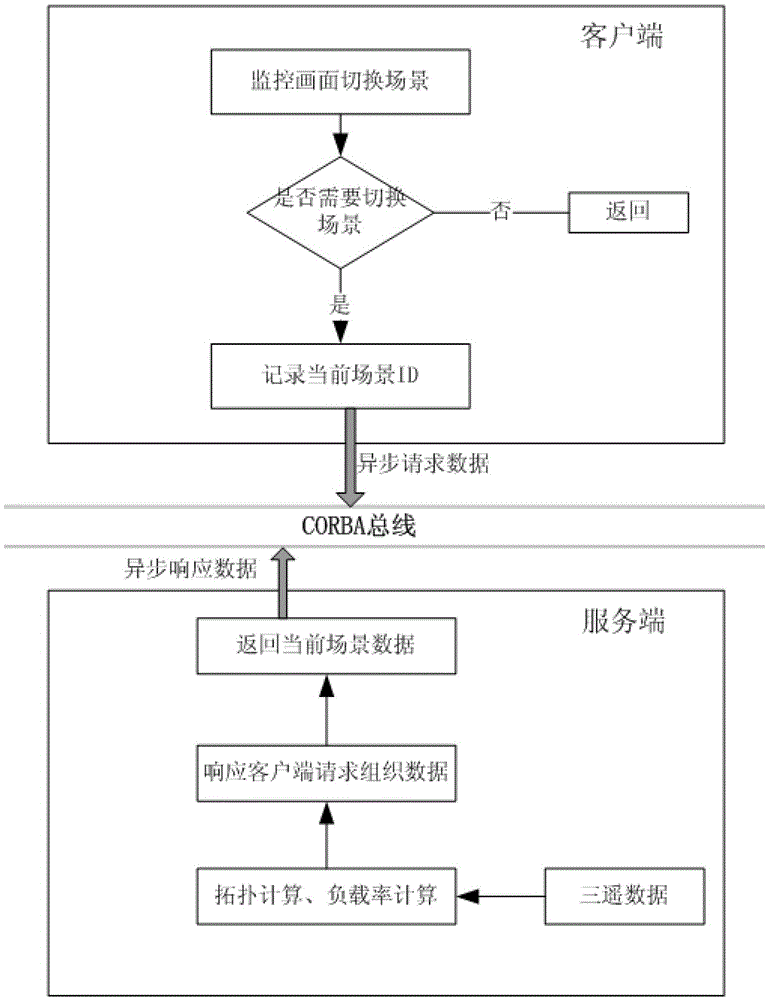
[0027] A realization method based on distribution network visualization framework, such as figure 1 As shown, it includes two parts of the process of client and server, and the client and server communicate through the CORBA bus. By giving the current visualization scene ID, the client judges whether the current application scene is switched without any manual intervention. According to the characteristics of the scene, the client requests the data that needs to be expressed in the corresponding scene and encapsulates the request message packet and sends it to the CORBA bus. The server calculates various power grid indicators in real time and processes the client's request, then encapsulates the response message and sends it to the client.

[0028] A method for implementing a distribution network-based visualization framework, comprising the following steps:...


PUM


Abstract

The invention relates to a visual frame implementation method based on a power distribution network. The visual frame implementation method is technically characterized by comprising the following steps that a client acquires a visual scene of a current picture and an ID (identifier) corresponding to the visual scene; the client judges whether the visual scene is changed or not; if the visual scene is changed, the client submits a visual scene request to a server; the server receives the visual scene request of the client and arranges data needing to respond to the client; the server sends the corresponding arranged data to the client; and the client receives response data sent by the server, and colors a visual frame according to the data. By carrying out visual representation through different colors for different visual application scenes, the characteristics of the power distribution network can be intuitively and effectively displayed on a daily user monitoring picture and can be vividly and conveniently expressed, and power network operation and maintenance staff can intuitively check the operation characteristics of the power distribution network.

Description

technical field [0001] The invention belongs to the technical field of power distribution network, in particular to a method for realizing a visualization framework based on distribution network. Background technique [0002] At present, with the further improvement of the data collection capability of the distribution network management system (DMS) and the continuous improvement of the application level of various online application software, the amount of real-time and analysis data that distribution network dispatching operation and analysis personnel need to master is increasing. , the traditional data display methods are even more scarce, so that the operation analysts do not have an overall view of the data, which affects the power grid dispatching operation and control decisions. In this context, the research on visual analysis and intelligent display of power grid dispatching automation system will become more and more urgent. As a key technology of intelligent dis...

Claims


Application Information

Patent Timeline
Patent Type & Authority Patents(China)
IPC IPC(8): H04L29/06H04N7/18H02J13/00
CPCY04S10/40
Inventor 张渭澎刘歆李聪利陈学民翟储臣吴琳杜红卫
Owner STATE GRID CORP OF CHINA
Why Eureka
Try Eureka