Data-driven method for time-varying cable force history identification based on monitoring acceleration
A data-driven, process identification technology, applied in measuring devices, force/torque/work measuring instruments, instruments, etc., can solve problems such as variable cable force history identification, and achieve strong robustness and reliability, high test accuracy, Simple and easy-to-use method
- Summary
- Abstract
- Description
- Claims
- Application Information
AI Technical Summary
Problems solved by technology
Method used
Image
Examples
Embodiment 1
[0057] Benchmark cable-stayed bridge ( figure 1 The C8 stay cable above) is composed of 139 5mm steel wires, the cable length L=100.95m, and the cross-sectional area A=2.73×10 -3 m 2 , the density per unit length is μ=21.43kg / m. In 2006, the C8 stay cable was replaced with an intelligent cable during the cable replacement project, which can monitor the cable force history in real time.
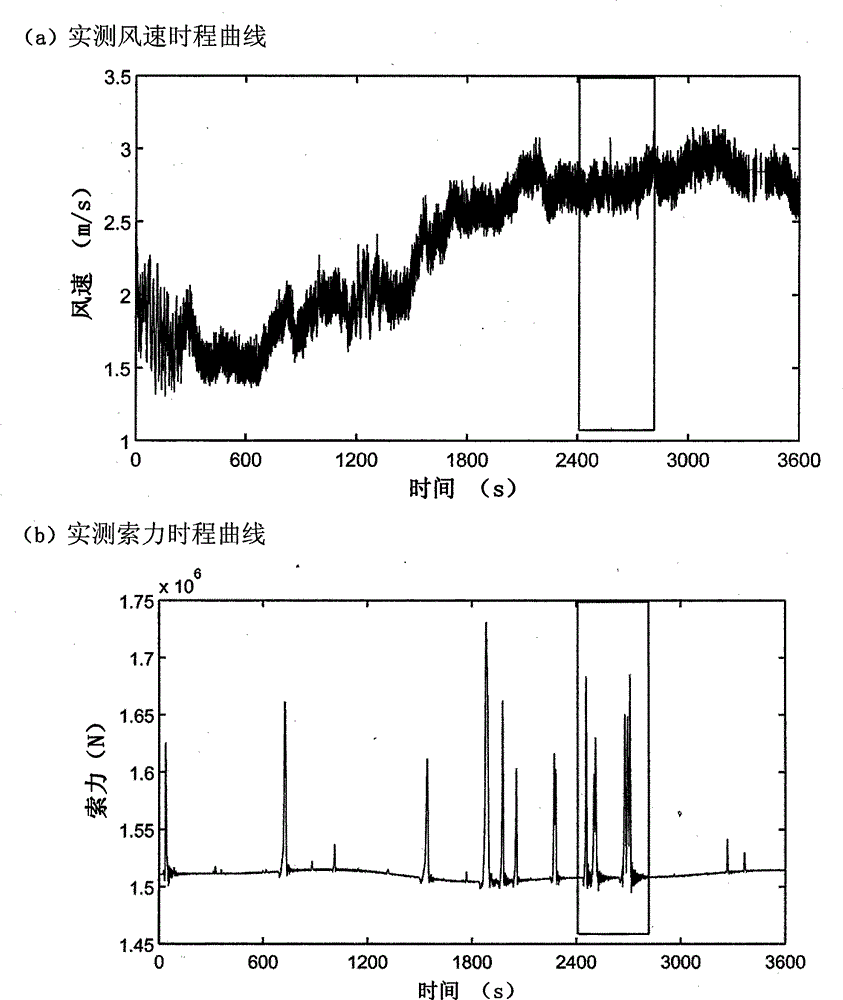
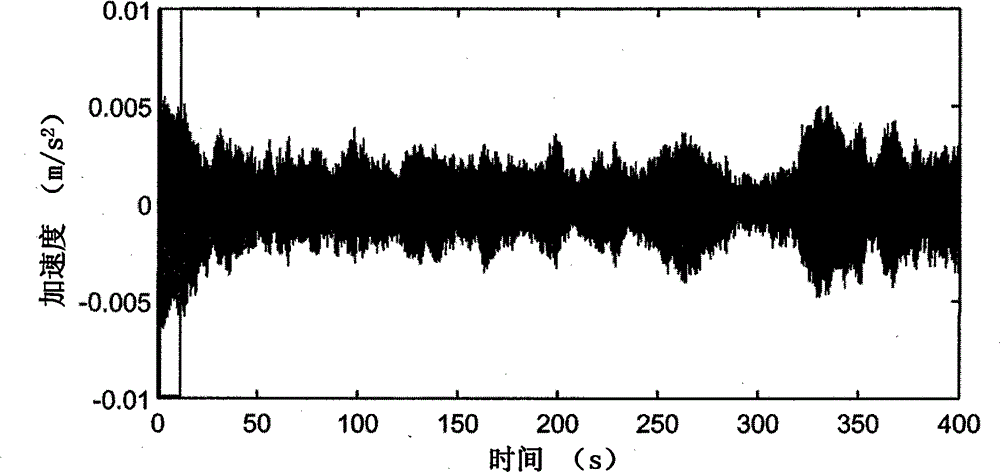
[0058] Step 1: the algorithm of the present invention needs to utilize the acceleration sensor information of 2 or at most 3 channels to identify the force of the cable, and calculate the C8 stay cable in the monitoring wind speed ( figure 2 (a)) and monitoring cable forces ( figure 2 (b)) Acceleration responses at L / 8 and L / 4 positions under action. The 10-second acceleration time history of the L / 8 channel of the C8 cable ( image 3 ) for power spectrum analysis ( Figure 4 ), the highest order frequency excited by the C8 cable is the 30th order, and it can be seen that there is an o...
Embodiment 2
[0064] The length of the test cable is 14.02m, the diameter is 1.5cm, and the mass per unit length is 1.33kg / m. One section of the test cable is fixed, and the other end uses a threaded rod to adjust the stretching length of the cable, thereby adjusting the size of the cable force. At the same time, a dynamometer is arranged at the end of the test cable to monitor the change of the cable force time history. The test cable uses 2 A fan is used as an external excitation to generate vibration.
[0065] Step 1: Lay out acceleration sensors S#1-S#3 at L / 4, L / 2 and 3 / 4L to test the out-of-plane response, the sampling frequency is 200Hz, the test device and sensor layout are as follows: Figure 8 shown. The power spectrum analysis of the 10-second acceleration time history of the test cable S#1 sensor ( Figure 11 ), the highest order frequency excited by the test cable is the 14th order, and it can be seen that there is an obvious multiplier relationship between the test cable fre...
PUM
| Property | Measurement | Unit |
|---|---|---|
| diameter | aaaaa | aaaaa |
| diameter | aaaaa | aaaaa |
Abstract
Description
Claims
Application Information
 - R&D
- Intellectual Property
- Life Sciences
- Materials
- Tech Scout
- Unparalleled Data Quality
- Higher Quality Content
- 60% Fewer Hallucinations
Browse by: Latest US Patents, China's latest patents, Technical Efficacy Thesaurus, Application Domain, Technology Topic, Popular Technical Reports.
© 2025 PatSnap. All rights reserved.Legal|Privacy policy|Modern Slavery Act Transparency Statement|Sitemap|About US| Contact US: help@patsnap.com


