Configuration on-line display method based on time series data

A time series and configuration technology, applied in data processing applications, electrical digital data processing, special data processing applications, etc., can solve the problems of complex graphics drawing and non-providing, and achieve the effect of improving the application value.

Active Publication Date: 2014-07-09
STATE GRID CORP OF CHINA +3
View PDF2 Cites 8 Cited by
  • Summary
  • Abstract
  • Description
  • Claims
  • Application Information

AI Technical Summary

Problems solved by technology

However, the B/S browser generally does not provide advanced operations such as c

Method used


Image

  • Configuration on-line display method based on time series data
  • Configuration on-line display method based on time series data
  • Configuration on-line display method based on time series data

Examples


Embodiment Construction

[0030] Hereinafter, the present invention will be further described in detail with reference to the drawings and examples.

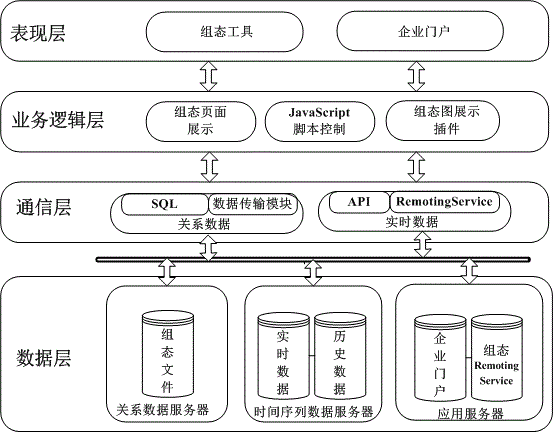
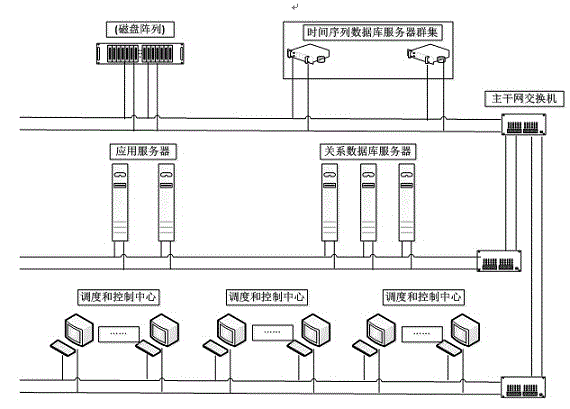
[0031] The technical scheme of the present invention strictly follows the functional specifications of the regional smart grid dispatching technical support system, and designs a method of online publishing the complex configuration diagram drawn in the C / S client to the enterprise portal for online browsing. System architecture and configuration environment such as figure 1 with figure 2 Shown.

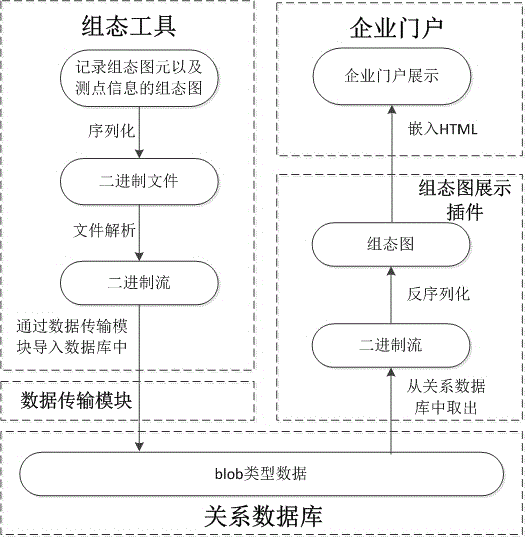
[0032] The implementation method is mainly divided into four steps: one is to draw the configuration diagram through the API and model tools of the power system real-time database on the C / S client; the other is to shield the specific operations of the underlying relational database through the data transmission module, and The configuration diagram is transferred into the relational library used by the enterprise portal in a binary stream; the third is to provide ...


PUM


Abstract

The invention discloses a configuration on-line display method based on time series data and belongs to the technical field of dispatching automation of an electric power system. The method includes that a configuration graph is drawn in a configuration tool through an API and a model tool of an electric power system real-time database at C/S clients, a data transmission module is used for shielding specific operations of a bottom layer relation database, performing serialization on the configuration graph and transmitting into a relation database which is used by an enterprise portal in a binary system stream mode, a binary system stream is taken out by a configuration graph display plug-in and analyzed to be the already drawn configuration graph, the configuration graph is displayed in hypertext markup language (Html) of the enterprise portal in an on-line mode, finally, communication between on-line displayed configuration graph and the real-time database is performed through remote transmission services, and on-line display of real-time data and trend analyses of historical data are achieved. By means of the configuration on-line display method based on the time series data, interaction of the configuration tool with the on-spot enterprise portal is achieved, and application value of the configuration tool in a power sector can be effectively improved.

Description

Technical field [0001] The invention belongs to the technical field of power system dispatching automation, and particularly relates to a configuration online display method based on time sequence data. Background technique [0002] With the continuous deepening of the construction of smart grids, the continuous deepening of research and application of power grids and substations, there are more and more information data in production, dispatching, management, and marketing. Traditional relational databases can hardly meet this level of seconds or even microseconds. Level data storage requirements, and there are problems such as low compression efficiency for big data and slow query speed. For smart grids, holographic storage of all data details of grid operation has become an important part of the construction of smart grids. In order to better integrate the data in the power grid and analyze the real-time data and historical data that have been mastered to optimize the operatio...

Claims


Application Information

Patent Timeline
IPC IPC(8): G06F17/30G06Q50/06
CPCG06F16/2474G06F16/248G06Q50/06
Inventor 袁堂顺杨勇陶敏金文德楼平王伟翁时乐王志强李贤慧
Owner STATE GRID CORP OF CHINA
Why Eureka
Try Eureka