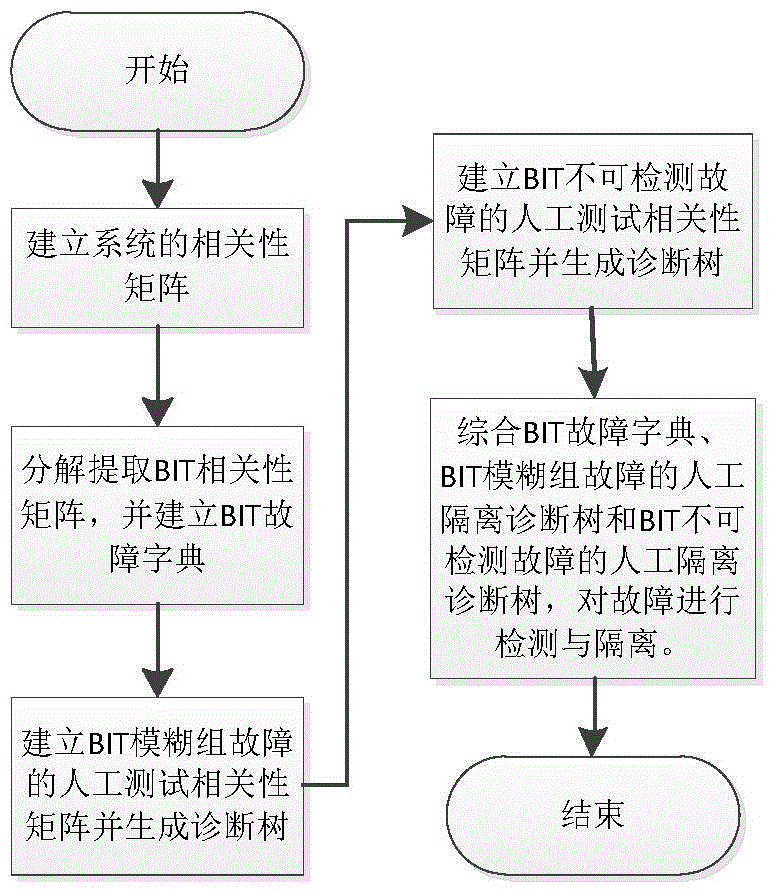
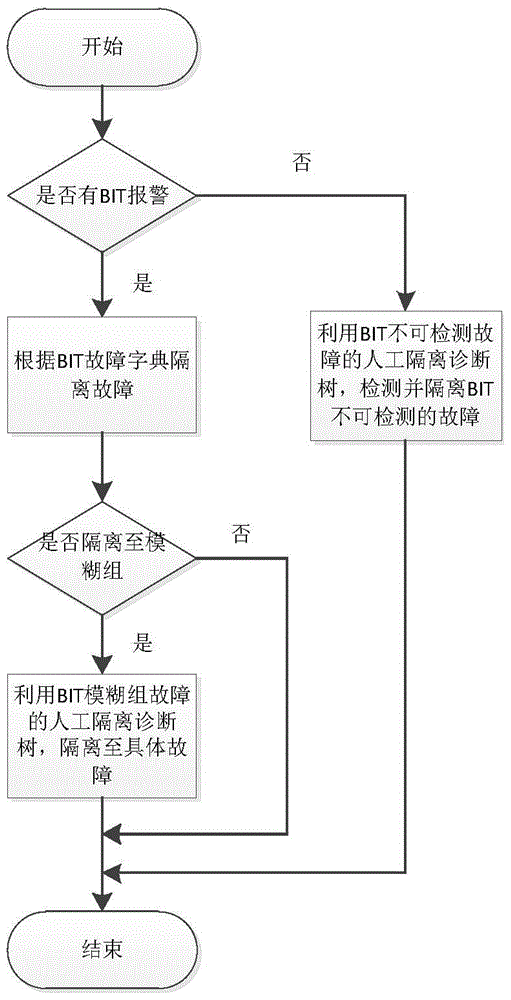
A Comprehensive Method for Fault Detection and Isolation Based on Testability Modeling Data
A technology for fault detection and modeling data, applied in the field of testability, to improve diagnostic efficiency and integrity, and improve application feasibility
- Summary
- Abstract
- Description
- Claims
- Application Information
AI Technical Summary
Problems solved by technology
Method used
Image
Examples
Embodiment
[0061] The correlation graphical model of a certain control system is as follows: Figure 4 As shown, the graphical model has three branches based on the division of functions and structures, F2, F3, F4 and F5 are one branch, F6 and F7 are one branch, and F8 is one branch. In the illustrated model, fault information can be detected by corresponding tests along the direction of the arrow. If F1 occurs, the test results of all BIT tests and manual tests are faulty; if F4 occurs, only the manual test M2 test results are faulty. The graphical model shows the functional flow and the interconnection of each component, and the correlation between each component and each test, which provides a basis for fault diagnosis and test analysis.
[0062] Step 1: Establish the correlation matrix of the system.
[0063] The graphical model of a certain control system is known, and the correlation matrix can be established accordingly. where BIT i stands for BIT test, M i Represents manual ...
PUM
 Abstract
Description
Claims
Application Information
 - R&D
- Intellectual Property
- Life Sciences
- Materials
- Tech Scout
- Unparalleled Data Quality
- Higher Quality Content
- 60% Fewer Hallucinations
Browse by: Latest US Patents, China's latest patents, Technical Efficacy Thesaurus, Application Domain, Technology Topic, Popular Technical Reports.
© 2025 PatSnap. All rights reserved.Legal|Privacy policy|Modern Slavery Act Transparency Statement|Sitemap|About US| Contact US: help@patsnap.com


