
Complex system monitoring data visualization method based on similarity measurement

A similarity measurement and complex system technology, applied in the field of high-dimensional data dimensionality reduction, can solve the problems of difficult visual analysis, large scale, high dimension of test data, etc., and achieve the effect of excellent analysis

Inactive Publication Date: 2014-09-24
HARBIN INST OF TECH
View PDF0 Cites 5 Cited by
  • Summary
  • Abstract
  • Description
  • Claims
  • Application Information

AI Technical Summary

Problems solved by technology

[0003] The purpose of the present invention is to solve the problem that the complex system test data often has the characteristics of high dimension and large scale, which is a typical high-dimensional multivariate data, and the visual analysis is difficult, and provides a visualization of complex system monitoring data based on similarity measurement method

Method used


Image

  • Complex system monitoring data visualization method based on similarity measurement
  • Complex system monitoring data visualization method based on similarity measurement
  • Complex system monitoring data visualization method based on similarity measurement

Examples


specific Embodiment approach 1

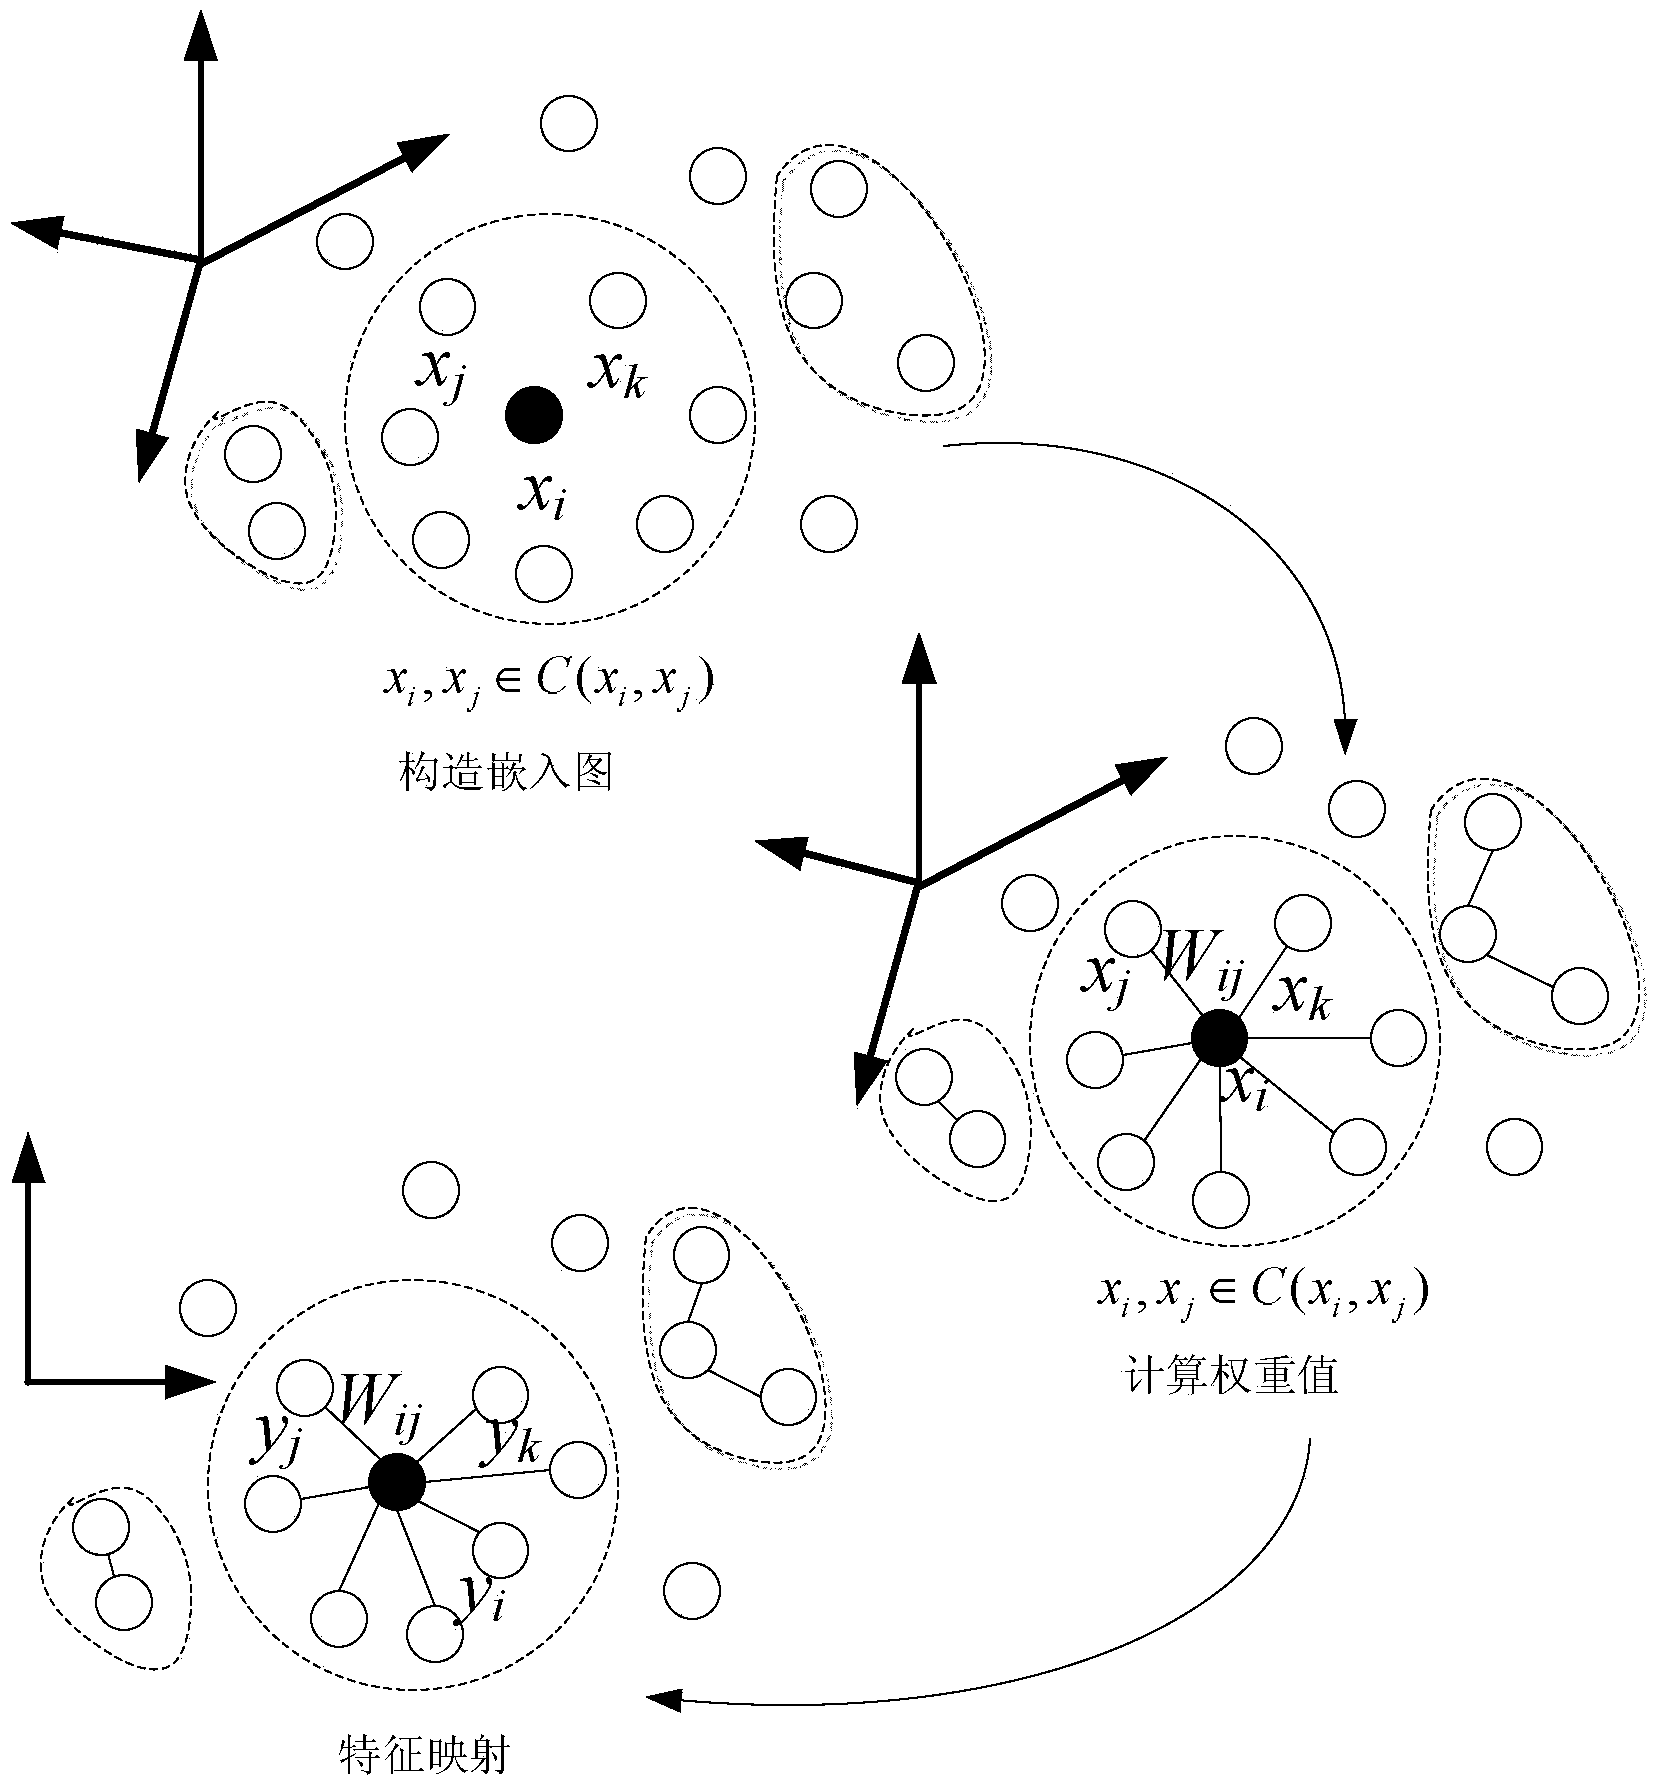
[0021] Specific implementation mode one: the following combination figure 1 Describe this embodiment, the visualization method of complex system monitoring data based on similarity measurement described in this embodiment, the method includes the following steps:

[0022] Step 1. Collect complex system monitoring data. The complex system monitoring data X is an n-dimensional matrix of type m, that is, an n×m matrix X{x 1 ,x 2 ,...,x m}, x i ,x j ∈ R n ,i,j=1,2,...m,x i ,x j is an n-dimensional column vector, R n is an n-dimensional real number set;

[0023] Step two, according to W ij = e - | | x i - ...

specific Embodiment approach 2

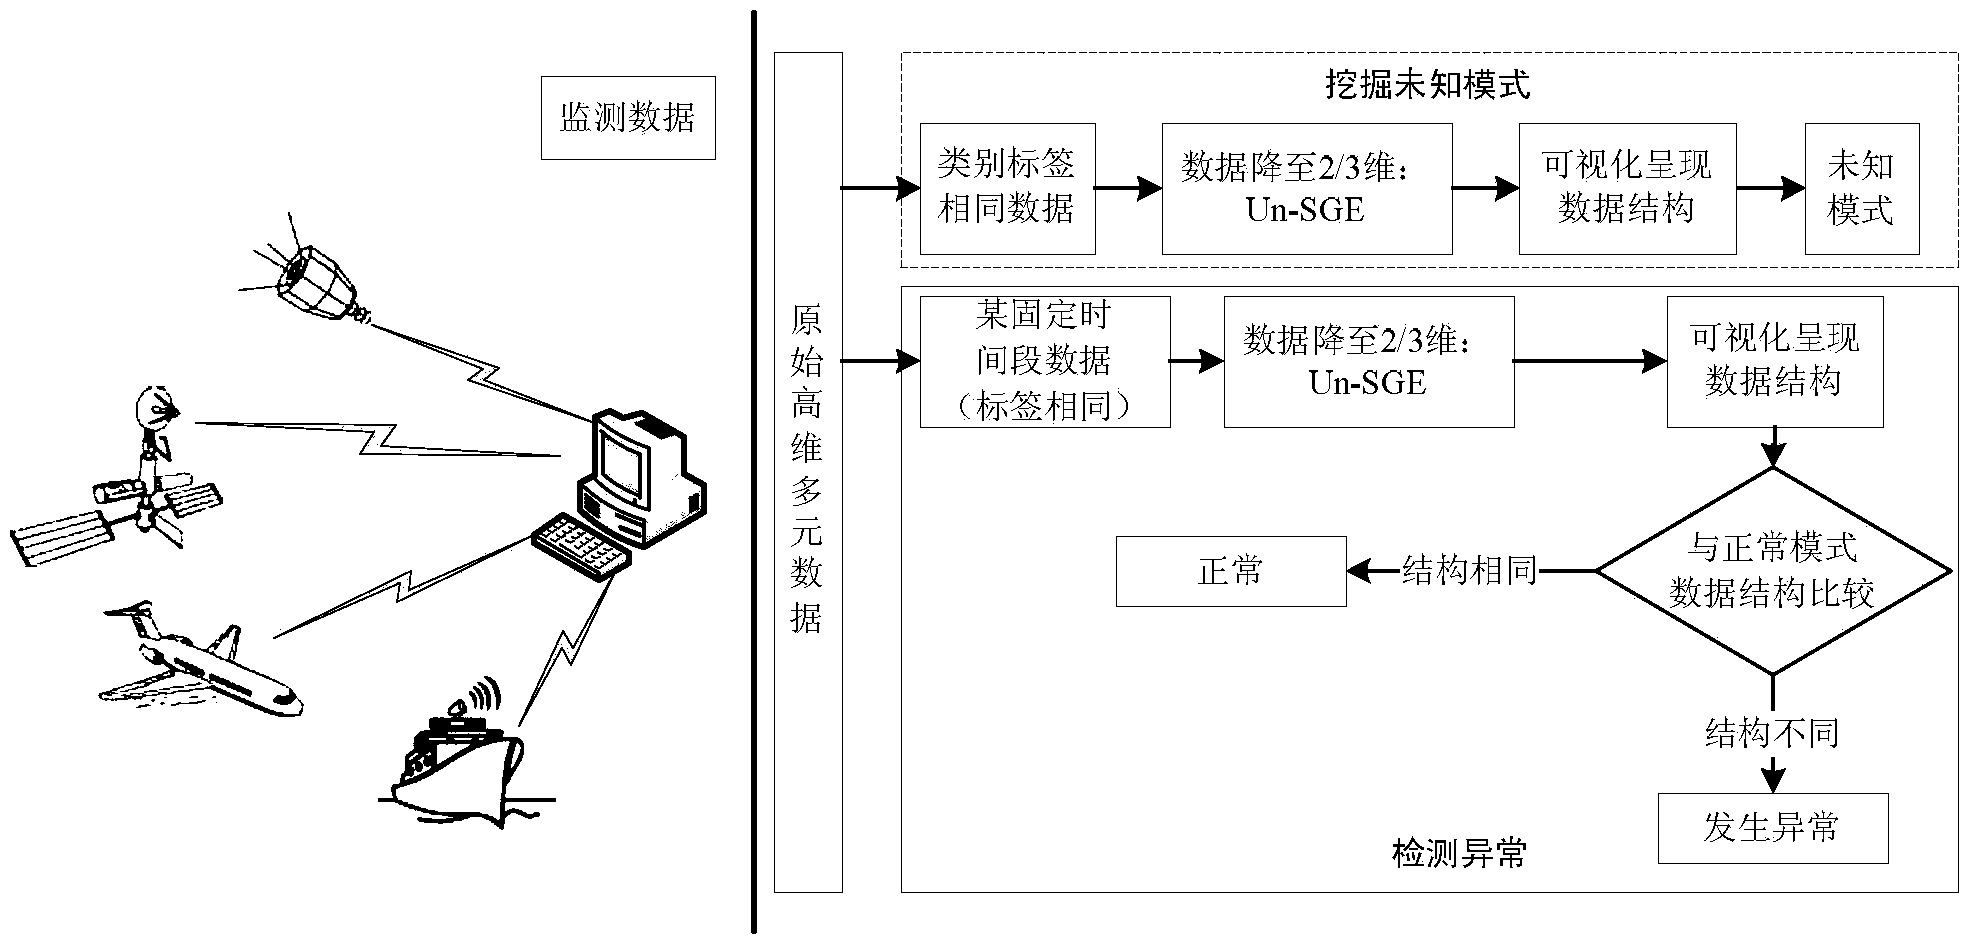
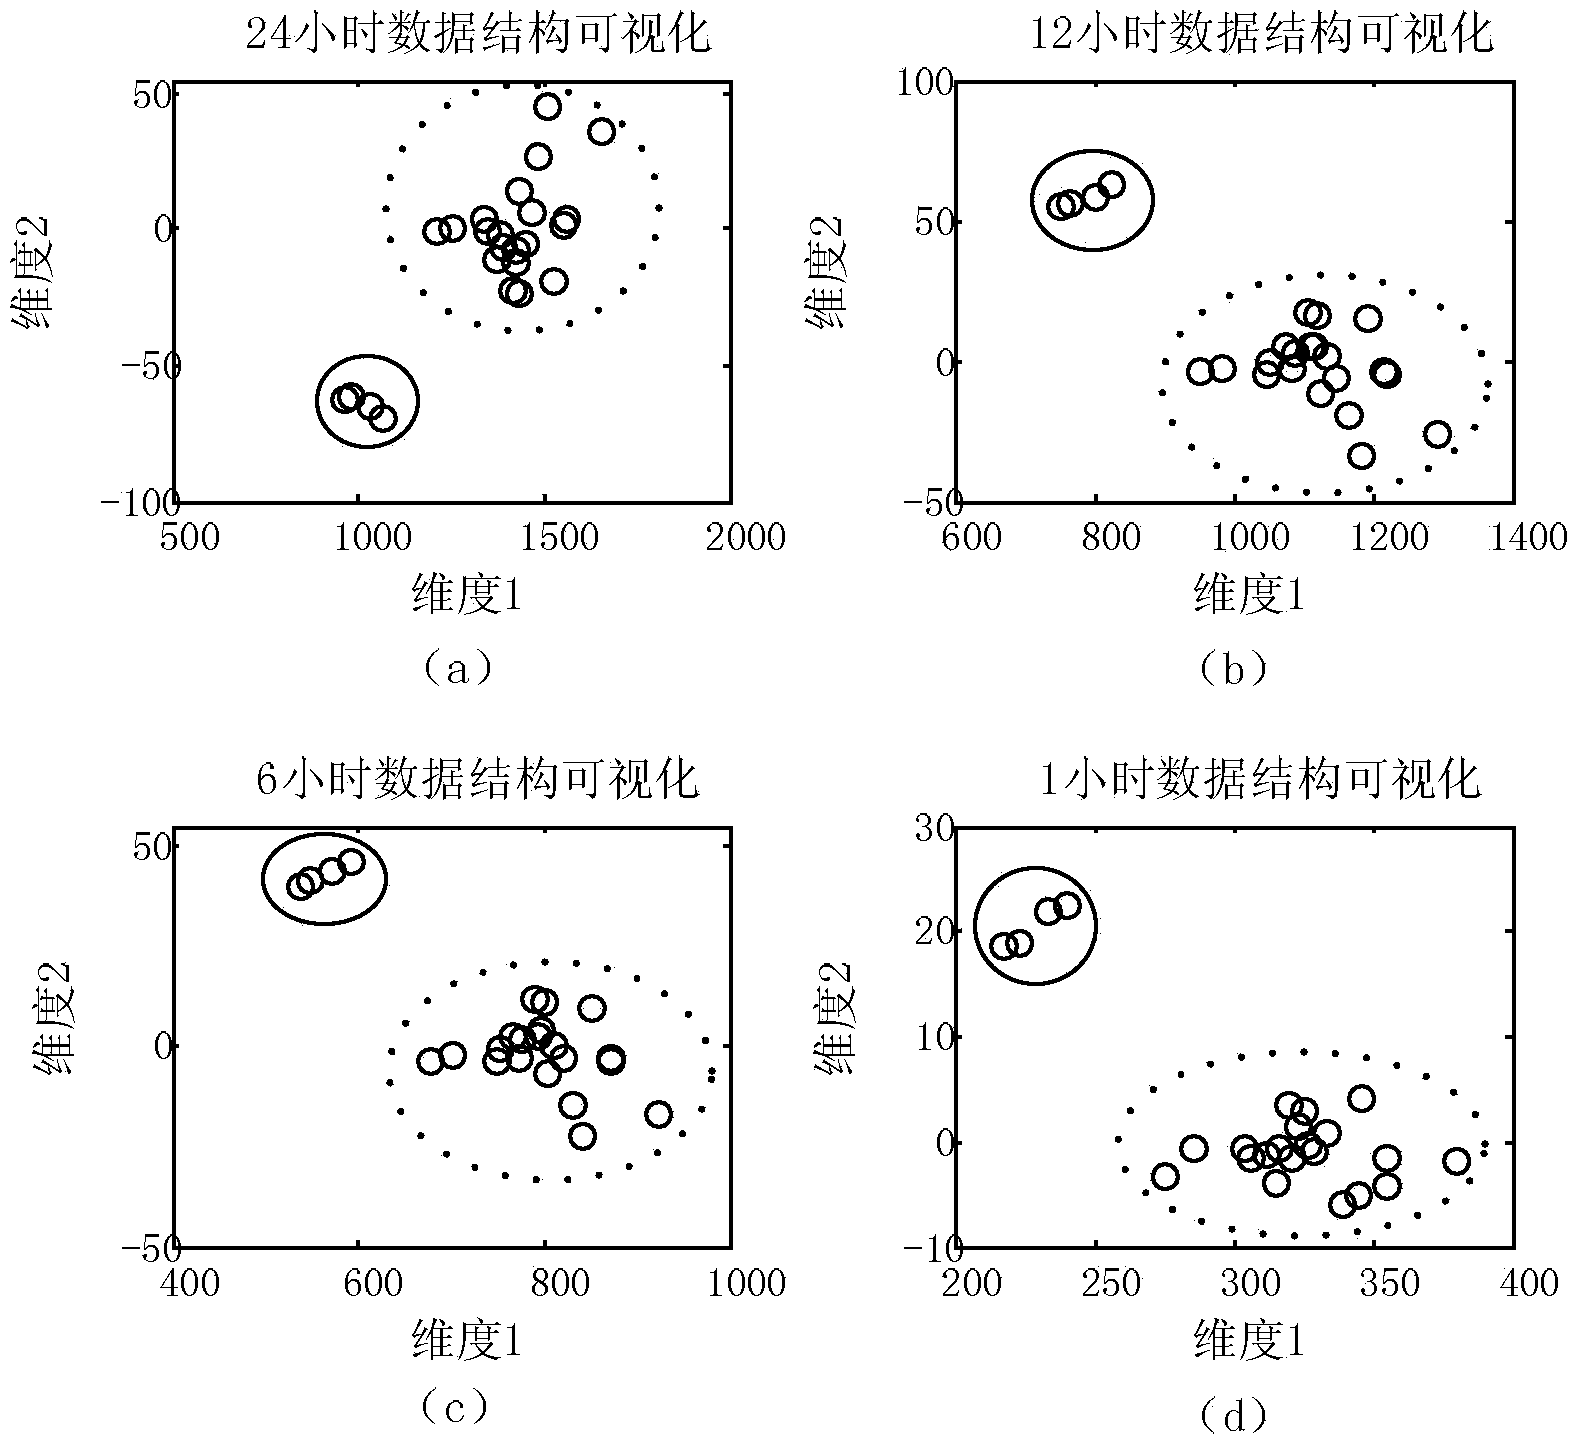
[0034] Specific implementation mode two: combination Figure 2 to Figure 7 Given a specific example, figure 2 It is a specific implementation scheme of the algorithm Un-SGES involved in the method of the present invention in visual presentation and analysis of complex system monitoring data. It is mainly used to analyze data with the same label, and has two application goals: mining unknown patterns and detecting anomalies.

[0035] Mining aspects of data unknown patterns: Mining unknown patterns hidden in data with the same label. Use the Un-SGES algorithm to reduce the dimensionality of multivariate high-dimensional data with the same label, and then visualize its structure. Analyze structural characteristics, analyze data patterns, and mine useful information and knowledge hidden in data.

[0036] In terms of abnormality detection: treat the complex system monitoring data obtained by monitoring with the same category label as the original high-dimensional multivariate d...


PUM


Abstract

The invention relates to a complex system monitoring data visualization method based on similarity measurement and belongs to the technical field of complex systems to solve the problems that complex system test data normally are high in dimension and large in size and are typical high dimensional multivariable data, and visualization analysis is difficult. The complex system monitoring data visualization method based on similarity measurement comprises the following steps that firstly, a mapping graph is established; secondly, weights are calculated; thirdly, feature mapping is conducted, dimension reduction is conducted on an m-class n-dimensional matrix through the complex system monitoring data, the high dimensional data are reduced into two-dimensional or three-dimensional data which can be seen by human eyes, the structural relations among the data points are observed in a visible space, and the visualization presentation of high dimensional data is achieved.

Description

technical field [0001] The invention relates to a method for dimensionality reduction of high-dimensional data, which belongs to the technical field of complex systems such as satellites. Background technique [0002] With the needs of national defense and national production and construction, my country has more and more demands for large and complex systems such as aviation, spacecraft or satellites. In order to ensure the high reliability and long life of various systems, various types of missions are In each stage of , experiment, development, production and operation, it is necessary to measure or monitor a large number of engineering parameters, thereby generating a large amount of even massive test and monitoring data. Effective analysis and mining of these test data can be used to analyze the operating status of the system, Comprehensively grasp and evaluate the health status, so as to provide effective information support for system maintenance. Visual analysis of la...

Claims


Application Information

Patent Timeline
IPC IPC(8): G06F19/00
Inventor 刘大同彭宇印姗梁军李君宝
Owner HARBIN INST OF TECH
Learn More