Thermodynamic chart generating method and method

A heat map and changing technology, applied in the direction of program control devices, special data processing applications, instruments, etc., can solve the problems that the heat map cannot show the user's staying and reading behavior, and cannot fully show the user's web page behavior, so as to fully display the web page reading effect of behavior

Active Publication Date: 2014-12-24
BEIJING GRIDSUM TECH CO LTD
View PDF3 Cites 22 Cited by
  • Summary
  • Abstract
  • Description
  • Claims
  • Application Information

AI Technical Summary

Problems solved by technology

[0005] The present invention is proposed in view of the problem that the existing heat map cannot show the user's staying and reading behavior, and thus cannot fully display the user's webpage behavior. Therefore, the main purpose of the present invention is to provide a data processing method and device for heat map , to solve the above problem

Method used


Image

  • Thermodynamic chart generating method and method
  • Thermodynamic chart generating method and method
  • Thermodynamic chart generating method and method

Examples


Embodiment Construction

[0028] It should be noted that, in the case of no conflict, the embodiments in the present application and the features in the embodiments can be combined with each other. The present invention will be described in detail below with reference to the accompanying drawings and examples.

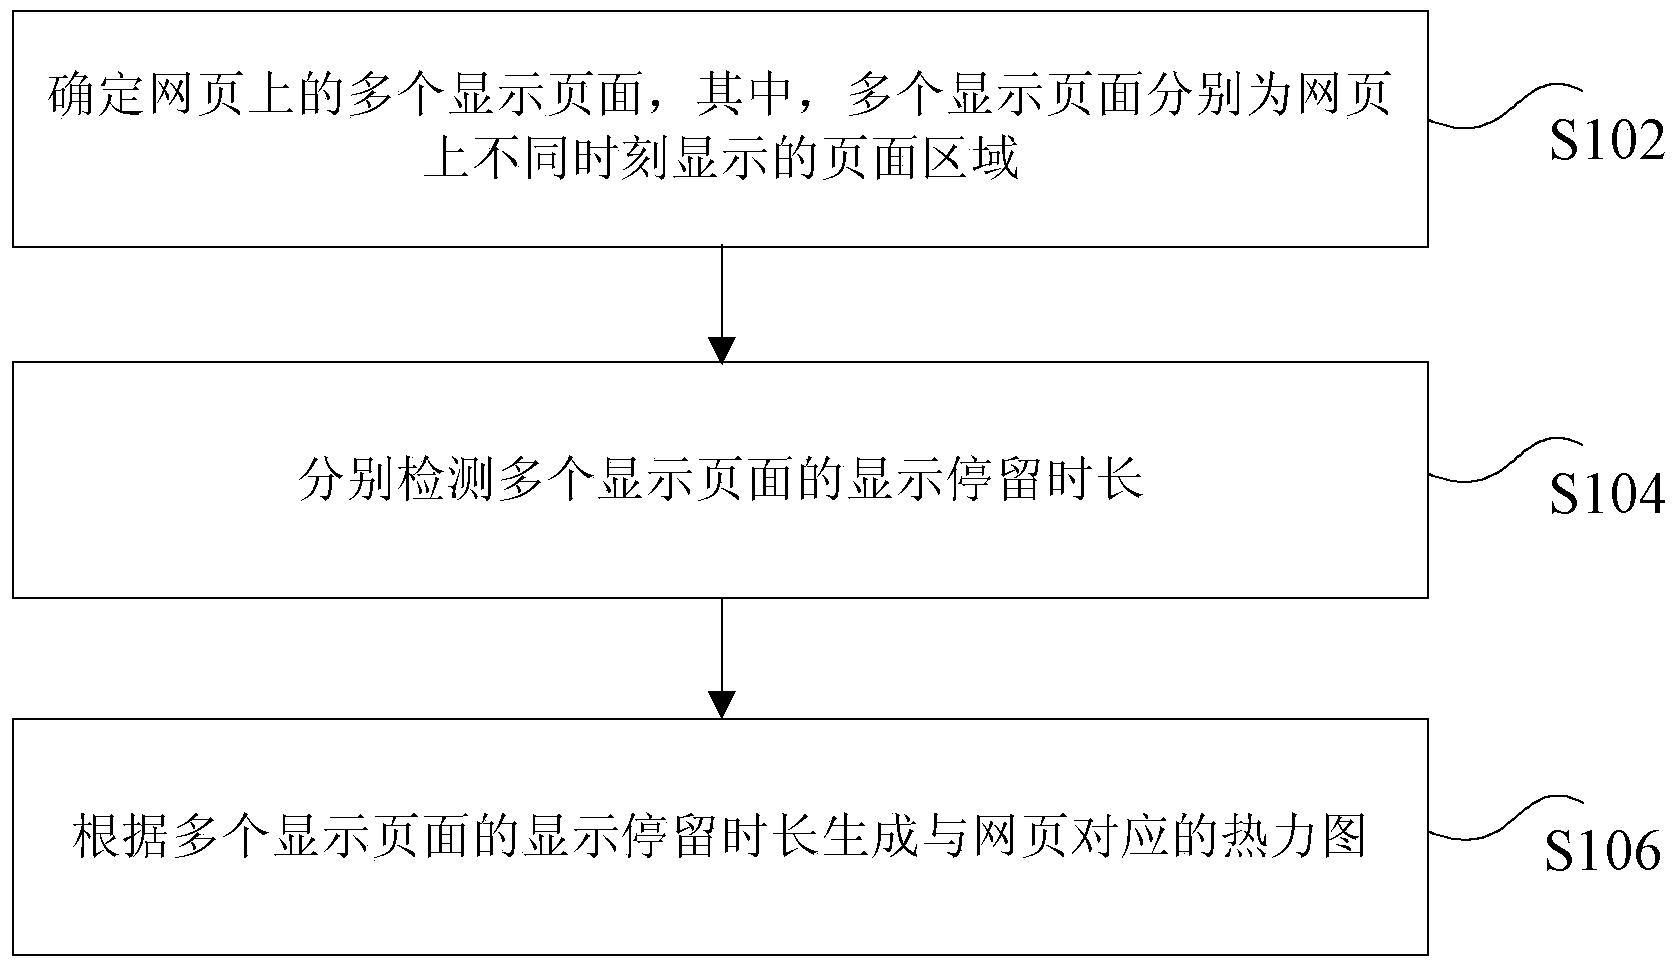
[0029] figure 1 is a flow chart of the first embodiment of the method for generating a heat map according to the present invention. Such as figure 1 As shown, the method includes the following steps:

[0030] Step S102, determining multiple display pages on the webpage, where the multiple display pages are page areas displayed at different times on the webpage.

[0031] When the user browses the webpage, the page to be browsed is changed by rolling the scroll wheel of the mouse. To fully read the entire webpage, the user needs to scroll several times, and the page displayed by the webpage every time the scroll is rolled is a display page described in this step (ie, the page part where the u...


PUM


Abstract

The invention discloses a thermodynamic chart generating method and method. The thermodynamic chart generating method comprises the following steps that a plurality of display pages on a webpage are determined, wherein the display pages are respectively page regions displayed in different moments on the webpage; the display retaining duration of each of the display pages is respectively detected; a thermodynamic chart corresponding to the webpage is generated according to the display retaining duration of the display pages. Through the method and the device, the thermodynamic chart can express the reading retaining duration of a user in different webpage regions, so the webpage reading behavior of the user can be more comprehensively and sufficiently reflected.

Description

technical field [0001] The present invention relates to the field of web page data statistics, in particular to a method and device for generating a heat map. Background technique [0002] With the development of the Internet, the increase in the number of netizens, and the diversification and simplification of the way of surfing the Internet, more and more website owners begin to pay attention to the behavior of netizens on their own websites to improve the design of the website and optimize the content of the website. The website analysis industry has attracted much attention. Therefore, it is also an essential link to visualize the user's behavior on the website. Among them, the heat map is a more intuitive way to display user behavior on the page. The existing heat map drawing method is based on the information received by the server including the user's click behavior (recording the values ​​of the horizontal and vertical coordinates of the user's click on the web pag...

Claims


Application Information

Patent Timeline
Patent Type & Authority Applications(China)
IPC IPC(8): G06F9/44G06F17/30
Inventor 钦滨杰陈俊宏
Owner BEIJING GRIDSUM TECH CO LTD
Why Eureka
Try Eureka