Analysis and visualization of OCT angiography data

A blood vessel and data technology, applied in the field of analysis and visualization, can solve problems such as no description

Active Publication Date: 2015-01-07
CARL ZEISS MEDITEC AG
View PDF15 Cites 18 Cited by
  • Summary
  • Abstract
  • Description
  • Claims
  • Application Information

AI Technical Summary

Problems solved by technology

However, they do not describe the use of such a

Method used


Image

  • Analysis and visualization of OCT angiography data
  • Analysis and visualization of OCT angiography data
  • Analysis and visualization of OCT angiography data

Examples


Embodiment Construction

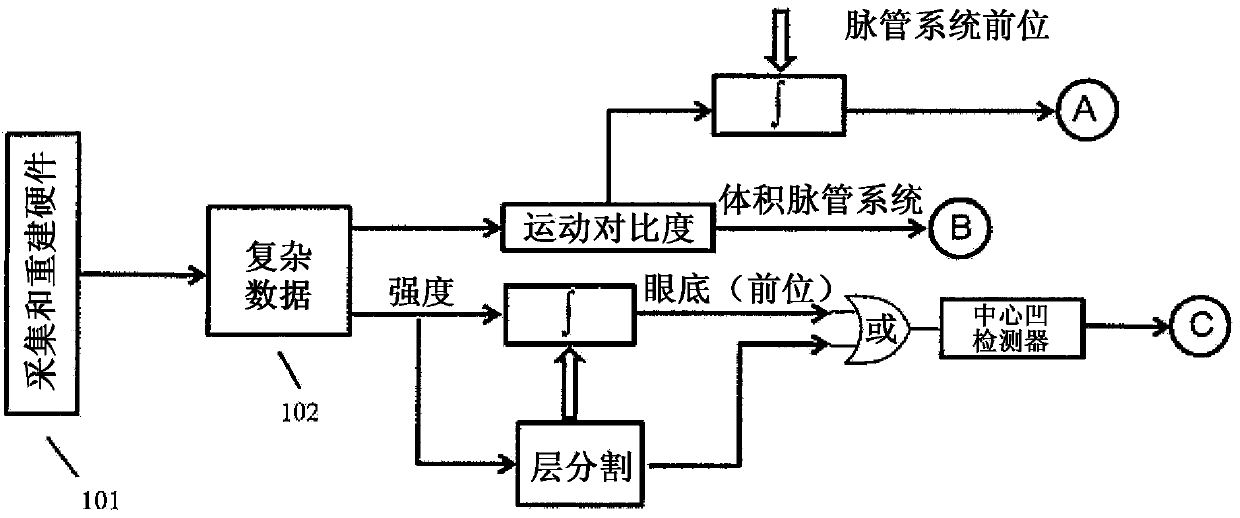
[0026] Preferred and alternative embodiments for vasculature-enhanced OCT data processing are shown in figure 1 in the schematic diagram. The figure shows three possible ways to generate and use vasculature data from complex OCT data 102 acquired and reconstructed in OCT system 101 . Each possible combination is referred to below as an "approach", A, B or C, depending on which approach path has been taken to generate the input data for the embodiment in question. In each method, different parts of complex data (intensity only, phase only, or both intensity and phase) undergo different processing steps (slice segmentation, motion contrast, integration / summation (addition) of anterior image generation) to Generate information about the different vasculature.

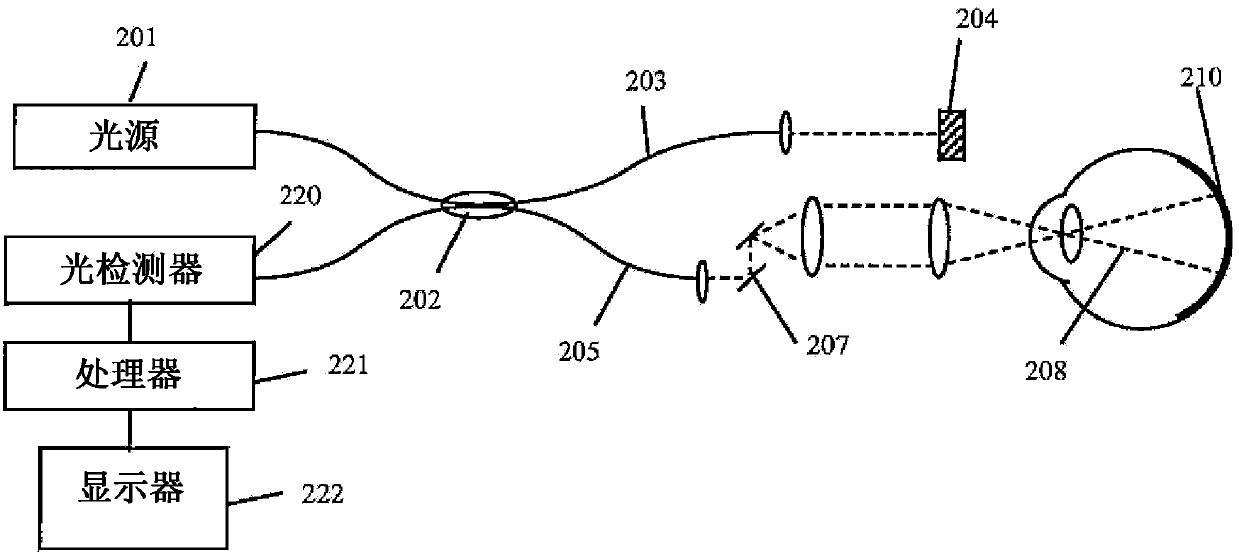
[0027] OCT data can be collected with any type of OCT system using various scanning models, for example, a spectral domain OCT system, or a scanning source OCT system using laser sources of different wavelengths such as ...


PUM


Abstract

Methods for analyzing and visualizing OCT angiography data are presented. In one embodiment, an automated method for identifying the foveal avascular zone in a two dimensional en face image generated from motion contrast data is presented. Several 3D visualization techniques are presented including one in which a particular vessel is selected in a motion contrast image and all connected vessels are highlighted. A further embodiment includes a stereoscopic visualization method. In addition, a variety of metrics for characterizing OCT angiography image data are described.

Description

[0001] priority [0002] The following applications claim priority to U.S. Provisional Application Serial No. 61 / 645,513, filed May 10, 2012, and U.S. Provisional Application Serial No. 61 / 691,219, filed August 20, 2012, the contents of which are incorporated by reference into this article. technical field [0003] The present invention relates to medical imaging, and in particular to methods of analysis and visualization of data obtained by optical coherence tomography. Background technique [0004] Optical coherence tomography is a non-invasive, non-contact imaging modality that uses coherence gating to obtain high-resolution cross-sectional images of tissue microstructure. In Fourier domain OCT (FD-OCT), the interference signal between light from a reference and backscattered light from a sample point is recorded in the frequency domain (frequency domain) rather than the time domain (time domain). After wavelength calibration, a one-dimensional Fourier transform is take...

Claims


Application Information

Patent Timeline
IPC IPC(8): A61B3/10G01B9/02
CPCG06T19/00G06T2207/30041G01B9/02083A61B3/102G01B9/02091G06T7/2006G06T2207/10101G06T2210/41G06T7/215A61B3/0025G06T7/20G06T11/003
Inventor 玛丽·德宾乌特卡什·萨尔马西达尔塔·斯里瓦斯塔瓦蒂尔曼·施莫尔
Owner CARL ZEISS MEDITEC AG
Why Eureka
Try Eureka