Model classification method based on frequency modulation continuous wave radar
A frequency modulation continuous wave and vehicle classification technology, which is applied in the field of vehicle detection in intelligent transportation, can solve problems such as complex operation, and achieve the effect of simple calculation and convenient operation
- Summary
- Abstract
- Description
- Claims
- Application Information
AI Technical Summary
Problems solved by technology
Method used
Image

Examples
Embodiment Construction
[0031] The technical solution of the present invention will be described in detail below in conjunction with the accompanying drawings.
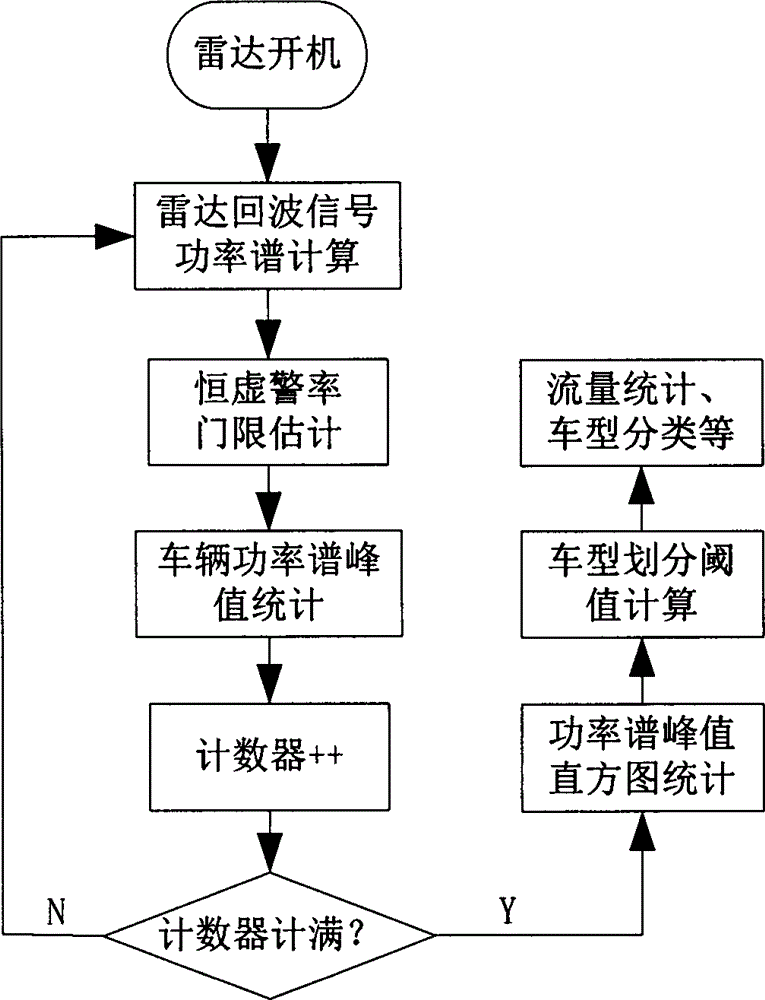
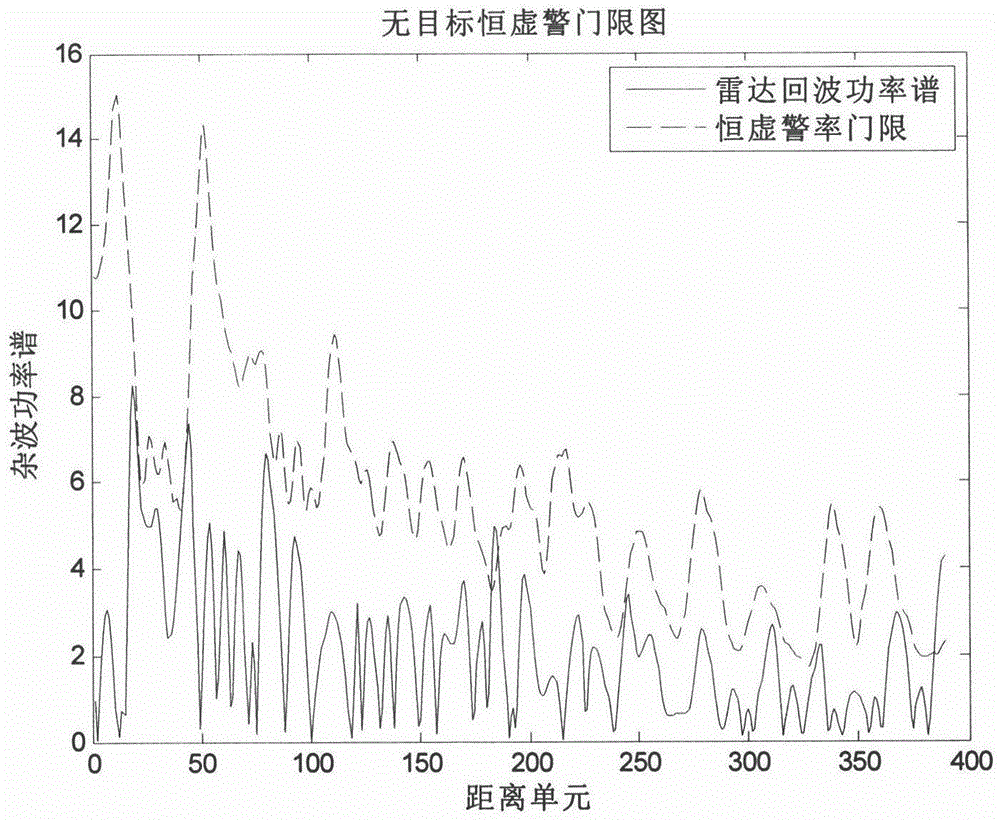
[0032] Such as figure 1 As shown in the flow chart of the vehicle classification method based on frequency-modulated continuous wave radar according to a specific embodiment of the present invention, the constant false alarm rate processing is first performed to estimate the power spectrum of noise and interference and set the threshold, and then the power spectrum of the vehicle is peak statistics. After the vehicle's power spectrum peaks have accumulated to a certain number, histogram statistics are performed on the results. Finally, according to the results of the histogram statistics, the power spectrum peak energy segmentation threshold corresponding to different vehicle types is adaptively obtained, and finally the purpose of traffic statistics and vehicle type classification is achieved.
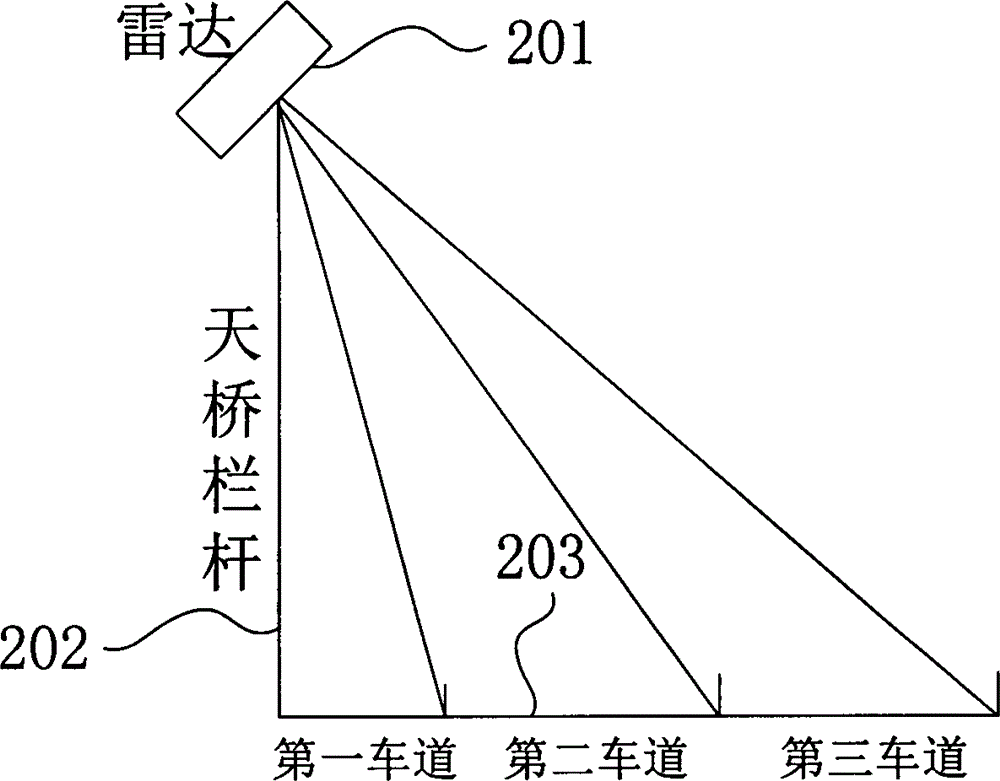
[0033] Such as figure 2 According to a sc...
PUM
 Abstract
Description
Claims
Application Information
PatSnap Eureka turns technology decisions into work you can execute. Powered by our Innovation Knowledge Graph, it runs expert workflows across engineering, life sciences, materials and intellectual property. Get your review-ready output in minutes.


